
 Login Sign Up


| |||||
 |  | ||||

| 12Stocks.com Market Intelligence |
Best Biotech Stocks
|
|
| Quick Read: Best Biotech Stocks List By Performances & Trends: Daily, Weekly, Year-to-Date, Market Cap (Size) & Technical Trends | |||
| Best Biotech Stocks Views: Quick Browse View, Summary & Slide Show View | |||
| 12Stocks.com Biotech Stocks Performances & Trends Daily | |||||||||
|
|  The overall market intelligence score is 10 (0-bearish to 100-bullish) which puts Biotech sector in short term bearish trend. The market intelligence score from previous trading session is 0 and hence an improvement of trend.
| ||||||||
Here are the market intelligence trend scores of the most requested Biotech stocks at 12Stocks.com (click stock name for detailed review):
|


| 12Stocks.com: Investing in Biotech sector with Stocks | |
|
The following table helps investors and traders sort through current performance and trends (as measured by market intelligence score) of various
stocks in the Biotech sector. Quick View: Move mouse or cursor over stock symbol (ticker) to view short-term Technical chart and over stock name to view long term chart. Click on  to add stock symbol to your watchlist and to add stock symbol to your watchlist and  to view watchlist. Click on any ticker or stock name for detailed market intelligence report for that stock. to view watchlist. Click on any ticker or stock name for detailed market intelligence report for that stock. |
12Stocks.com Performance of Stocks in Biotech Sector
| Ticker | Stock Name | Watchlist | Category | Recent Price | Market Intelligence Score | Change % | YTD Change% |
| FBIOP | Fortress |   | Biotechnology | 15.55 | 53 | 0.00% | 31.00% |
| AGIO | Agios | | Biotechnology | 28.92 | 83 | -1.73% | 29.86% |
| SMMT | Summit | | Biotechnology | 3.38 | 0 | -3.85% | 29.31% |
| CNTA | Centessa | | Biotechnology | 10.40 | 31 | -3.61% | 28.71% |
| LTRN | Lantern Pharma | | Biotechnology | 5.52 | 36 | -5.96% | 28.67% |
| KRYS | Krystal | | Biotechnology | 159.58 | 31 | -2.68% | 28.63% |
| SLN | Silence | | Biotechnology | 22.50 | 65 | 2.39% | 28.20% |
| GRTX | Galera | | Biotechnology | 0.19 | 54 | 0.54% | 27.92% |
| FATE | Fate | | Biotechnology | 4.72 | 20 | -6.35% | 26.20% |
| MLYS | Mineralys | | Biotechnology | 10.99 | 23 | -5.34% | 26.03% |
| IBIO | iBio | | Biotechnology | 1.72 | 54 | -2.82% | 25.55% |
| HUMA | Humacyte | | Biotechnology | 3.56 | 100 | 9.86% | 25.53% |
| AVDL | Avadel | | Biotechnology | 17.46 | 78 | 0.46% | 23.65% |
| ADAP | Adaptimmune | | Biotechnology | 0.97 | 43 | 8.43% | 22.84% |
| GLSI | Greenwich Life | | Biotechnology | 13.01 | 36 | -0.84% | 22.74% |
| FGEN | FibroGen | | Biotechnology | 1.09 | 20 | -7.26% | 22.42% |
| RVMD | Revolution Medicines | | Biotechnology | 35.02 | 56 | -2.26% | 22.11% |
| VNDA | Vanda | | Biotechnology | 5.14 | 93 | 3.42% | 21.80% |
| ALGS | Aligos | | Biotechnology | 0.79 | 48 | 1.55% | 21.77% |
| CCCC | C4 | | Biotechnology | 6.80 | 49 | -1.59% | 20.57% |
| AVIR | Atea | | Biotechnology | 3.67 | 40 | -0.68% | 20.49% |
| VCEL | Vericel | | Biotechnology | 42.88 | 36 | -2.25% | 20.40% |
| CRNX | Crinetics | | Biotechnology | 42.84 | 31 | -0.40% | 20.40% |
| FDMT | 4D Molecular | | Biotechnology | 24.79 | 36 | -1.04% | 19.76% |
| APRE | Aprea | | Biotechnology | 5.61 | 36 | 0.00% | 19.36% |
| To view more stocks, click on Next / Previous arrows or select different range: 0 - 25 , 25 - 50 , 50 - 75 , 75 - 100 , 100 - 125 , 125 - 150 , 150 - 175 , 175 - 200 , 200 - 225 , 225 - 250 , 250 - 275 , 275 - 300 , 300 - 325 , 325 - 350 , 350 - 375 , 375 - 400 | ||
 | Click To Change The Sort Order: By Market Cap or Company Size Performance: Year-to-date, Week and Day |  |
|
Get the most comprehensive stock market coverage daily at 12Stocks.com ➞ Best Stocks Today ➞ Best Stocks Weekly ➞ Best Stocks Year-to-Date ➞ Best Stocks Trends ➞  Best Stocks Today 12Stocks.com Best Nasdaq Stocks ➞ Best S&P 500 Stocks ➞ Best Tech Stocks ➞ Best Biotech Stocks ➞ |
| Detailed Overview of Biotech Stocks |
| Biotech Technical Overview, Leaders & Laggards, Top Biotech ETF Funds & Detailed Biotech Stocks List, Charts, Trends & More |
| Biotech Sector: Technical Analysis, Trends & YTD Performance | |
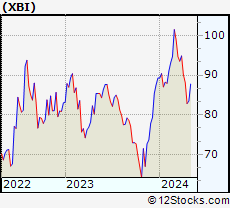
| Biotech sector, as represented by XBI, an exchange-traded fund [ETF] that holds basket of Biotech stocks (e.g, Amgen, Celgene) is down by -8.88% and is currently underperforming the overall market by -12.03% year-to-date. Below is a quick view of Technical charts and trends: | |
 XBI Weekly Chart |
|
| Long Term Trend: Not Good | |
| Medium Term Trend: Not Good | |
 XBI Daily Chart |
|
| Short Term Trend: Very Good | |
| Overall Trend Score: 10 | |
| YTD Performance: -8.88% | |
| **Trend Scores & Views Are Only For Educational Purposes And Not For Investing | |
| 12Stocks.com: Top Performing Biotech Sector Stocks | ||||||||||||||||||||||||||||||||||||||||||||||||
 The top performing Biotech sector stocks year to date are
Now, more recently, over last week, the top performing Biotech sector stocks on the move are


|
||||||||||||||||||||||||||||||||||||||||||||||||
| 12Stocks.com: Investing in Biotech Sector using Exchange Traded Funds | |
|
The following table shows list of key exchange traded funds (ETF) that
help investors track Biotech Index. For detailed view, check out our ETF Funds section of our website. Quick View: Move mouse or cursor over ETF symbol (ticker) to view short-term Technical chart and over ETF name to view long term chart. Click on ticker or stock name for detailed view. Click on to add stock symbol to your watchlist and to view watchlist. |
12Stocks.com List of ETFs that track Biotech Index
| Ticker | ETF Name | Watchlist | Recent Price | Market Intelligence Score | Change % | Week % | Year-to-date % |
| LABD | Biotech Bear 3X | | 11.32 | 80 | 7.60 | 26.06 | 16.82% |
| XBI | Biotech | | 81.36 | 10 | -2.53 | -7.7 | -8.88% |
| LABU | Biotech Bull 3X | | 81.50 | 10 | -7.43 | -21.9 | -33.18% |
| IBB | Biotechnology | | 123.61 | 0 | -0.83 | -4.61 | -9.01% |
| IYH | Healthcare | | 57.97 | 10 | -0.14 | -0.74 | 1.26% |
| IHF | Healthcare Providers | | 52.11 | 52 | 1.10 | 3.11 | -0.76% |
| CURE | Healthcare Bull 3X | | 102.75 | 25 | 0.52 | -0.62 | 0.99% |
| IXJ | Global Healthcare | | 87.48 | 25 | 0.08 | -0.57 | 0.88% |
| FBT | First NYSE | | 141.05 | 10 | -0.33 | -4.26 | -10.76% |
| BIB | Biotechnology | | 48.01 | 10 | 0.15 | -6.58 | -15.85% |
| BIS | Short Biotech | | 20.98 | 95 | 0.55 | 7.04 | 16.1% |
| BBH | Biotech | | 151.60 | 10 | -0.49 | -3.8 | -8.29% |
| PTH | DWA Healthcare Momentum | | 39.53 | 23 | -0.10 | -5.5 | 1% |
| PBE | Biotech & Genome | | 59.54 | 10 | -0.13 | -2.79 | -9.57% |
| BBC | Bio Biotechnology Clinical | | 25.32 | 23 | -0.63 | -6.65 | 3.55% |
| BBP | Bio Biotechnology Products | | 50.43 | 0 | -0.34 | -5.02 | -13.19% |
| BTEC | Principal Healthcare Innovators | | 33.86 | 0 | -0.67 | -5.92 | -6.8% |
| 12Stocks.com: Charts, Trends, Fundamental Data and Performances of Biotech Stocks | |
|
We now take in-depth look at all Biotech stocks including charts, multi-period performances and overall trends (as measured by market intelligence score). One can sort Biotech stocks (click link to choose) by Daily, Weekly and by Year-to-Date performances. Also, one can sort by size of the company or by market capitalization. |
| Select Your Default Chart Type: | |||||
| |||||
| Click on stock symbol or name for detailed view. Click on to add stock symbol to your watchlist and to view watchlist. Quick View: Move mouse or cursor over "Daily" to quickly view daily Technical stock chart and over "Weekly" to view weekly Technical stock chart. | |||||

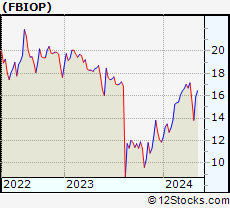 | FBIOP Fortress Biotech, Inc. |
| Sector: Health Care | |
| SubSector: Biotechnology | |
| MarketCap: 836.085 Millions | |
| Recent Price: 15.55 Market Intelligence Score: 53 | |
| Day Percent Change: 0.00% Day Change: 0.00 | |
| Week Change: -9.4% Year-to-date Change: 31.0% | |
| FBIOP Links: Profile News Message Board | |
| Charts:- Daily , Weekly | |
| Add FBIOP to Watchlist: View: Get Complete FBIOP Trend Analysis ➞ | |
 | AGIO Agios Pharmaceuticals, Inc. |
| Sector: Health Care | |
| SubSector: Biotechnology | |
| MarketCap: 2613.35 Millions | |
| Recent Price: 28.92 Market Intelligence Score: 83 | |
| Day Percent Change: -1.73% Day Change: -0.51 | |
| Week Change: -2% Year-to-date Change: 29.9% | |
| AGIO Links: Profile News Message Board | |
| Charts:- Daily , Weekly | |
| Add AGIO to Watchlist: View: Get Complete AGIO Trend Analysis ➞ | |
 | SMMT Summit Therapeutics plc |
| Sector: Health Care | |
| SubSector: Biotechnology | |
| MarketCap: 156.985 Millions | |
| Recent Price: 3.38 Market Intelligence Score: 0 | |
| Day Percent Change: -3.85% Day Change: -0.13 | |
| Week Change: -7.91% Year-to-date Change: 29.3% | |
| SMMT Links: Profile News Message Board | |
| Charts:- Daily , Weekly | |
| Add SMMT to Watchlist: View: Get Complete SMMT Trend Analysis ➞ | |
 | CNTA Centessa Pharmaceuticals plc |
| Sector: Health Care | |
| SubSector: Biotechnology | |
| MarketCap: 616 Millions | |
| Recent Price: 10.40 Market Intelligence Score: 31 | |
| Day Percent Change: -3.61% Day Change: -0.39 | |
| Week Change: -8.13% Year-to-date Change: 28.7% | |
| CNTA Links: Profile News Message Board | |
| Charts:- Daily , Weekly | |
| Add CNTA to Watchlist: View: Get Complete CNTA Trend Analysis ➞ | |
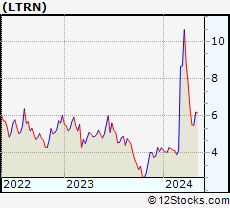 | LTRN Lantern Pharma Inc. |
| Sector: Health Care | |
| SubSector: Biotechnology | |
| MarketCap: 11487 Millions | |
| Recent Price: 5.52 Market Intelligence Score: 36 | |
| Day Percent Change: -5.96% Day Change: -0.35 | |
| Week Change: -13.62% Year-to-date Change: 28.7% | |
| LTRN Links: Profile News Message Board | |
| Charts:- Daily , Weekly | |
| Add LTRN to Watchlist: View: Get Complete LTRN Trend Analysis ➞ | |
 | KRYS Krystal Biotech, Inc. |
| Sector: Health Care | |
| SubSector: Biotechnology | |
| MarketCap: 874.085 Millions | |
| Recent Price: 159.58 Market Intelligence Score: 31 | |
| Day Percent Change: -2.68% Day Change: -4.39 | |
| Week Change: -8.09% Year-to-date Change: 28.6% | |
| KRYS Links: Profile News Message Board | |
| Charts:- Daily , Weekly | |
| Add KRYS to Watchlist: View: Get Complete KRYS Trend Analysis ➞ | |
 | SLN Silence Therapeutics plc |
| Sector: Health Care | |
| SubSector: Biotechnology | |
| MarketCap: 198 Millions | |
| Recent Price: 22.50 Market Intelligence Score: 65 | |
| Day Percent Change: 2.39% Day Change: 0.52 | |
| Week Change: 1.51% Year-to-date Change: 28.2% | |
| SLN Links: Profile News Message Board | |
| Charts:- Daily , Weekly | |
| Add SLN to Watchlist: View: Get Complete SLN Trend Analysis ➞ | |
 | GRTX Galera Therapeutics, Inc. |
| Sector: Health Care | |
| SubSector: Biotechnology | |
| MarketCap: 277.585 Millions | |
| Recent Price: 0.19 Market Intelligence Score: 54 | |
| Day Percent Change: 0.54% Day Change: 0.00 | |
| Week Change: 17.05% Year-to-date Change: 27.9% | |
| GRTX Links: Profile News Message Board | |
| Charts:- Daily , Weekly | |
| Add GRTX to Watchlist: View: Get Complete GRTX Trend Analysis ➞ | |
 | FATE Fate Therapeutics, Inc. |
| Sector: Health Care | |
| SubSector: Biotechnology | |
| MarketCap: 2022.45 Millions | |
| Recent Price: 4.72 Market Intelligence Score: 20 | |
| Day Percent Change: -6.35% Day Change: -0.32 | |
| Week Change: -20.67% Year-to-date Change: 26.2% | |
| FATE Links: Profile News Message Board | |
| Charts:- Daily , Weekly | |
| Add FATE to Watchlist: View: Get Complete FATE Trend Analysis ➞ | |
 | MLYS Mineralys Therapeutics, Inc. |
| Sector: Health Care | |
| SubSector: Biotechnology | |
| MarketCap: 719 Millions | |
| Recent Price: 10.99 Market Intelligence Score: 23 | |
| Day Percent Change: -5.34% Day Change: -0.62 | |
| Week Change: -15.53% Year-to-date Change: 26.0% | |
| MLYS Links: Profile News Message Board | |
| Charts:- Daily , Weekly | |
| Add MLYS to Watchlist: View: Get Complete MLYS Trend Analysis ➞ | |
 | IBIO iBio, Inc. |
| Sector: Health Care | |
| SubSector: Biotechnology | |
| MarketCap: 110.885 Millions | |
| Recent Price: 1.72 Market Intelligence Score: 54 | |
| Day Percent Change: -2.82% Day Change: -0.05 | |
| Week Change: -14.85% Year-to-date Change: 25.6% | |
| IBIO Links: Profile News Message Board | |
| Charts:- Daily , Weekly | |
| Add IBIO to Watchlist: View: Get Complete IBIO Trend Analysis ➞ | |
 | HUMA Humacyte, Inc. |
| Sector: Health Care | |
| SubSector: Biotechnology | |
| MarketCap: 297 Millions | |
| Recent Price: 3.56 Market Intelligence Score: 100 | |
| Day Percent Change: 9.86% Day Change: 0.32 | |
| Week Change: 23.78% Year-to-date Change: 25.5% | |
| HUMA Links: Profile News Message Board | |
| Charts:- Daily , Weekly | |
| Add HUMA to Watchlist: View: Get Complete HUMA Trend Analysis ➞ | |
 | AVDL Avadel Pharmaceuticals plc |
| Sector: Health Care | |
| SubSector: Biotechnology | |
| MarketCap: 354.485 Millions | |
| Recent Price: 17.46 Market Intelligence Score: 78 | |
| Day Percent Change: 0.46% Day Change: 0.08 | |
| Week Change: 9.19% Year-to-date Change: 23.7% | |
| AVDL Links: Profile News Message Board | |
| Charts:- Daily , Weekly | |
| Add AVDL to Watchlist: View: Get Complete AVDL Trend Analysis ➞ | |
 | ADAP Adaptimmune Therapeutics plc |
| Sector: Health Care | |
| SubSector: Biotechnology | |
| MarketCap: 380.985 Millions | |
| Recent Price: 0.97 Market Intelligence Score: 43 | |
| Day Percent Change: 8.43% Day Change: 0.08 | |
| Week Change: -16.03% Year-to-date Change: 22.8% | |
| ADAP Links: Profile News Message Board | |
| Charts:- Daily , Weekly | |
| Add ADAP to Watchlist: View: Get Complete ADAP Trend Analysis ➞ | |
 | GLSI Greenwich LifeSciences, Inc. |
| Sector: Health Care | |
| SubSector: Biotechnology | |
| MarketCap: 86487 Millions | |
| Recent Price: 13.01 Market Intelligence Score: 36 | |
| Day Percent Change: -0.84% Day Change: -0.11 | |
| Week Change: -16.87% Year-to-date Change: 22.7% | |
| GLSI Links: Profile News Message Board | |
| Charts:- Daily , Weekly | |
| Add GLSI to Watchlist: View: Get Complete GLSI Trend Analysis ➞ | |
 | FGEN FibroGen, Inc. |
| Sector: Health Care | |
| SubSector: Biotechnology | |
| MarketCap: 2502.95 Millions | |
| Recent Price: 1.09 Market Intelligence Score: 20 | |
| Day Percent Change: -7.26% Day Change: -0.08 | |
| Week Change: -20.22% Year-to-date Change: 22.4% | |
| FGEN Links: Profile News Message Board | |
| Charts:- Daily , Weekly | |
| Add FGEN to Watchlist: View: Get Complete FGEN Trend Analysis ➞ | |
 | RVMD Revolution Medicines, Inc. |
| Sector: Health Care | |
| SubSector: Biotechnology | |
| MarketCap: 28087 Millions | |
| Recent Price: 35.02 Market Intelligence Score: 56 | |
| Day Percent Change: -2.26% Day Change: -0.81 | |
| Week Change: -2.91% Year-to-date Change: 22.1% | |
| RVMD Links: Profile News Message Board | |
| Charts:- Daily , Weekly | |
| Add RVMD to Watchlist: View: Get Complete RVMD Trend Analysis ➞ | |
 | VNDA Vanda Pharmaceuticals Inc. |
| Sector: Health Care | |
| SubSector: Biotechnology | |
| MarketCap: 464.585 Millions | |
| Recent Price: 5.14 Market Intelligence Score: 93 | |
| Day Percent Change: 3.42% Day Change: 0.17 | |
| Week Change: 24.76% Year-to-date Change: 21.8% | |
| VNDA Links: Profile News Message Board | |
| Charts:- Daily , Weekly | |
| Add VNDA to Watchlist: View: Get Complete VNDA Trend Analysis ➞ | |
 | ALGS Aligos Therapeutics, Inc. |
| Sector: Health Care | |
| SubSector: Biotechnology | |
| MarketCap: 76487 Millions | |
| Recent Price: 0.79 Market Intelligence Score: 48 | |
| Day Percent Change: 1.55% Day Change: 0.01 | |
| Week Change: -20.69% Year-to-date Change: 21.8% | |
| ALGS Links: Profile News Message Board | |
| Charts:- Daily , Weekly | |
| Add ALGS to Watchlist: View: Get Complete ALGS Trend Analysis ➞ | |
 | CCCC C4 Therapeutics, Inc. |
| Sector: Health Care | |
| SubSector: Biotechnology | |
| MarketCap: 12587 Millions | |
| Recent Price: 6.80 Market Intelligence Score: 49 | |
| Day Percent Change: -1.59% Day Change: -0.11 | |
| Week Change: -8.23% Year-to-date Change: 20.6% | |
| CCCC Links: Profile News Message Board | |
| Charts:- Daily , Weekly | |
| Add CCCC to Watchlist: View: Get Complete CCCC Trend Analysis ➞ | |
 | AVIR Atea Pharmaceuticals, Inc. |
| Sector: Health Care | |
| SubSector: Biotechnology | |
| MarketCap: 22587 Millions | |
| Recent Price: 3.67 Market Intelligence Score: 40 | |
| Day Percent Change: -0.68% Day Change: -0.03 | |
| Week Change: -2.26% Year-to-date Change: 20.5% | |
| AVIR Links: Profile News Message Board | |
| Charts:- Daily , Weekly | |
| Add AVIR to Watchlist: View: Get Complete AVIR Trend Analysis ➞ | |
 | VCEL Vericel Corporation |
| Sector: Health Care | |
| SubSector: Biotechnology | |
| MarketCap: 391.885 Millions | |
| Recent Price: 42.88 Market Intelligence Score: 36 | |
| Day Percent Change: -2.25% Day Change: -0.98 | |
| Week Change: -10.49% Year-to-date Change: 20.4% | |
| VCEL Links: Profile News Message Board | |
| Charts:- Daily , Weekly | |
| Add VCEL to Watchlist: View: Get Complete VCEL Trend Analysis ➞ | |
 | CRNX Crinetics Pharmaceuticals, Inc. |
| Sector: Health Care | |
| SubSector: Biotechnology | |
| MarketCap: 381.085 Millions | |
| Recent Price: 42.84 Market Intelligence Score: 31 | |
| Day Percent Change: -0.40% Day Change: -0.17 | |
| Week Change: -3.92% Year-to-date Change: 20.4% | |
| CRNX Links: Profile News Message Board | |
| Charts:- Daily , Weekly | |
| Add CRNX to Watchlist: View: Get Complete CRNX Trend Analysis ➞ | |
 | FDMT 4D Molecular Therapeutics, Inc. |
| Sector: Health Care | |
| SubSector: Biotechnology | |
| MarketCap: 772 Millions | |
| Recent Price: 24.79 Market Intelligence Score: 36 | |
| Day Percent Change: -1.04% Day Change: -0.26 | |
| Week Change: -10.51% Year-to-date Change: 19.8% | |
| FDMT Links: Profile News Message Board | |
| Charts:- Daily , Weekly | |
| Add FDMT to Watchlist: View: Get Complete FDMT Trend Analysis ➞ | |
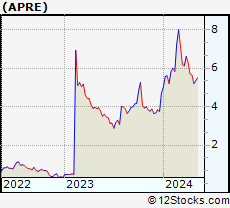 | APRE Aprea Therapeutics, Inc. |
| Sector: Health Care | |
| SubSector: Biotechnology | |
| MarketCap: 699.285 Millions | |
| Recent Price: 5.61 Market Intelligence Score: 36 | |
| Day Percent Change: 0.00% Day Change: 0.00 | |
| Week Change: -1.75% Year-to-date Change: 19.4% | |
| APRE Links: Profile News Message Board | |
| Charts:- Daily , Weekly | |
| Add APRE to Watchlist: View: Get Complete APRE Trend Analysis ➞ | |
| To view more stocks, click on Next / Previous arrows or select different range: 0 - 25 , 25 - 50 , 50 - 75 , 75 - 100 , 100 - 125 , 125 - 150 , 150 - 175 , 175 - 200 , 200 - 225 , 225 - 250 , 250 - 275 , 275 - 300 , 300 - 325 , 325 - 350 , 350 - 375 , 375 - 400 | ||
| Click To Change The Sort Order: By Market Cap or Company Size Performance: Year-to-date, Week and Day | |
| Select Chart Type: | ||
|
Best Stocks Today 12Stocks.com |
© 2024 12Stocks.com Terms & Conditions Privacy Contact Us
All Information Provided Only For Education And Not To Be Used For Investing or Trading. See Terms & Conditions


One More Thing ... Get Best Stocks Delivered Daily!
Never Ever Miss A Move With Our Top Ten Stocks Lists
Find Best Stocks In Any Market - Bull or Bear Market
Take A Peek At Our Top Ten Stocks Lists: Daily, Weekly, Year-to-Date & Top Trends
Find Best Stocks In Any Market - Bull or Bear Market
Take A Peek At Our Top Ten Stocks Lists: Daily, Weekly, Year-to-Date & Top Trends
Biotech Stocks With Best Up Trends [0-bearish to 100-bullish]: Humacyte [100], ALX Oncology[95], Vanda [93], Geron [93], Mesoblast [88], OPKO Health[88], United [88], Reneo [86], vTv [83], Agios [83], Shattuck Labs[83]
Best Biotech Stocks Year-to-Date:
Precision [2746.58%], Inovio [1788.24%], Assembly [1525.41%], Adverum nologies[1377.82%], NuCana [1181.27%], Affimed N.V[708%], Corbus [539.24%], Agenus [519.64%], Mesoblast [371.82%], Janux [336.95%], Addex [244.17%] Best Biotech Stocks This Week:
NuCana [1592.72%], Vanda [24.76%], Humacyte [23.78%], ALX Oncology[22.49%], Galera [17.05%], Rani [16.67%], ProKidney [16.57%], ADC [10.93%], Avadel [9.19%], Bicycle [9.13%], VBI Vaccines[8.55%] Best Biotech Stocks Daily:
Genelux [10.37%], Humacyte [9.86%], Adaptimmune [8.43%], Emergent Bio[6.99%], Pacific [6.51%], Annexon [5.86%], Corbus [5.69%], BioXcel [5.49%], ProQR [5.38%], Inventiva S.A[5.18%], Brainstorm Cell[5.00%]