
 Login Sign Up


| |||||
 |  | ||||

| 12Stocks.com Market Intelligence |
Stock Charts, Performance & Trend Analysis for PACK
Ranpak Holdings Corp.
|
| |||||||||||||||||||
 ➞
➞ ➞
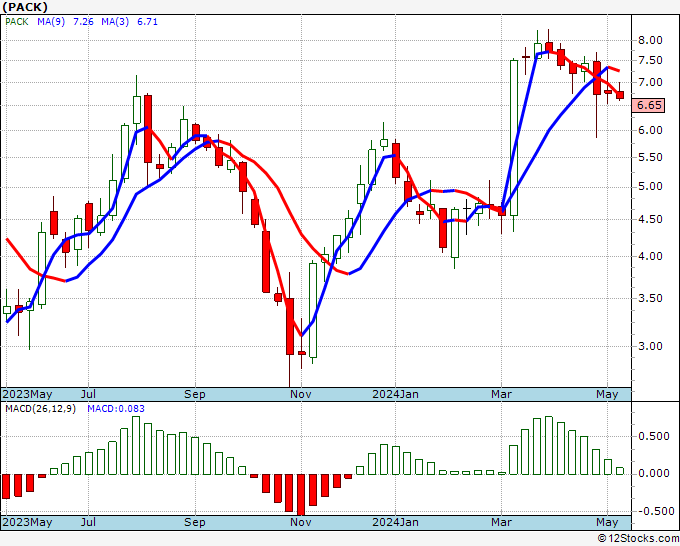
➞August 11, 2025 - The year-to-date (YTD) return or performance of Ranpak (PACK) is down -42.59% and is underperforming the overall stock market by -50.98%.
Recently, the weekly return of Ranpak (PACK) is up 13.83% and is outperforming the overall market by 11.45%.
All trends (long term, mid-term and short term) for Ranpak Holdings Corp. looks good.
The overall 12Stocks.com Smart Investing & Trading Score is 78 (measures stock trend from 0-bearish to 100-bullish) which puts PACK in short term neutral to bullish trend.
The Smart Investing & Trading Score from previous trading session is 100 and hence a significant deterioration of trend. Scroll down for key technical charts, support & resistance levels and analysis for Ranpak.
| Stock Analysis for PACK | |||||||
| Name: Ranpak Holdings Corp. | |||||||
| Sector: Industrials | |||||||
| SubSector: Conglomerates | |||||||
| In A Glance Ranpak (PACK) Stock Performance and Technical Trend Chart View | |||||||
| |||||||
Weekly PACK Technical Chart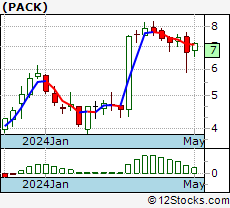 Daily PACK Technical Chart 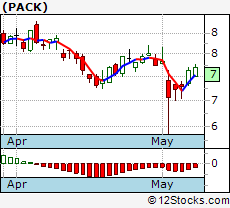 Add PACK To Watch List View List | |||||||
| 12Stocks.com Short Term Trend Analysis for PACK | |||||||
| 78 / 100 | |||||||
| The current technical trend score is 78 in a scale where 0 is bearish and 100 is bullish. | |||||||
| The technical trend score from previous session is 100. | |||||||
| Trend score updated daily. Not to be used for investing. | |||||||
Stocks Similar To Ranpak
|
|
|
|
Get the most comprehensive stock market coverage daily at 12Stocks.com ➞ Best Stocks Today ➞ Best Stocks Weekly ➞ Best Stocks Year-to-Date ➞ Best Stocks Trends ➞  Best Stocks Today 12Stocks.com Best Nasdaq Stocks ➞ Best S&P 500 Stocks ➞ Best Tech Stocks ➞ Best Biotech Stocks ➞ |
© 2025 12Stocks.com Terms & Conditions Privacy Contact Us
All Information Provided Only For Education And Not To Be Used For Investing or Trading. See Terms & Conditions


One More Thing ... Get Best Stocks Delivered Daily!
Never Ever Miss A Move With Our Top Ten Stocks Lists
Get Best Performing Stocks, Daily Market Trends & Insight
Take A Peek At Our Top Ten Stocks Lists: Daily, Weekly, Year-to-Date & Top Trends
Get Best Performing Stocks, Daily Market Trends & Insight
Take A Peek At Our Top Ten Stocks Lists: Daily, Weekly, Year-to-Date & Top Trends
Dow Stocks With Best Current Trends [0-bearish to 100-bullish]: Home Depot[73], Johnson & Johnson[73], Caterpillar [66], Amgen [66], Chevron [66], Merck [66], NIKE [61], Goldman Sachs[56], Exxon Mobil[54], S&P[54] Best S&P 500 Stocks Year-to-Date Update:
Newmont [86.43%], Seagate [75.74%], NRG Energy[69.8%], Tapestry [67.71%], Western Digital[66.33%], General Electric[65.19%], IDEXX [59.17%], Amphenol [58.77%], Jabil [55.97%], Dollar General[55.62%] Best Nasdaq 100 Stocks Weekly Update:
IDEXX [22.88%], Micron [13.36%], Apple [13.33%], QQQ[11.14%], Monster Beverage[9.61%], Tesla [8.93%], Cisco Systems[6.97%], Electronic Arts[6.72%], Alphabet [6.5%], Alphabet [6.39%] Today's Stock Market In A Nutshell:Emerging Markets [9.6%], US Small Cap [3.3%], US Mid Cap [2.3%], Oil [2%], US Large Cap [1.2%], Gold [1.2%], Euro [0.8%], Bonds [0.5%], US Dollar [-0.8%], China [-7%],