
 Login Sign Up


| |||||
 |  | ||||

| 12Stocks.com Market Intelligence |
Stock Charts, Performance & Trend Analysis for GTLS
Chart Industries, Inc.
|
| |||||||||||||||||||
 ➞
➞ ➞
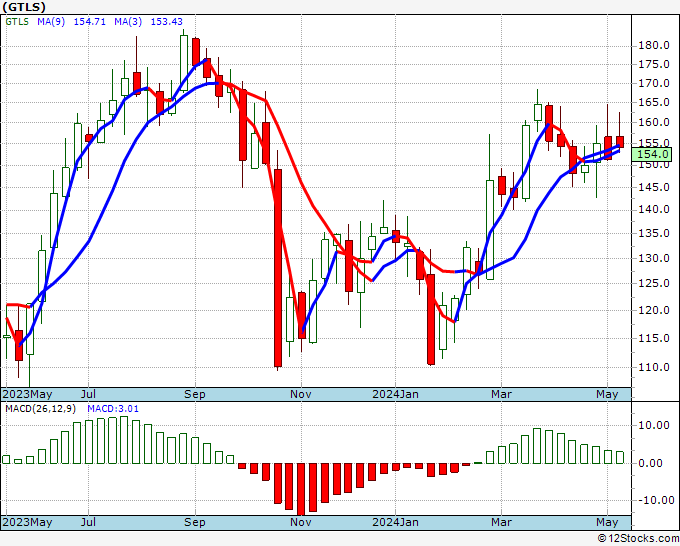
➞August 5, 2025 - The year-to-date (YTD) return or performance of Chart Industries (GTLS) is up 4.14% but is underperforming the overall stock market by -3.39%.
Recently, the weekly return of Chart Industries (GTLS) is up 0% but is underperforming the overall market by -1.57%.
Although long and mid term trends for Chart Industries, Inc. looks good, the short term trends are deteriorating.
The overall 12Stocks.com Smart Investing & Trading Score is 76 (measures stock trend from 0-bearish to 100-bullish) which puts GTLS in short term neutral to bullish trend.
The Smart Investing & Trading Score from previous trading session is 81 and hence a minor deterioration of trend. Scroll down for key technical charts, support & resistance levels and analysis for Chart Industries.
| Stock Analysis for GTLS | |||||||
| Name: Chart Industries, Inc. | |||||||
| Sector: Industrials | |||||||
| SubSector: Metal Fabrication | |||||||
| In A Glance Chart Industries (GTLS) Stock Performance and Technical Trend Chart View | |||||||
| |||||||
Weekly GTLS Technical Chart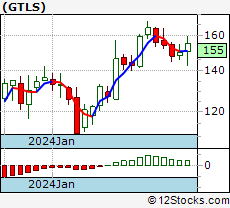 Daily GTLS Technical Chart 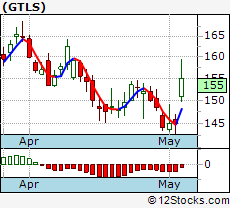 Add GTLS To Watch List View List | |||||||
| 12Stocks.com Short Term Trend Analysis for GTLS | |||||||
| 76 / 100 | |||||||
| The current technical trend score is 76 in a scale where 0 is bearish and 100 is bullish. | |||||||
| The technical trend score from previous session is 81. | |||||||
| Trend score updated daily. Not to be used for investing. | |||||||
Stocks Similar To Chart Industries
|
|
|
|
Get the most comprehensive stock market coverage daily at 12Stocks.com ➞ Best Stocks Today ➞ Best Stocks Weekly ➞ Best Stocks Year-to-Date ➞ Best Stocks Trends ➞  Best Stocks Today 12Stocks.com Best Nasdaq Stocks ➞ Best S&P 500 Stocks ➞ Best Tech Stocks ➞ Best Biotech Stocks ➞ |
© 2025 12Stocks.com Terms & Conditions Privacy Contact Us
All Information Provided Only For Education And Not To Be Used For Investing or Trading. See Terms & Conditions


One More Thing ... Get Best Stocks Delivered Daily!
Never Ever Miss A Move With Our Top Ten Stocks Lists
Get Best Performing Stocks, Daily Market Trends & Insight
Take A Peek At Our Top Ten Stocks Lists: Daily, Weekly, Year-to-Date & Top Trends
Get Best Performing Stocks, Daily Market Trends & Insight
Take A Peek At Our Top Ten Stocks Lists: Daily, Weekly, Year-to-Date & Top Trends
Dow Stocks With Best Current Trends [0-bearish to 100-bullish]: Johnson & Johnson[100], Home Depot[100], Microsoft [95], Walmart [90], Goldman Sachs[83], Amgen [81], Caterpillar [78], S&P[68], NIKE [65], Cisco Systems[63] Best S&P 500 Stocks Year-to-Date Update:
NRG Energy[93.59%], Seagate [80.83%], Newmont [76.81%], Tapestry [72.01%], Western Digital[71.48%], General Electric[65.92%], IDEXX [65.15%], Constellation Energy[58.94%], Amphenol [56.82%], Jabil [54.55%] Best Nasdaq 100 Stocks Weekly Update:
IDEXX [27.49%], QQQ[5.48%], Trade Desk[4.28%], Constellation Energy[4.14%], Illumina [3.99%], DoorDash [3.89%], Ross Stores[3.62%], NVIDIA [3.62%], Meta Platforms[3.51%], Starbucks [3.36%] Today's Stock Market In A Nutshell:US Small Cap [2.2%], China [1.7%], US Large Cap [1.5%], US Mid Cap [1.3%], Emerging Markets [1%], Gold [0.6%], Bonds [0.1%], Euro [0%], US Dollar [-0%], Oil [-1.7%],