
 Login Sign Up


| |||||
 |  | ||||

| 12Stocks.com Market Intelligence |
Stock Charts, Performance & Trend Analysis for TSN
Tyson Foods, Inc
|
| |||||||||||||||||||
 ➞
➞ ➞
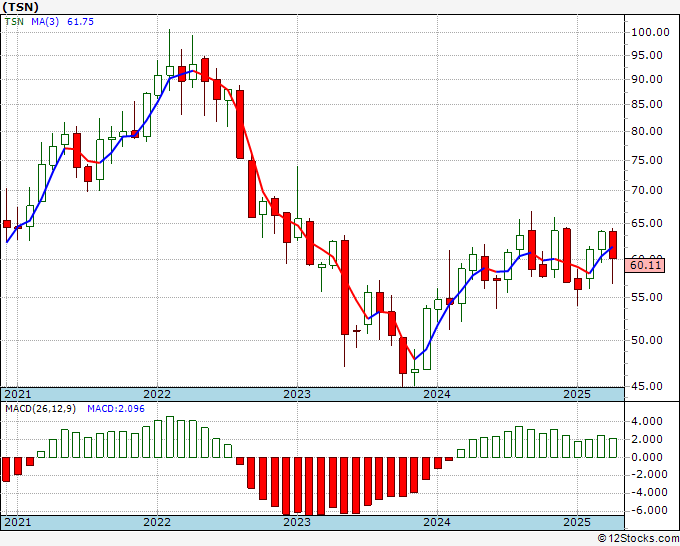
➞September 19, 2025 - The year-to-date (YTD) return or performance of Tyson Foods (TSN) is down -5.50985% and is underperforming the overall stock market by -19.36995%.
Recently, the weekly return of Tyson Foods (TSN) is down -2.54421% and is underperforming the overall market by -4.22538%.
Although long and mid term trends for Tyson Foods, Inc are not good, the short term trends are improving.
The overall 12Stocks.com Smart Investing & Trading Score is 20 (measures stock trend from 0-bearish to 100-bullish) which puts TSN in short term bearish trend.
The Smart Investing & Trading Score from previous trading session is 0 and an improvement of trend continues. Scroll down for key technical charts, support & resistance levels and analysis for Tyson Foods.
| Stock Analysis for TSN | |||||||
| Name: Tyson Foods, Inc | |||||||
| Sector: Consumer Staples | |||||||
| SubSector: Farm Products | |||||||
| In A Glance Tyson Foods (TSN) Stock Performance and Technical Trend Chart View | |||||||
| |||||||
Weekly TSN Technical Chart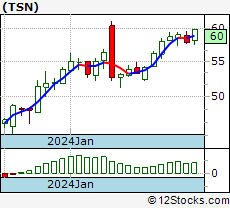 Daily TSN Technical Chart 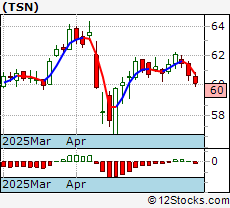 Add TSN To Watch List View List | |||||||
| 12Stocks.com Short Term Trend Analysis for TSN | |||||||
| 20 / 100 | |||||||
| The current technical trend score is 20 in a scale where 0 is bearish and 100 is bullish. | |||||||
| The technical trend score from previous session is 20. | |||||||
| Trend score updated daily. Not to be used for investing. | |||||||
Stocks Similar To Tyson Foods
|
|
|
|
Get the most comprehensive stock market coverage daily at 12Stocks.com ➞ Best Stocks Today ➞ Best Stocks Weekly ➞ Best Stocks Year-to-Date ➞ Best Stocks Trends ➞  Best Stocks Today 12Stocks.com Best Nasdaq Stocks ➞ Best S&P 500 Stocks ➞ Best Tech Stocks ➞ Best Biotech Stocks ➞ |
© 2025 12Stocks.com Terms & Conditions Privacy Contact Us
All Information Provided Only For Education And Not To Be Used For Investing or Trading. See Terms & Conditions


One More Thing ... Get Best Stocks Delivered Daily!
Never Ever Miss A Move With Our Top Ten Stocks Lists
Get Best Performing Stocks, Daily Market Trends & Insight
Take A Peek At Our Top Ten Stocks Lists: Daily, Weekly, Year-to-Date & Top Trends
Get Best Performing Stocks, Daily Market Trends & Insight
Take A Peek At Our Top Ten Stocks Lists: Daily, Weekly, Year-to-Date & Top Trends
Dow Stocks With Best Current Trends [0-bearish to 100-bullish]: Intel Corp[100], Caterpillar Inc[100], American Express[100], Goldman Sachs[100], Chase[100], Travelers [90], [90], S&P[90], IBM Corp[80], Merck & Co Inc[70] Best S&P 500 Stocks Year-to-Date Update:
Seagate [154.166%], Western Digital[125.267%], Newmont Corp[106.308%], Micron [93.8396%], Oracle Corp[80.1431%], NRG Energy[78.9757%], Amphenol Corp[77.6595%], Warner Bros.[77.39%], GE Aerospace[76.8067%], Lam Research[75.3402%] Best Nasdaq 100 Stocks Weekly Update:
Splunk [38.7643%], Synopsys Inc[23.8099%], Intel Corp[23.4154%], Micron [20.6436%], Tesla Inc[19.7217%], Crowdstrike [18.6245%], Lam Research[17.6602%], ASML Holding[16.9781%], Applied Materials[16.118%], KLA Corp[12.2299%] Today's Stock Market In A Nutshell:US Small Cap [2.5%], US Mid Cap [1.2%], Europe [0.5%], US Dollar [0.5%], US Large Cap [0.5%], India [0.1%], Emerging Markets [-0.2%], Bonds [-0.3%], Euro [-0.4%], Oil [-0.4%], Gold [-0.4%], China [-1.3%],