
 Login Sign Up


| |||||
 |  | ||||

| 12Stocks.com Market Intelligence |
Stock Charts, Performance & Trend Analysis for OUSA
OShares FTSE US Quality Dividend ETF
|
| |||||||||||||||||||
 ➞
➞ ➞
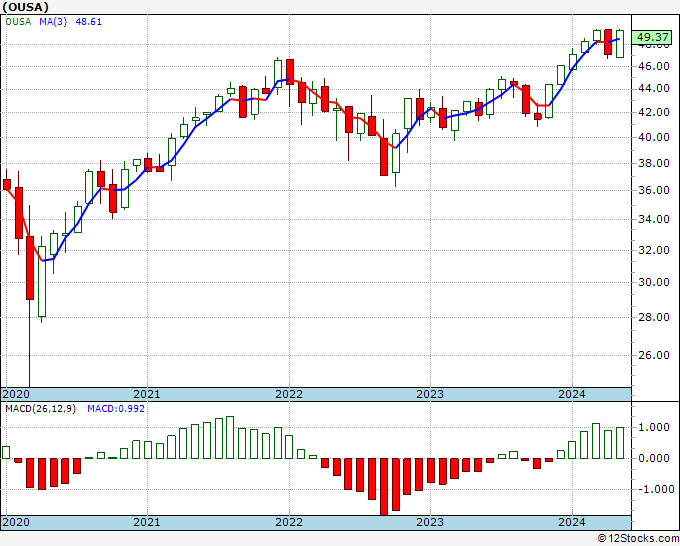
➞May 4, 2024 - The year-to-date (YTD) return or performance of O (OUSA) is up 2.99% but is underperforming the overall stock market by -3.89%.
Recently, the weekly return of O (OUSA) is up 0.11% but is underperforming the overall market by -0.59%.
Although long term trends for OShares FTSE US Quality Dividend ETF are not good, the short and mid term trends are improving.
The overall 12Stocks.com Smart Investing & Trading Score is 40 (measures stock trend from 0-bearish to 100-bullish) which puts OUSA in short term bearish to neutral trend.
The Smart Investing & Trading Score from previous trading session is 18 and hence a significant improvement of trend. Scroll down for key technical charts, support & resistance levels and analysis for O.
| Stock Analysis for OUSA | |||||||
| Name: OShares FTSE US Quality Dividend ETF | |||||||
| Sector: ETF | |||||||
| SubSector: Exchange Traded Fund | |||||||
| In A Glance O (OUSA) Stock Performance and Technical Trend Chart View | |||||||
| |||||||
Weekly OUSA Technical Chart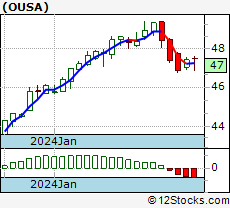 Daily OUSA Technical Chart 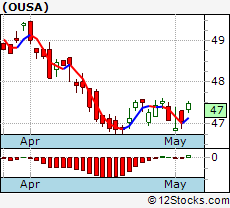 Add OUSA To Watch List View List | |||||||
| 12Stocks.com Short Term Trend Analysis for OUSA | |||||||
| 40 / 100 | |||||||
| The current technical trend score is 40 in a scale where 0 is bearish and 100 is bullish. | |||||||
| The technical trend score from previous session is 18. | |||||||
| Trend score updated daily. Not to be used for investing. | |||||||
Stocks Similar To O
|
|
|
|
Get the most comprehensive stock market coverage daily at 12Stocks.com ➞ Best Stocks Today ➞ Best Stocks Weekly ➞ Best Stocks Year-to-Date ➞ Best Stocks Trends ➞  Best Stocks Today 12Stocks.com Best Nasdaq Stocks ➞ Best S&P 500 Stocks ➞ Best Tech Stocks ➞ Best Biotech Stocks ➞ |
© 2024 12Stocks.com Terms & Conditions Privacy Contact Us
All Information Provided Only For Education And Not To Be Used For Investing or Trading. See Terms & Conditions


One More Thing ... Get Best Stocks Delivered Daily!
Never Ever Miss A Move With Our Top Ten Stocks Lists
Get Best Performing Stocks, Daily Market Trends & Insight
Take A Peek At Our Top Ten Stocks Lists: Daily, Weekly, Year-to-Date & Top Trends
Get Best Performing Stocks, Daily Market Trends & Insight
Take A Peek At Our Top Ten Stocks Lists: Daily, Weekly, Year-to-Date & Top Trends
Dow Stocks With Best Current Trends [0-bearish to 100-bullish]: Amgen [100], Goldman Sachs[100], Procter & Gamble[88], Amazon.com [88], 3M [76], Coca-Cola [76], Walt Disney[71], Walmart [71], UnitedHealth [70], Johnson & Johnson[67] Best S&P 500 Stocks Year-to-Date Update:
NVIDIA [79.29%], Constellation Energy[66.35%], NRG Energy[48.26%], Chipotle Mexican[37.97%], Western Digital[35.48%], Micron [34.4%], Eaton [33.09%], Progressive [31.04%], Leidos [30.89%], Diamondback Energy[29.93%] Best Nasdaq 100 Stocks Weekly Update:
MercadoLibre [15.97%], Moderna [15.77%], Amgen [15.3%], QUALCOMM [8.44%], Pinduoduo [8.41%], Regeneron [8.36%], Apple [8.32%], Tesla [7.67%], Verisk Analytics[7.32%], NXP Semiconductors[6.24%] Today's Stock Market In A Nutshell:US Large Cap [1.2%], US Mid Cap [1%], US Small Cap [1%], Emerging Markets [0.9%], Europe [0.9%], China [0.7%], Bonds [0.5%], Euro [0.4%], Gold [-0.1%], US Dollar [-0.3%], Oil [-1.1%],