
 Login Sign Up


| |||||
 |  | ||||

| 12Stocks.com Market Intelligence |
Stock Charts, Performance & Trend Analysis for DBC
DB Commodity Tracking
|
| |||||||||||||||||||
 ➞
➞ ➞
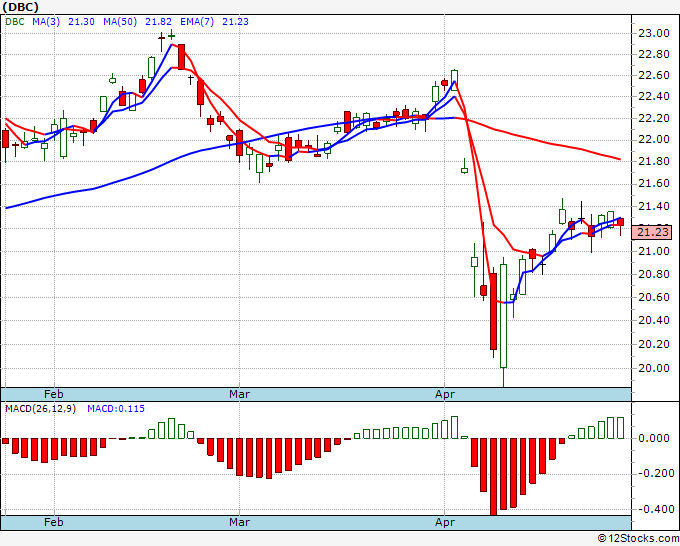
➞August 29, 2025 - The year-to-date (YTD) performance of Commodity Tracking (DBC) ETF is up 0.5% but is underperforming the overall stock market by -6.76%.
Recently, the weekly returns of Commodity Tracking (DBC) is up 1.42% and is outperforming the overall market by 1.41%.
All trends (long term, mid-term and short term) for DB Commodity Tracking looks good.
The overall 12Stocks.com Smart Investing & Trading Score is 90 (measures stock trend from 0-bearish to 100-bullish) which puts DBC in short term bullish trend.
The Smart Investing & Trading Score from previous trading session is 80 and hence an improvement of trend. Scroll down for key technical charts, support & resistance levels and analysis for Commodity Tracking.
| Stock Analysis for DBC | |||||||||||||||||
| Name: DB Commodity Tracking | |||||||||||||||||
| Sector: | |||||||||||||||||
| SubSector: | |||||||||||||||||
| In A Glance DBC Technical Trend Chart View | |||||||||||||||||
 Daily DBC Technical Chart Add DBC To Watch List View List | |||||||||||||||||
| 12Stocks.com Short Term Trend Analysis for | |||||||||||||||||
| 90 / 100 | |||||||||||||||||
| The current technical trend score is 90 in a scale where 0 is bearish and 100 is bullish. | |||||||||||||||||
| The technical trend score from previous session is 80. | |||||||||||||||||
| Trend score updated daily. Not to be used for investing. | |||||||||||||||||
| Recent Price: 22.04 | |||||||||||||||||
| MarketCap: Millions | |||||||||||||||||
| Day Percent Change: 0.41% | |||||||||||||||||
| Day Change: 0.09 | |||||||||||||||||
| Week Change: 1.42% | |||||||||||||||||
| Year-to-date Change: 0.5% | |||||||||||||||||
Technical Levels: For the trading inclined, the following are the key levels of resistance (ceiling) and support (floor) for DBC. Ceiling and floor levels are stock prices at which the stock trend gets resistance or support respectively and traders have an eye on them. Long term levels are more important. Stocks that have broken thru their resistance or supports convincingly tend to have stronger trends (confirm with charts above visually).
| |||||||||||||||||
|
Get the most comprehensive stock market coverage daily at 12Stocks.com ➞ Best Stocks Today ➞ Best Stocks Weekly ➞ Best Stocks Year-to-Date ➞ Best Stocks Trends ➞  Best Stocks Today 12Stocks.com Best Nasdaq Stocks ➞ Best S&P 500 Stocks ➞ Best Tech Stocks ➞ Best Biotech Stocks ➞ |
© 2025 12Stocks.com Terms & Conditions Privacy Contact Us
All Information Provided Only For Education And Not To Be Used For Investing or Trading. See Terms & Conditions


One More Thing ... Get Best Stocks Delivered Daily!
Never Ever Miss A Move With Our Top Ten Stocks Lists
Get Best Performing Stocks, Daily Market Trends & Insight
Take A Peek At Our Top Ten Stocks Lists: Daily, Weekly, Year-to-Date & Top Trends
Get Best Performing Stocks, Daily Market Trends & Insight
Take A Peek At Our Top Ten Stocks Lists: Daily, Weekly, Year-to-Date & Top Trends
Dow Stocks With Best Current Trends [0-bearish to 100-bullish]: [100], American Express[100], Chevron [100], Chase[100], Exxon Mobil[90], McDonald s[90], Johnson & Johnson[80], Verizon [80], Walt Disney[80], Boeing [80] Best S&P 500 Stocks Year-to-Date Update:
Newmont [76.03%], Seagate [75.98%], Western Digital[63.34%], Amphenol [54.43%], IDEXX [53.12%], Dollar General[52.95%], Dollar Tree[48.93%], Wynn Resorts[46.72%], NVIDIA [45.09%], NRG Energy[43.45%] Best Nasdaq 100 Stocks Weekly Update:
Autodesk [8.43%], Pinduoduo [7.16%], Diamondback Energy[4%], Datadog [3.72%], MongoDB [3.71%], Alphabet [3.31%], Alphabet [3.29%], Trade Desk[3.03%], Palo Alto[2.71%], Cisco Systems[2.63%] Today's Stock Market In A Nutshell:Euro [1.1%], Gold [1%], China [0.9%], Bonds [0.5%], US Small Cap [-0.4%], Emerging Markets [-0.5%], US Mid Cap [-0.5%], Oil [-0.5%], US Large Cap [-0.6%], Europe [-0.7%], US Dollar [-0.9%],