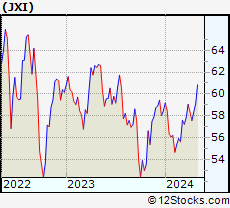
September 15, 2025 - The year-to-date (YTD) performance of Global Utilities (JXI) ETF is up 19.2426% and is outperforming the overall stock market by 6.3916%.
Recently, the weekly returns of Global Utilities (JXI) is up 2.32372% and is outperforming the overall market by 1.02116%. |
|
Although long term and short term trends for iShares Global Utilities are good, the mid term i.e weekly trends are deteriorating.
The overall 12Stocks.com Smart Investing & Trading Score is 60 (measures stock trend from 0-bearish to 100-bullish) which puts JXI in short term neutral to bullish trend.
The Smart Investing & Trading Score from previous trading session is 30 and an improvement of trend continues. Scroll down for key technical charts, support & resistance levels and analysis for Global.
|
| Stock Analysis for JXI | | Name: iShares Global Utilities | | Sector: | | SubSector: | In A Glance
JXI Technical Trend Chart View | |
| |
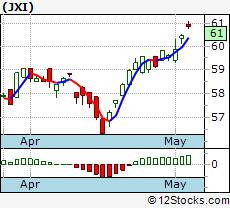
Daily JXI Technical Chart
Add JXI To Watch List View List | 12Stocks.com
Short Term Trend Analysis for | | 60 / 100 | | The current technical trend score is 60 in a scale where 0 is bearish and 100 is bullish. | | The technical trend score from previous session is 60. | | Trend score updated daily. Not to be used for investing. | | Recent Price: 75.88 | | MarketCap: Millions | | Day Percent Change: 0.544994% | | Day Change: 0.4 | | Week Change: 2.32372% | | Year-to-date Change: 19.2426% |
Technical Levels: For the trading inclined, the following are the key levels of resistance (ceiling) and support (floor) for JXI. Ceiling and floor levels are stock prices at which the stock trend gets resistance or support respectively and traders have an eye on them. Long term levels are more important. Stocks that have broken thru their resistance or supports convincingly tend to have stronger trends (confirm with charts above visually).| Key Levels for JXI | |
| | Short Term | Weekly | Long Term | | Resistance (Ceiling) | 76.72 | 76.43 | 76.12 | | Support (Floor) | 76.5 | 75.58 | 72.45 |
|
The table below shows stocks similar to iShares Global Utilities, i.e, from same subsector or sector along with year-to-date (YTD), weekly & daily performaces for comparison. Usually, stocks from similar sector tend to move together but companies that have innovative products, services or good management tend to outperform. Quick View: Move mouse or cursor over stock symbol (ticker) to view short-term technical chart and over stock name to view long term chart. Click on ticker or stock name for detailed view. Click on  to add stock symbol to your watchlist and to add stock symbol to your watchlist and  to view watchlist. to view watchlist. | | Ticker | Stock Name | Watchlist | Category | Recent Price | Change % | Weekly Change% | YTD Change% | You have an error in your SQL syntax; check the manual that corresponds to your MySQL server version for the right syntax to use near 'AND etfequities.ETFID=etf.ETFID AND equities.EQUITYID=etfequities.EQUITYID and ' at line 1
|

 Login Sign Up