
 Login Sign Up


| |||||
 |  | ||||

| 12Stocks.com Market Intelligence |
Best India Stocks
|
|
| Quick Read: Top India Stocks By Performances & Trends: Daily, Weekly, Year-to-Date, Market Cap (Size) & Technical Trends | |||
| Best India Views: Quick Browse View, Summary & Slide Show | |||
| 12Stocks.com India Stocks Performances & Trends Daily | |||||||||
|
|  The overall market intelligence score is 60 (0-bearish to 100-bullish) which puts India index in short term neutral to bullish trend. The market intelligence score from previous trading session is 90 and hence a deterioration of trend.
| ||||||||
Here are the market intelligence trend scores of the most requested India stocks at 12Stocks.com (click stock name for detailed review):
| ||||||||||||||
| Scroll down this page for most comprehensive review of India stocks by performance, trends, technical analysis, charts, fund plays & more | ||||||||||||||


| 12Stocks.com: Top Performing India Index Stocks | ||||||||||||||||||||||||||||||||||||||||||||||||
 The top performing India Index stocks year to date are
Now, more recently, over last week, the top performing India Index stocks on the move are


|
||||||||||||||||||||||||||||||||||||||||||||||||
| 12Stocks.com: Investing in India Index with Stocks | |
|
The following table helps investors and traders sort through current performance and trends (as measured by market intelligence score) of various
stocks in the India Index. Quick View: Move mouse or cursor over stock symbol (ticker) to view short-term technical chart and over stock name to view long term chart. Click on  to add stock symbol to your watchlist and to add stock symbol to your watchlist and  to view watchlist. Click on any ticker or stock name for detailed market intelligence report for that stock. to view watchlist. Click on any ticker or stock name for detailed market intelligence report for that stock. |
12Stocks.com Performance of Stocks in India Index
| Ticker | Stock Name | Watchlist | Category | Recent Price | Market Intelligence Score | Change % | YTD Change% |
| HDB | HDFC Bank |   | Financials | 35.97 | 50 | 2.30% | -43.23% |
| IBN | ICICI Bank | | Financials | 32.60 | 70 | 1.12% | 10.22% |
| INFY | Infosys | | Technology | 17.53 | 90 | -0.85% | -21.40% |
| WIT | Wi. ADR | | Technology | 2.88 | 90 | 3.60% | -17.18% |
| RDY | Dr. Reddys | | Health Care | 14.86 | 90 | 0.88% | -4.70% |
| MMYT | MakeMyTrip | | Services & Goods | 97.00 | 10 | 0.63% | -16.54% |
| VEDL | Vedanta | | Materials | 27.08 | 70 | -0.44% | 0.00% |
| TTM | Tata Motors | | Consumer Staples | 25.14 | 20 | 0.00% | 0.00% |
| WNS | WNS () | | Technology | 76.20 | 90 | 0.69% | 61.10% |
| RNW | ReNew Energy | | Utilities | 7.73 | 60 | 0.52% | 13.68% |
| VDTH | Videocon d2h | | Services & Goods | 11.08 | 30 | 0.00% | 0.00% |
| SIFY | Sify | | Technology | 12.45 | 90 | 3.41% | 306.86% |
| AZRE | Azure Power | | Utilities | 0.45 | 30 | -18.18% | 0.00% |
| YTRA | Yatra Online | | Services & Goods | 1.54 | 80 | 0.00% | 21.26% |
| PTI | Proteostasis | | Health Care | 18.73 | 30 | 0.48% | 0.00% |
| To view more stocks, click on Next / Previous arrows or select different range: 0 - 25 | ||
 | Click To Change The Sort Order: By Market Cap or Company Size Performance: Year-to-date, Week and Day |  |
| Detailed Overview Of India Stocks |
| India Technical Overview, Leaders & Laggards, Top India ETF Funds & Detailed India Stocks List, Charts, Trends & More |
| India: Technical Analysis, Trends & YTD Performance | |
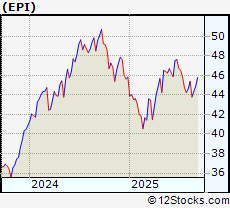
 EPI Weekly Chart |
|
| Long Term Trend: Deteriorating | |
| Medium Term Trend: Good | |
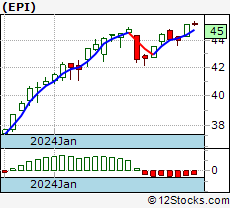
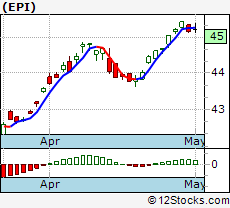 EPI Daily Chart |
|
| Short Term Trend: Good | |
| Overall Trend Score: 60 | |
| YTD Performance: -0.764025% | |
| **Trend Scores & Views Are Only For Educational Purposes And Not For Investing | |
| 12Stocks.com: Investing in India Index using Exchange Traded Funds | |
|
The following table shows list of key exchange traded funds (ETF) that
help investors play India stock market. For detailed view, check out our ETF Funds section of our website. Quick View: Move mouse or cursor over ETF symbol (ticker) to view short-term technical chart and over ETF name to view long term chart. Click on ticker or stock name for detailed view. Click on to add stock symbol to your watchlist and to view watchlist. |
12Stocks.com List of ETFs that track India Index
| Ticker | ETF Name | Watchlist | Recent Price | Market Intelligence Score | Change % | Week % | Year-to-date % |
| SCIF | India Small-Cap | | 108.94 | 80 | -1.11646 | 435.858 | 0% |
| INXX | India Infrastructure | | 25.12 | 80 | -0.475436 | 23.5612 | 0% |
| EEB | BRIC | | 52.85 | 70 | 0.132626 | 7.6594 | 0% |
| FNI | Chindia | | 43.54 | 30 | 0 | 0 | 0% |
| BBRC | Beyond BRICs | | 59.10 | 80 | -0.722325 | 190.703 | 0% |
| 12Stocks.com: Charts, Trends, Fundamental Data and Performances of India Stocks | |
|
We now take in-depth look at all India stocks including charts, multi-period performances and overall trends (as measured by market intelligence score). One can sort India stocks (click link to choose) by Daily, Weekly and by Year-to-Date performances. Also, one can sort by size of the company or by market capitalization. |
| Select Your Default Chart Type: | |||||
| |||||
| Click on stock symbol or name for detailed view. Click on to add stock symbol to your watchlist and to view watchlist. Quick View: Move mouse or cursor over "Daily" to quickly view daily technical stock chart and over "Weekly" to view weekly technical stock chart. | |||||
 | HDB HDFC Bank Ltd. ADR |
| Sector: Financials | |
| SubSector: Banks - Regional | |
| MarketCap: 361333 Millions | |
| Recent Price: 35.97 Market Intelligence Score: 50 | |
| Day Percent Change: 2.30375% Day Change: 0.43 | |
| Week Change: 2.77143% Year-to-date Change: -43.2% | |
| HDB Links: Profile News Message Board | |
| Charts:- Daily , Weekly | |
| Add HDB to Watchlist: View: Get Complete HDB Trend Analysis ➞ | |
 | IBN ICICI Bank Ltd. ADR |
| Sector: Financials | |
| SubSector: Banks - Regional | |
| MarketCap: 113060 Millions | |
| Recent Price: 32.60 Market Intelligence Score: 70 | |
| Day Percent Change: 1.11663% Day Change: 0.14 | |
| Week Change: 2.51572% Year-to-date Change: 10.2% | |
| IBN Links: Profile News Message Board | |
| Charts:- Daily , Weekly | |
| Add IBN to Watchlist: View: Get Complete IBN Trend Analysis ➞ | |
 | INFY Infosys Ltd ADR |
| Sector: Technology | |
| SubSector: Information Technology Services | |
| MarketCap: 68048.6 Millions | |
| Recent Price: 17.53 Market Intelligence Score: 90 | |
| Day Percent Change: -0.848416% Day Change: -0.15 | |
| Week Change: 3.2391% Year-to-date Change: -21.4% | |
| INFY Links: Profile News Message Board | |
| Charts:- Daily , Weekly | |
| Add INFY to Watchlist: View: Get Complete INFY Trend Analysis ➞ | |
 | WIT Wipro Ltd. ADR |
| Sector: Technology | |
| SubSector: Information Technology Services | |
| MarketCap: 28586.7 Millions | |
| Recent Price: 2.88 Market Intelligence Score: 90 | |
| Day Percent Change: 3.59712% Day Change: 0.01 | |
| Week Change: 3.97112% Year-to-date Change: -17.2% | |
| WIT Links: Profile News Message Board | |
| Charts:- Daily , Weekly | |
| Add WIT to Watchlist: View: Get Complete WIT Trend Analysis ➞ | |
 | RDY Dr. Reddy's Laboratories Ltd. ADR |
| Sector: Health Care | |
| SubSector: Drug Manufacturers - Specialty & Generic | |
| MarketCap: 11935.6 Millions | |
| Recent Price: 14.86 Market Intelligence Score: 90 | |
| Day Percent Change: 0.882553% Day Change: 0.29 | |
| Week Change: 1.92044% Year-to-date Change: -4.7% | |
| RDY Links: Profile News Message Board | |
| Charts:- Daily , Weekly | |
| Add RDY to Watchlist: View: Get Complete RDY Trend Analysis ➞ | |
 | MMYT MakeMyTrip Ltd |
| Sector: Services & Goods | |
| SubSector: Travel Services | |
| MarketCap: 9557.55 Millions | |
| Recent Price: 97.00 Market Intelligence Score: 10 | |
| Day Percent Change: 0.632846% Day Change: -1.42 | |
| Week Change: -0.909184% Year-to-date Change: -16.5% | |
| MMYT Links: Profile News Message Board | |
| Charts:- Daily , Weekly | |
| Add MMYT to Watchlist: View: Get Complete MMYT Trend Analysis ➞ | |
 | VEDL Vedanta Limited |
| Sector: Materials | |
| SubSector: Industrial Metals & Minerals | |
| MarketCap: 4079.5 Millions | |
| Recent Price: 27.08 Market Intelligence Score: 70 | |
| Day Percent Change: -0.441176% Day Change: -9999 | |
| Week Change: 61.9617% Year-to-date Change: 0.0% | |
| VEDL Links: Profile News Message Board | |
| Charts:- Daily , Weekly | |
| Add VEDL to Watchlist: View: Get Complete VEDL Trend Analysis ➞ | |
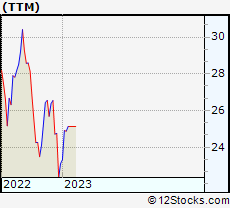 | TTM Tata Motors Limited |
| Sector: Consumer Staples | |
| SubSector: Auto Manufacturers - Major | |
| MarketCap: 3396.01 Millions | |
| Recent Price: 25.14 Market Intelligence Score: 20 | |
| Day Percent Change: 0% Day Change: -9999 | |
| Week Change: 0% Year-to-date Change: 0.0% | |
| TTM Links: Profile News Message Board | |
| Charts:- Daily , Weekly | |
| Add TTM to Watchlist: View: Get Complete TTM Trend Analysis ➞ | |
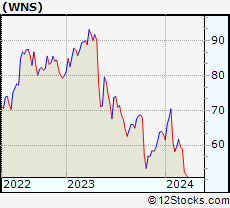 | WNS WNS (Holdings) Limited |
| Sector: Technology | |
| SubSector: Information Technology Services | |
| MarketCap: 3233.91 Millions | |
| Recent Price: 76.20 Market Intelligence Score: 90 | |
| Day Percent Change: 0.687104% Day Change: 0.21 | |
| Week Change: 0.994036% Year-to-date Change: 61.1% | |
| WNS Links: Profile News Message Board | |
| Charts:- Daily , Weekly | |
| Add WNS to Watchlist: View: Get Complete WNS Trend Analysis ➞ | |
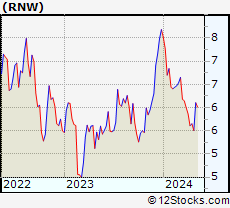 | RNW ReNew Energy Global plc |
| Sector: Utilities | |
| SubSector: Utilities - Renewable | |
| MarketCap: 2829.6 Millions | |
| Recent Price: 7.73 Market Intelligence Score: 60 | |
| Day Percent Change: 0.520156% Day Change: -0.04 | |
| Week Change: 1.04575% Year-to-date Change: 13.7% | |
| RNW Links: Profile News Message Board | |
| Charts:- Daily , Weekly | |
| Add RNW to Watchlist: View: Get Complete RNW Trend Analysis ➞ | |
 | VDTH Videocon d2h Limited |
| Sector: Services & Goods | |
| SubSector: CATV Systems | |
| MarketCap: 1099.81 Millions | |
| Recent Price: 11.08 Market Intelligence Score: 30 | |
| Day Percent Change: 0% Day Change: -9999 | |
| Week Change: 13.9918% Year-to-date Change: 0.0% | |
| VDTH Links: Profile News Message Board | |
| Charts:- Daily , Weekly | |
| Add VDTH to Watchlist: View: Get Complete VDTH Trend Analysis ➞ | |
 | SIFY Sify Technologies Limited ADR |
| Sector: Technology | |
| SubSector: Telecom Services | |
| MarketCap: 808.15 Millions | |
| Recent Price: 12.45 Market Intelligence Score: 90 | |
| Day Percent Change: 3.40532% Day Change: -0.04 | |
| Week Change: 8.35509% Year-to-date Change: 306.9% | |
| SIFY Links: Profile News Message Board | |
| Charts:- Daily , Weekly | |
| Add SIFY to Watchlist: View: Get Complete SIFY Trend Analysis ➞ | |
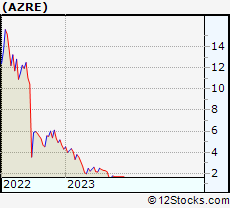 | AZRE Azure Power Global Limited |
| Sector: Utilities | |
| SubSector: Electric Utilities | |
| MarketCap: 700.414 Millions | |
| Recent Price: 0.45 Market Intelligence Score: 30 | |
| Day Percent Change: -18.1818% Day Change: -9999 | |
| Week Change: 0% Year-to-date Change: 0.0% | |
| AZRE Links: Profile News Message Board | |
| Charts:- Daily , Weekly | |
| Add AZRE to Watchlist: View: Get Complete AZRE Trend Analysis ➞ | |
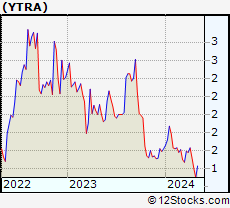 | YTRA Yatra Online Inc |
| Sector: Services & Goods | |
| SubSector: Travel Services | |
| MarketCap: 91.41 Millions | |
| Recent Price: 1.54 Market Intelligence Score: 80 | |
| Day Percent Change: 0% Day Change: -0.01 | |
| Week Change: 1.98676% Year-to-date Change: 21.3% | |
| YTRA Links: Profile News Message Board | |
| Charts:- Daily , Weekly | |
| Add YTRA to Watchlist: View: Get Complete YTRA Trend Analysis ➞ | |
 | PTI Proteostasis Therapeutics, Inc. |
| Sector: Health Care | |
| SubSector: Biotechnology | |
| MarketCap: 79.8785 Millions | |
| Recent Price: 18.73 Market Intelligence Score: 30 | |
| Day Percent Change: 0.482833% Day Change: -9999 | |
| Week Change: -60.7913% Year-to-date Change: 0.0% | |
| PTI Links: Profile News Message Board | |
| Charts:- Daily , Weekly | |
| Add PTI to Watchlist: View: Get Complete PTI Trend Analysis ➞ | |
| To view more stocks, click on Next / Previous arrows or select different range: 0 - 25 | ||
| Click To Change The Sort Order: By Market Cap or Company Size Performance: Year-to-date, Week and Day | |
| Select Chart Type: | ||
 Best Stocks Today 12Stocks.com |
© 2025 12Stocks.com Terms & Conditions Privacy Contact Us
All Information Provided Only For Education And Not To Be Used For Investing or Trading. See Terms & Conditions


One More Thing ... Get Best Stocks Delivered Daily!
Never Ever Miss A Move With Our Top Ten Stocks Lists
Find Best Stocks In Any Market - Bull or Bear Market
Take A Peek At Our Top Ten Stocks Lists: Daily, Weekly, Year-to-Date & Top Trends
Find Best Stocks In Any Market - Bull or Bear Market
Take A Peek At Our Top Ten Stocks Lists: Daily, Weekly, Year-to-Date & Top Trends
India Stocks With Best Up Trends [0-bearish to 100-bullish]: Wi. ADR[90], Sify [90], Dr. Reddys[90], WNS ()[90], Infosys [90], ICICI Bank[70], Vedanta [70], ReNew Energy[60], HDFC Bank[50], Videocon d2h[30], Azure Power[30]
Best India Stocks Year-to-Date:
Sify [306.863%], WNS ()[61.0994%], ReNew Energy[13.6765%], ICICI Bank[10.2241%], Vedanta [0%], Videocon d2h[0%], Tata Motors[0%], Azure Power[0%], Dr. Reddys[-4.69533%], MakeMyTrip [-16.5448%], Wi. ADR[-17.1771%] Best India Stocks This Week:
Vedanta [61.9617%], Videocon d2h[13.9918%], Sify [8.35509%], Wi. ADR[3.97112%], Infosys [3.2391%], HDFC Bank[2.77143%], ICICI Bank[2.51572%], Dr. Reddys[1.92044%], ReNew Energy[1.04575%], WNS ()[0.994036%], Tata Motors[0%] Best India Stocks Daily:
Wi. ADR[3.59712%], Sify [3.40532%], HDFC Bank[2.30375%], ICICI Bank[1.11663%], Dr. Reddys[0.882553%], WNS ()[0.687104%], MakeMyTrip [0.632846%], ReNew Energy[0.520156%], Videocon d2h[0%], Tata Motors[0%], Vedanta [-0.441176%]