
 Login Sign Up


| |||||
 |  | ||||

| 12Stocks.com Market Intelligence |
Best Healthcare Stocks
 | "Discover best trending healthcare stocks with 12Stocks.com." |
| - Subu Vdaygiri, Founder, 12Stocks.com |
| In a hurry? Healthcare Stocks Lists: Performance Trends Table, Stock Charts
Sort Healthcare stocks: Daily, Weekly, Year-to-Date, Market Cap & Trends. Filter Healthcare stocks list by size:All Healthcare Large Mid-Range Small |
| 12Stocks.com Healthcare Stocks Performances & Trends Daily | |||||||||
|
|  The overall Smart Investing & Trading Score is 40 (0-bearish to 100-bullish) which puts Healthcare sector in short term bearish to neutral trend. The Smart Investing & Trading Score from previous trading session is 60 and a deterioration of trend continues.
| ||||||||
Here are the Smart Investing & Trading Scores of the most requested Healthcare stocks at 12Stocks.com (click stock name for detailed review):
|


| 12Stocks.com: Investing in Healthcare sector with Stocks | |
|
The following table helps investors and traders sort through current performance and trends (as measured by Smart Investing & Trading Score) of various
stocks in the Healthcare sector. Quick View: Move mouse or cursor over stock symbol (ticker) to view short-term Technical chart and over stock name to view long term chart. Click on  to add stock symbol to your watchlist and to add stock symbol to your watchlist and  to view watchlist. Click on any ticker or stock name for detailed market intelligence report for that stock. to view watchlist. Click on any ticker or stock name for detailed market intelligence report for that stock. |
12Stocks.com Performance of Stocks in Healthcare Sector
| Ticker | Stock Name | Watchlist | Category | Recent Price | Smart Investing & Trading Score | Change % | YTD Change% |
| KIN | Kindred Biosciences |   | Biotechnology | 43.92 | 70 | -0.45% | 0.00% |
| NKTX | Nkarta | | Biotechnology | 1.97 | 30 | 0.00% | -21.20% |
| PBMD | Prima Biomed | | Biotechnology | 1.71 | 10 | 0.00% | 0.00% |
| RTIX | RTI Surgical | | Equipment | 22.38 | 0 | 1.45% | 0.00% |
| CHMA | Chiasma | | Biotechnology | 0.35 | 0 | 0.00% | 0.00% |
| SCLX | Scilex Holding | | Drug Manufacturers - General | 25.70 | 80 | -2.21% | 68.41% |
| ENZ | Enzo Biochem | | Laboratories | 0.54 | 20 | -0.02% | -25.02% |
| MSON | Misonix | | Equipment | 14.85 | 30 | 2.41% | 0.00% |
| BSGM | Biosig Technologies | | Medical Devices | 5.18 | 40 | 7.69% | 270.00% |
| ARLZ | Aralez | | Biotechnology | 30.62 | 60 | -0.26% | 0.00% |
| CABA | Cabaletta Bio | | Biotechnology | 1.91 | 100 | 3.80% | -18.03% |
| DCGO | DocGo | | Medical Care Facilities | 1.56 | 60 | 1.96% | -63.64% |
| MIST | Milestone | | Biotechnology | 1.97 | 100 | 0.51% | -9.22% |
| PRTK | Paratek | | Biotechnology | 58.01 | 90 | 3.83% | 0.00% |
| PIRS | Pieris | | Biotechnology | 12.03 | 0 | -27.16% | 0.00% |
| THTX | Theratechnologies | | Biotechnology | 3.29 | 80 | -0.30% | 78.80% |
| CHRS | Coherus Oncology | | Biotechnology | 1.27 | 40 | -1.55% | -9.29% |
| GLSI | Greenwich LifeSciences | | Biotechnology | 11.68 | 70 | 4.01% | -0.51% |
| AST | Asterias Bio | | Biotechnology | 14.23 | 40 | 0.49% | 0.00% |
| OBIO | Orchestra BioMed | | Biotechnology | 2.60 | 10 | 1.17% | -51.67% |
| INO | Inovio | | Biotechnology | 2.28 | 30 | -4.20% | 25.27% |
| LNSR | LENSAR | | Medical Devices | 12.34 | 60 | -1.04% | 42.00% |
| ACHV | Achieve Life | | Biotechnology | 3.04 | 60 | -1.30% | -17.62% |
| DMTK | DermTech | | Equipment | 0.04 | 50 | -12.05% | 0.00% |
| CUTR | Cutera | | Equipment | 0.10 | 20 | -10.19% | -75.15% |
| For chart view version of above stock list: Chart View ➞ 0 - 25 , 25 - 50 , 50 - 75 , 75 - 100 , 100 - 125 , 125 - 150 , 150 - 175 , 175 - 200 , 200 - 225 , 225 - 250 , 250 - 275 , 275 - 300 , 300 - 325 , 325 - 350 , 350 - 375 , 375 - 400 , 400 - 425 , 425 - 450 , 450 - 475 , 475 - 500 , 500 - 525 , 525 - 550 , 550 - 575 , 575 - 600 , 600 - 625 , 625 - 650 , 650 - 675 , 675 - 700 , 700 - 725 , 725 - 750 , 750 - 775 , 775 - 800 , 800 - 825 , 825 - 850 , 850 - 875 , 875 - 900 , 900 - 925 , 925 - 950 , 950 - 975 , 975 - 1000 | ||
 | Click To Change The Sort Order: By Market Cap or Company Size Performance: Year-to-date, Week and Day |  |
|
Get the most comprehensive stock market coverage daily at 12Stocks.com ➞ Best Stocks Today ➞ Best Stocks Weekly ➞ Best Stocks Year-to-Date ➞ Best Stocks Trends ➞  Best Stocks Today 12Stocks.com Best Nasdaq Stocks ➞ Best S&P 500 Stocks ➞ Best Tech Stocks ➞ Best Biotech Stocks ➞ |
| Detailed Overview of Healthcare Stocks |
| Healthcare Technical Overview, Leaders & Laggards, Top Healthcare ETF Funds & Detailed Healthcare Stocks List, Charts, Trends & More |
| Healthcare Sector: Technical Analysis, Trends & YTD Performance | |
| Healthcare sector is composed of stocks
from pharmaceutical, biotech, diagnostics labs, insurance providers
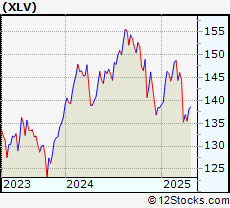
and healthcare services. Healthcare sector, as represented by XLV, an exchange-traded fund [ETF] that holds basket of Healthcare stocks (e.g, Merck, Amgen) is up by 0.265341% and is currently underperforming the overall market by -12.996259% year-to-date. Below is a quick view of Technical charts and trends: |
|
 XLV Weekly Chart |
|
| Long Term Trend: Very Good | |
| Medium Term Trend: Deteriorating | |
 XLV Daily Chart |
|
| Short Term Trend: Not Good | |
| Overall Trend Score: 40 | |
| YTD Performance: 0.265341% | |
| **Trend Scores & Views Are Only For Educational Purposes And Not For Investing | |
| 12Stocks.com: Top Performing Healthcare Sector Stocks | ||||||||||||||||||||||||||||||||||||||||||||||
 The top performing Healthcare sector stocks year to date are
Now, more recently, over last week, the top performing Healthcare sector stocks on the move are


|
||||||||||||||||||||||||||||||||||||||||||||||
| 12Stocks.com: Investing in Healthcare Sector using Exchange Traded Funds | |
|
The following table shows list of key exchange traded funds (ETF) that
help investors track Healthcare Index. For detailed view, check out our ETF Funds section of our website. Quick View: Move mouse or cursor over ETF symbol (ticker) to view short-term Technical chart and over ETF name to view long term chart. Click on ticker or stock name for detailed view. Click on to add stock symbol to your watchlist and to view watchlist. |
12Stocks.com List of ETFs that track Healthcare Index
| Ticker | ETF Name | Watchlist | Recent Price | Smart Investing & Trading Score | Change % | Week % | Year-to-date % |
| BTEC | Principal Healthcare Innovators | | 39.49 | 30 | 0 | 1.02328 | 0% |
| 12Stocks.com: Charts, Trends, Fundamental Data and Performances of Healthcare Stocks | |
|
We now take in-depth look at all Healthcare stocks including charts, multi-period performances and overall trends (as measured by Smart Investing & Trading Score). One can sort Healthcare stocks (click link to choose) by Daily, Weekly and by Year-to-Date performances. Also, one can sort by size of the company or by market capitalization. |
| Select Your Default Chart Type: | |||||
| |||||
| Click on stock symbol or name for detailed view. Click on to add stock symbol to your watchlist and to view watchlist. Quick View: Move mouse or cursor over "Daily" to quickly view daily Technical stock chart and over "Weekly" to view weekly Technical stock chart. | |||||

 | KIN Kindred Biosciences, Inc. |
| Sector: Health Care | |
| SubSector: Biotechnology | |
| MarketCap: 160.785 Millions | |
| Recent Price: 43.92 Smart Investing & Trading Score: 70 | |
| Day Percent Change: -0.453309% Day Change: -9999 | |
| Week Change: 374.811% Year-to-date Change: 0.0% | |
| KIN Links: Profile News Message Board | |
| Charts:- Daily , Weekly | |
| Add KIN to Watchlist: View: Get Complete KIN Trend Analysis ➞ | |
 | NKTX Nkarta Inc |
| Sector: Health Care | |
| SubSector: Biotechnology | |
| MarketCap: 160.52 Millions | |
| Recent Price: 1.97 Smart Investing & Trading Score: 30 | |
| Day Percent Change: 0% Day Change: 0.06 | |
| Week Change: -12.8319% Year-to-date Change: -21.2% | |
| NKTX Links: Profile News Message Board | |
| Charts:- Daily , Weekly | |
| Add NKTX to Watchlist: View: Get Complete NKTX Trend Analysis ➞ | |
 | PBMD Prima Biomed Ltd. |
| Sector: Health Care | |
| SubSector: Biotechnology | |
| MarketCap: 160.51 Millions | |
| Recent Price: 1.71 Smart Investing & Trading Score: 10 | |
| Day Percent Change: 0% Day Change: -9999 | |
| Week Change: 0% Year-to-date Change: 0.0% | |
| PBMD Links: Profile News Message Board | |
| Charts:- Daily , Weekly | |
| Add PBMD to Watchlist: View: Get Complete PBMD Trend Analysis ➞ | |
 | RTIX RTI Surgical Holdings, Inc. |
| Sector: Health Care | |
| SubSector: Medical Appliances & Equipment | |
| MarketCap: 159.18 Millions | |
| Recent Price: 22.38 Smart Investing & Trading Score: 0 | |
| Day Percent Change: 1.45059% Day Change: -9999 | |
| Week Change: -67.8633% Year-to-date Change: 0.0% | |
| RTIX Links: Profile News Message Board | |
| Charts:- Daily , Weekly | |
| Add RTIX to Watchlist: View: Get Complete RTIX Trend Analysis ➞ | |
 | CHMA Chiasma, Inc. |
| Sector: Health Care | |
| SubSector: Biotechnology | |
| MarketCap: 158.985 Millions | |
| Recent Price: 0.35 Smart Investing & Trading Score: 0 | |
| Day Percent Change: 0% Day Change: -9999 | |
| Week Change: -90.6915% Year-to-date Change: 0.0% | |
| CHMA Links: Profile News Message Board | |
| Charts:- Daily , Weekly | |
| Add CHMA to Watchlist: View: Get Complete CHMA Trend Analysis ➞ | |
 | SCLX Scilex Holding Company |
| Sector: Health Care | |
| SubSector: Drug Manufacturers - General | |
| MarketCap: 158.59 Millions | |
| Recent Price: 25.70 Smart Investing & Trading Score: 80 | |
| Day Percent Change: -2.207% Day Change: -0.43 | |
| Week Change: 12.7193% Year-to-date Change: 68.4% | |
| SCLX Links: Profile News Message Board | |
| Charts:- Daily , Weekly | |
| Add SCLX to Watchlist: View: Get Complete SCLX Trend Analysis ➞ | |
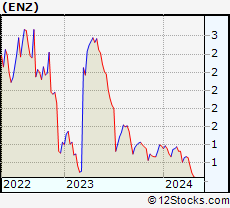 | ENZ Enzo Biochem, Inc. |
| Sector: Health Care | |
| SubSector: Medical Laboratories & Research | |
| MarketCap: 156.3 Millions | |
| Recent Price: 0.54 Smart Investing & Trading Score: 20 | |
| Day Percent Change: -0.0185185% Day Change: -9999 | |
| Week Change: -8.64636% Year-to-date Change: -25.0% | |
| ENZ Links: Profile News Message Board | |
| Charts:- Daily , Weekly | |
| Add ENZ to Watchlist: View: Get Complete ENZ Trend Analysis ➞ | |
 | MSON Misonix, Inc. |
| Sector: Health Care | |
| SubSector: Medical Appliances & Equipment | |
| MarketCap: 156.08 Millions | |
| Recent Price: 14.85 Smart Investing & Trading Score: 30 | |
| Day Percent Change: 2.41379% Day Change: -9999 | |
| Week Change: -44.0467% Year-to-date Change: 0.0% | |
| MSON Links: Profile News Message Board | |
| Charts:- Daily , Weekly | |
| Add MSON to Watchlist: View: Get Complete MSON Trend Analysis ➞ | |
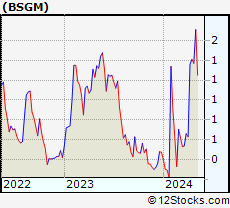 | BSGM Biosig Technologies Inc |
| Sector: Health Care | |
| SubSector: Medical Devices | |
| MarketCap: 155.54 Millions | |
| Recent Price: 5.18 Smart Investing & Trading Score: 40 | |
| Day Percent Change: 7.69231% Day Change: -9999 | |
| Week Change: 40.7609% Year-to-date Change: 270.0% | |
| BSGM Links: Profile News Message Board | |
| Charts:- Daily , Weekly | |
| Add BSGM to Watchlist: View: Get Complete BSGM Trend Analysis ➞ | |
 | ARLZ Aralez Pharmaceuticals Inc. |
| Sector: Health Care | |
| SubSector: Biotechnology | |
| MarketCap: 155.5 Millions | |
| Recent Price: 30.62 Smart Investing & Trading Score: 60 | |
| Day Percent Change: -0.260586% Day Change: -9999 | |
| Week Change: 3.16712% Year-to-date Change: 0.0% | |
| ARLZ Links: Profile News Message Board | |
| Charts:- Daily , Weekly | |
| Add ARLZ to Watchlist: View: Get Complete ARLZ Trend Analysis ➞ | |
 | CABA Cabaletta Bio Inc |
| Sector: Health Care | |
| SubSector: Biotechnology | |
| MarketCap: 155.49 Millions | |
| Recent Price: 1.91 Smart Investing & Trading Score: 100 | |
| Day Percent Change: 3.80435% Day Change: 0.02 | |
| Week Change: 12.3529% Year-to-date Change: -18.0% | |
| CABA Links: Profile News Message Board | |
| Charts:- Daily , Weekly | |
| Add CABA to Watchlist: View: Get Complete CABA Trend Analysis ➞ | |
 | DCGO DocGo Inc |
| Sector: Health Care | |
| SubSector: Medical Care Facilities | |
| MarketCap: 154.54 Millions | |
| Recent Price: 1.56 Smart Investing & Trading Score: 60 | |
| Day Percent Change: 1.96078% Day Change: -0.01 | |
| Week Change: -1.26582% Year-to-date Change: -63.6% | |
| DCGO Links: Profile News Message Board | |
| Charts:- Daily , Weekly | |
| Add DCGO to Watchlist: View: Get Complete DCGO Trend Analysis ➞ | |
 | MIST Milestone Pharmaceuticals Inc |
| Sector: Health Care | |
| SubSector: Biotechnology | |
| MarketCap: 152.99 Millions | |
| Recent Price: 1.97 Smart Investing & Trading Score: 100 | |
| Day Percent Change: 0.510204% Day Change: 0.07 | |
| Week Change: 9.44444% Year-to-date Change: -9.2% | |
| MIST Links: Profile News Message Board | |
| Charts:- Daily , Weekly | |
| Add MIST to Watchlist: View: Get Complete MIST Trend Analysis ➞ | |
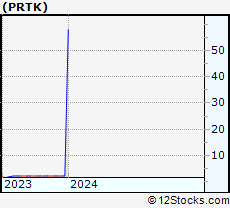 | PRTK Paratek Pharmaceuticals, Inc. |
| Sector: Health Care | |
| SubSector: Biotechnology | |
| MarketCap: 151.185 Millions | |
| Recent Price: 58.01 Smart Investing & Trading Score: 90 | |
| Day Percent Change: 3.83032% Day Change: -9999 | |
| Week Change: 2501.35% Year-to-date Change: 0.0% | |
| PRTK Links: Profile News Message Board | |
| Charts:- Daily , Weekly | |
| Add PRTK to Watchlist: View: Get Complete PRTK Trend Analysis ➞ | |
 | PIRS Pieris Pharmaceuticals, Inc. |
| Sector: Health Care | |
| SubSector: Biotechnology | |
| MarketCap: 150.785 Millions | |
| Recent Price: 12.03 Smart Investing & Trading Score: 0 | |
| Day Percent Change: -27.1565% Day Change: -9999 | |
| Week Change: -26.4694% Year-to-date Change: 0.0% | |
| PIRS Links: Profile News Message Board | |
| Charts:- Daily , Weekly | |
| Add PIRS to Watchlist: View: Get Complete PIRS Trend Analysis ➞ | |
 | THTX Theratechnologies Inc |
| Sector: Health Care | |
| SubSector: Biotechnology | |
| MarketCap: 150.35 Millions | |
| Recent Price: 3.29 Smart Investing & Trading Score: 80 | |
| Day Percent Change: -0.30303% Day Change: 0 | |
| Week Change: 0.611621% Year-to-date Change: 78.8% | |
| THTX Links: Profile News Message Board | |
| Charts:- Daily , Weekly | |
| Add THTX to Watchlist: View: Get Complete THTX Trend Analysis ➞ | |
 | CHRS Coherus Oncology Inc |
| Sector: Health Care | |
| SubSector: Biotechnology | |
| MarketCap: 149.93 Millions | |
| Recent Price: 1.27 Smart Investing & Trading Score: 40 | |
| Day Percent Change: -1.55039% Day Change: 0.06 | |
| Week Change: -1.55039% Year-to-date Change: -9.3% | |
| CHRS Links: Profile News Message Board | |
| Charts:- Daily , Weekly | |
| Add CHRS to Watchlist: View: Get Complete CHRS Trend Analysis ➞ | |
 | GLSI Greenwich LifeSciences Inc |
| Sector: Health Care | |
| SubSector: Biotechnology | |
| MarketCap: 148.98 Millions | |
| Recent Price: 11.68 Smart Investing & Trading Score: 70 | |
| Day Percent Change: 4.00712% Day Change: -0.09 | |
| Week Change: 6.86185% Year-to-date Change: -0.5% | |
| GLSI Links: Profile News Message Board | |
| Charts:- Daily , Weekly | |
| Add GLSI to Watchlist: View: Get Complete GLSI Trend Analysis ➞ | |
 | AST Asterias Biotherapeutics, Inc. |
| Sector: Health Care | |
| SubSector: Biotechnology | |
| MarketCap: 148.51 Millions | |
| Recent Price: 14.23 Smart Investing & Trading Score: 40 | |
| Day Percent Change: 0.49435% Day Change: -9999 | |
| Week Change: -19.6045% Year-to-date Change: 0.0% | |
| AST Links: Profile News Message Board | |
| Charts:- Daily , Weekly | |
| Add AST to Watchlist: View: Get Complete AST Trend Analysis ➞ | |
 | OBIO Orchestra BioMed Holdings Inc |
| Sector: Health Care | |
| SubSector: Biotechnology | |
| MarketCap: 148.38 Millions | |
| Recent Price: 2.60 Smart Investing & Trading Score: 10 | |
| Day Percent Change: 1.16732% Day Change: 0.06 | |
| Week Change: -5.45455% Year-to-date Change: -51.7% | |
| OBIO Links: Profile News Message Board | |
| Charts:- Daily , Weekly | |
| Add OBIO to Watchlist: View: Get Complete OBIO Trend Analysis ➞ | |
 | INO Inovio Pharmaceuticals Inc |
| Sector: Health Care | |
| SubSector: Biotechnology | |
| MarketCap: 148.27 Millions | |
| Recent Price: 2.28 Smart Investing & Trading Score: 30 | |
| Day Percent Change: -4.20168% Day Change: 0.06 | |
| Week Change: -18.2796% Year-to-date Change: 25.3% | |
| INO Links: Profile News Message Board | |
| Charts:- Daily , Weekly | |
| Add INO to Watchlist: View: Get Complete INO Trend Analysis ➞ | |
 | LNSR LENSAR Inc |
| Sector: Health Care | |
| SubSector: Medical Devices | |
| MarketCap: 145.25 Millions | |
| Recent Price: 12.34 Smart Investing & Trading Score: 60 | |
| Day Percent Change: -1.0425% Day Change: -0.08 | |
| Week Change: 1.39688% Year-to-date Change: 42.0% | |
| LNSR Links: Profile News Message Board | |
| Charts:- Daily , Weekly | |
| Add LNSR to Watchlist: View: Get Complete LNSR Trend Analysis ➞ | |
 | ACHV Achieve Life Sciences Inc |
| Sector: Health Care | |
| SubSector: Biotechnology | |
| MarketCap: 144.63 Millions | |
| Recent Price: 3.04 Smart Investing & Trading Score: 60 | |
| Day Percent Change: -1.2987% Day Change: 0.31 | |
| Week Change: 7.42049% Year-to-date Change: -17.6% | |
| ACHV Links: Profile News Message Board | |
| Charts:- Daily , Weekly | |
| Add ACHV to Watchlist: View: Get Complete ACHV Trend Analysis ➞ | |
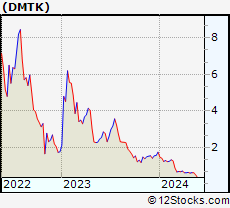 | DMTK DermTech, Inc. |
| Sector: Health Care | |
| SubSector: Medical Appliances & Equipment | |
| MarketCap: 144.08 Millions | |
| Recent Price: 0.04 Smart Investing & Trading Score: 50 | |
| Day Percent Change: -12.0482% Day Change: -9999 | |
| Week Change: 72.9858% Year-to-date Change: 0.0% | |
| DMTK Links: Profile News Message Board | |
| Charts:- Daily , Weekly | |
| Add DMTK to Watchlist: View: Get Complete DMTK Trend Analysis ➞ | |
 | CUTR Cutera, Inc. |
| Sector: Health Care | |
| SubSector: Medical Appliances & Equipment | |
| MarketCap: 143.68 Millions | |
| Recent Price: 0.10 Smart Investing & Trading Score: 20 | |
| Day Percent Change: -10.1946% Day Change: -9999 | |
| Week Change: -69.1794% Year-to-date Change: -75.2% | |
| CUTR Links: Profile News Message Board | |
| Charts:- Daily , Weekly | |
| Add CUTR to Watchlist: View: Get Complete CUTR Trend Analysis ➞ | |
| For tabular summary view of above stock list: Summary View ➞ 0 - 25 , 25 - 50 , 50 - 75 , 75 - 100 , 100 - 125 , 125 - 150 , 150 - 175 , 175 - 200 , 200 - 225 , 225 - 250 , 250 - 275 , 275 - 300 , 300 - 325 , 325 - 350 , 350 - 375 , 375 - 400 , 400 - 425 , 425 - 450 , 450 - 475 , 475 - 500 , 500 - 525 , 525 - 550 , 550 - 575 , 575 - 600 , 600 - 625 , 625 - 650 , 650 - 675 , 675 - 700 , 700 - 725 , 725 - 750 , 750 - 775 , 775 - 800 , 800 - 825 , 825 - 850 , 850 - 875 , 875 - 900 , 900 - 925 , 925 - 950 , 950 - 975 , 975 - 1000 | ||
| Click To Change The Sort Order: By Market Cap or Company Size Performance: Year-to-date, Week and Day | |
| Select Chart Type: | ||
|
Best Stocks Today 12Stocks.com |
© 2025 12Stocks.com Terms & Conditions Privacy Contact Us
All Information Provided Only For Education And Not To Be Used For Investing or Trading. See Terms & Conditions


One More Thing ... Get Best Stocks Delivered Daily!
Never Ever Miss A Move With Our Top Ten Stocks Lists
Find Best Stocks In Any Market - Bull or Bear Market
Take A Peek At Our Top Ten Stocks Lists: Daily, Weekly, Year-to-Date & Top Trends
Find Best Stocks In Any Market - Bull or Bear Market
Take A Peek At Our Top Ten Stocks Lists: Daily, Weekly, Year-to-Date & Top Trends
Healthcare Stocks With Best Up Trends [0-bearish to 100-bullish]: AVITA [100], Monte Rosa[100], C4 [100], AlloVir [100], Cara [100], Spruce Biosciences[100], Ocugen [100], Monopar [100], InnovAge Holding[100], Harrow [100], Kala Bio[100]
Best Healthcare Stocks Year-to-Date:
Regencell Bioscience[11217%], Kaleido BioSciences[9900%], Eagle [664.286%], So-Young [375.53%], Celcuity [319.421%], I-Mab ADR[299.559%], Galectin [284.615%], Biosig Technologies[270%], Immuneering Corp[255.656%], Nektar [239.993%], OptimizeRx Corp[232.63%] Best Healthcare Stocks This Week:
Athersys [193287%], Nobilis Health[101349%], VBI Vaccines[86898.5%], ContraFect [47677.8%], Clovis Oncology[39610.5%], Endo [28369.6%], NanoString Technologies[17224.7%], Neptune Wellness[14100%], ViewRay [11470.2%], Mallkrodt [11382.1%], Achillion [10033.3%] Best Healthcare Stocks Daily:
Kaleido BioSciences[9900%], Neoleukin [332.665%], Syros [226.23%], Athenex [103.333%], AVITA [48.2456%], Monte Rosa[44.0748%], C4 [34.2105%], Accelerate Diagnostics[17.6471%], Aptose Biosciences[17.5439%], AlloVir [16.9215%], Cara [14.3396%]