
 Login Sign Up


| |||||
 |  | ||||

| 12Stocks.com Market Intelligence |
Best Healthcare Stocks
 | "Discover best trending healthcare stocks with 12Stocks.com." |
| - Subu Vdaygiri, Founder, 12Stocks.com |
| In a hurry? Healthcare Stocks Lists: Performance Trends Table, Stock Charts
Sort Healthcare stocks: Daily, Weekly, Year-to-Date, Market Cap & Trends. Filter Healthcare stocks list by size:All Healthcare Large Mid-Range Small |
| 12Stocks.com Healthcare Stocks Performances & Trends Daily | |||||||||
|
|  The overall Smart Investing & Trading Score is 100 (0-bearish to 100-bullish) which puts Healthcare sector in short term bullish trend. The Smart Investing & Trading Score from previous trading session is 70 and an improvement of trend continues.
| ||||||||
Here are the Smart Investing & Trading Scores of the most requested Healthcare stocks at 12Stocks.com (click stock name for detailed review):
|


| 12Stocks.com: Investing in Healthcare sector with Stocks | |
|
The following table helps investors and traders sort through current performance and trends (as measured by Smart Investing & Trading Score) of various
stocks in the Healthcare sector. Quick View: Move mouse or cursor over stock symbol (ticker) to view short-term Technical chart and over stock name to view long term chart. Click on  to add stock symbol to your watchlist and to add stock symbol to your watchlist and  to view watchlist. Click on any ticker or stock name for detailed market intelligence report for that stock. to view watchlist. Click on any ticker or stock name for detailed market intelligence report for that stock. |
12Stocks.com Performance of Stocks in Healthcare Sector
| Ticker | Stock Name | Watchlist | Category | Recent Price | Smart Investing & Trading Score | Change % | YTD Change% |
| ABMD | Abiomed |   | Equipment | 381.02 | 30 | 0.00% | 0.00% |
| RNA | Avidity Biosciences | | Biotechnology | 44.19 | 50 | 2.76% | 41.71% |
| WCG | WellCare Health | | Insurance | 14.73 | 90 | 1.03% | 0.00% |
| CTLT | Catalent | | Pharmaceutical | 63.48 | 70 | 0.00% | 0.00% |
| CYTK | Cytokinetics | | Biotechnology | 56.32 | 100 | 0.86% | 15.10% |
| AXSM | Axsome | | Biotechnology | 119.94 | 80 | 1.16% | 37.36% |
| AMED | Amedisys | | Home Care | 100.99 | 60 | 0.01% | 11.10% |
| NUVL | Nuvalent | | Biotechnology | 83.86 | 60 | 1.55% | 4.84% |
| HRC | Hill-Rom | | Instruments | 90.99 | 0 | 1.06% | 0.00% |
| IRTC | iRhythm Technologies | | Medical Devices | 174.00 | 70 | 3.91% | 94.54% |
| TFX | Teleflex | | Instruments | 125.50 | 80 | 1.28% | -29.55% |
| MMSI | Merit | | Instruments | 82.44 | 40 | 0.44% | -14.19% |
| RDNT | Radnet | | Diagnostics & Research | 78.31 | 90 | 0.41% | 11.63% |
| GKOS | Glaukos | | Medical Devices | 84.49 | 70 | 1.56% | -43.55% |
| HZNP | Horizon | | Pharmaceutical | 84.44 | 30 | 1.22% | 0.00% |
| BLCO | Bausch + | | Instruments | 14.76 | 53 | -1.23% | -16.48% |
| TGTX | TG | | Biotechnology | 36.67 | 70 | 0.30% | 18.06% |
| MRUS | Merus N.V | | Biotechnology | 94.14 | 100 | -0.01% | 122.57% |
| OSCR | Oscar Health | | Healthcare Plans | 19.28 | 70 | 2.01% | 42.29% |
| CRSP | CRISPR | | Biotechnology | 72.85 | 100 | 10.11% | 75.84% |
| ALKS | Alkermes | | Drug Manufacturers - Specialty & Generic | 31.27 | 100 | 2.01% | 8.75% |
| PRAH | PRA Health | | Laboratories | 361.84 | 90 | 1.83% | 0.00% |
| BRKR | Bruker Corp | | Medical Devices | 34.85 | 90 | 0.37% | -40.60% |
| ATHN | athenahealth | | HealthcareIT | 335.65 | 30 | -0.52% | 0.00% |
| PTCT | PTC | | Biotechnology | 63.05 | 100 | 1.68% | 37.42% |
| For chart view version of above stock list: Chart View ➞ 0 - 25 , 25 - 50 , 50 - 75 , 75 - 100 , 100 - 125 , 125 - 150 , 150 - 175 , 175 - 200 , 200 - 225 , 225 - 250 , 250 - 275 , 275 - 300 , 300 - 325 , 325 - 350 , 350 - 375 , 375 - 400 , 400 - 425 , 425 - 450 , 450 - 475 , 475 - 500 , 500 - 525 , 525 - 550 , 550 - 575 , 575 - 600 , 600 - 625 , 625 - 650 , 650 - 675 , 675 - 700 , 700 - 725 , 725 - 750 , 750 - 775 , 775 - 800 , 800 - 825 , 825 - 850 , 850 - 875 , 875 - 900 , 900 - 925 , 925 - 950 , 950 - 975 , 975 - 1000 | ||
 | Click To Change The Sort Order: By Market Cap or Company Size Performance: Year-to-date, Week and Day |  |
|
Get the most comprehensive stock market coverage daily at 12Stocks.com ➞ Best Stocks Today ➞ Best Stocks Weekly ➞ Best Stocks Year-to-Date ➞ Best Stocks Trends ➞  Best Stocks Today 12Stocks.com Best Nasdaq Stocks ➞ Best S&P 500 Stocks ➞ Best Tech Stocks ➞ Best Biotech Stocks ➞ |
| Detailed Overview of Healthcare Stocks |
| Healthcare Technical Overview, Leaders & Laggards, Top Healthcare ETF Funds & Detailed Healthcare Stocks List, Charts, Trends & More |
| Healthcare Sector: Technical Analysis, Trends & YTD Performance | |
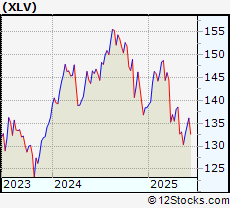
| Healthcare sector is composed of stocks
from pharmaceutical, biotech, diagnostics labs, insurance providers
and healthcare services. Healthcare sector, as represented by XLV, an exchange-traded fund [ETF] that holds basket of Healthcare stocks (e.g, Merck, Amgen) is up by 4.95646% and is currently underperforming the overall market by -9.80144% year-to-date. Below is a quick view of Technical charts and trends: |
|
 XLV Weekly Chart |
|
| Long Term Trend: Very Good | |
| Medium Term Trend: Very Good | |
 XLV Daily Chart |
|
| Short Term Trend: Very Good | |
| Overall Trend Score: 100 | |
| YTD Performance: 4.95646% | |
| **Trend Scores & Views Are Only For Educational Purposes And Not For Investing | |
| 12Stocks.com: Top Performing Healthcare Sector Stocks | ||||||||||||||||||||||||||||||||||||||||||||||
 The top performing Healthcare sector stocks year to date are
Now, more recently, over last week, the top performing Healthcare sector stocks on the move are


|
||||||||||||||||||||||||||||||||||||||||||||||
| 12Stocks.com: Investing in Healthcare Sector using Exchange Traded Funds | |
|
The following table shows list of key exchange traded funds (ETF) that
help investors track Healthcare Index. For detailed view, check out our ETF Funds section of our website. Quick View: Move mouse or cursor over ETF symbol (ticker) to view short-term Technical chart and over ETF name to view long term chart. Click on ticker or stock name for detailed view. Click on to add stock symbol to your watchlist and to view watchlist. |
12Stocks.com List of ETFs that track Healthcare Index
| Ticker | ETF Name | Watchlist | Recent Price | Smart Investing & Trading Score | Change % | Week % | Year-to-date % |
| BTEC | Principal Healthcare Innovators | | 39.49 | 30 | 0 | 1.02328 | 0% |
| 12Stocks.com: Charts, Trends, Fundamental Data and Performances of Healthcare Stocks | |
|
We now take in-depth look at all Healthcare stocks including charts, multi-period performances and overall trends (as measured by Smart Investing & Trading Score). One can sort Healthcare stocks (click link to choose) by Daily, Weekly and by Year-to-Date performances. Also, one can sort by size of the company or by market capitalization. |
| Select Your Default Chart Type: | |||||
| |||||
| Click on stock symbol or name for detailed view. Click on to add stock symbol to your watchlist and to view watchlist. Quick View: Move mouse or cursor over "Daily" to quickly view daily Technical stock chart and over "Weekly" to view weekly Technical stock chart. | |||||

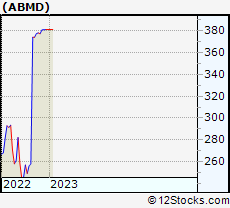 | ABMD Abiomed, Inc. |
| Sector: Health Care | |
| SubSector: Medical Appliances & Equipment | |
| MarketCap: 6488.9 Millions | |
| Recent Price: 381.02 Smart Investing & Trading Score: 30 | |
| Day Percent Change: 0% Day Change: -9999 | |
| Week Change: 0% Year-to-date Change: 0.0% | |
| ABMD Links: Profile News Message Board | |
| Charts:- Daily , Weekly | |
| Add ABMD to Watchlist: View: Get Complete ABMD Trend Analysis ➞ | |
 | RNA Avidity Biosciences Inc |
| Sector: Health Care | |
| SubSector: Biotechnology | |
| MarketCap: 6478.98 Millions | |
| Recent Price: 44.19 Smart Investing & Trading Score: 50 | |
| Day Percent Change: 2.75581% Day Change: 0.32 | |
| Week Change: 2.25642% Year-to-date Change: 41.7% | |
| RNA Links: Profile News Message Board | |
| Charts:- Daily , Weekly | |
| Add RNA to Watchlist: View: Get Complete RNA Trend Analysis ➞ | |
 | WCG WellCare Health Plans, Inc. |
| Sector: Health Care | |
| SubSector: Health Care Plans | |
| MarketCap: 6478.27 Millions | |
| Recent Price: 14.73 Smart Investing & Trading Score: 90 | |
| Day Percent Change: 1.02881% Day Change: -9999 | |
| Week Change: 45.4097% Year-to-date Change: 0.0% | |
| WCG Links: Profile News Message Board | |
| Charts:- Daily , Weekly | |
| Add WCG to Watchlist: View: Get Complete WCG Trend Analysis ➞ | |
 | CTLT Catalent, Inc. |
| Sector: Health Care | |
| SubSector: Drugs - Generic | |
| MarketCap: 6351.95 Millions | |
| Recent Price: 63.48 Smart Investing & Trading Score: 70 | |
| Day Percent Change: 0% Day Change: -9999 | |
| Week Change: 1.7797% Year-to-date Change: 0.0% | |
| CTLT Links: Profile News Message Board | |
| Charts:- Daily , Weekly | |
| Add CTLT to Watchlist: View: Get Complete CTLT Trend Analysis ➞ | |
 | CYTK Cytokinetics Inc |
| Sector: Health Care | |
| SubSector: Biotechnology | |
| MarketCap: 6343.03 Millions | |
| Recent Price: 56.32 Smart Investing & Trading Score: 100 | |
| Day Percent Change: 0.859599% Day Change: 0.73 | |
| Week Change: 16.6287% Year-to-date Change: 15.1% | |
| CYTK Links: Profile News Message Board | |
| Charts:- Daily , Weekly | |
| Add CYTK to Watchlist: View: Get Complete CYTK Trend Analysis ➞ | |
 | AXSM Axsome Therapeutics Inc |
| Sector: Health Care | |
| SubSector: Biotechnology | |
| MarketCap: 6246.17 Millions | |
| Recent Price: 119.94 Smart Investing & Trading Score: 80 | |
| Day Percent Change: 1.15544% Day Change: 0.15 | |
| Week Change: 0.985097% Year-to-date Change: 37.4% | |
| AXSM Links: Profile News Message Board | |
| Charts:- Daily , Weekly | |
| Add AXSM to Watchlist: View: Get Complete AXSM Trend Analysis ➞ | |
 | AMED Amedisys, Inc. |
| Sector: Health Care | |
| SubSector: Home Health Care | |
| MarketCap: 6058.95 Millions | |
| Recent Price: 100.99 Smart Investing & Trading Score: 60 | |
| Day Percent Change: 0.00990295% Day Change: -9999 | |
| Week Change: 1.71216% Year-to-date Change: 11.1% | |
| AMED Links: Profile News Message Board | |
| Charts:- Daily , Weekly | |
| Add AMED to Watchlist: View: Get Complete AMED Trend Analysis ➞ | |
 | NUVL Nuvalent Inc |
| Sector: Health Care | |
| SubSector: Biotechnology | |
| MarketCap: 5832.56 Millions | |
| Recent Price: 83.86 Smart Investing & Trading Score: 60 | |
| Day Percent Change: 1.55001% Day Change: 0.41 | |
| Week Change: 5.43123% Year-to-date Change: 4.8% | |
| NUVL Links: Profile News Message Board | |
| Charts:- Daily , Weekly | |
| Add NUVL to Watchlist: View: Get Complete NUVL Trend Analysis ➞ | |
 | HRC Hill-Rom Holdings, Inc. |
| Sector: Health Care | |
| SubSector: Medical Instruments & Supplies | |
| MarketCap: 5823.2 Millions | |
| Recent Price: 90.99 Smart Investing & Trading Score: 0 | |
| Day Percent Change: 1.05509% Day Change: -9999 | |
| Week Change: -41.5682% Year-to-date Change: 0.0% | |
| HRC Links: Profile News Message Board | |
| Charts:- Daily , Weekly | |
| Add HRC to Watchlist: View: Get Complete HRC Trend Analysis ➞ | |
 | IRTC iRhythm Technologies Inc |
| Sector: Health Care | |
| SubSector: Medical Devices | |
| MarketCap: 5816.73 Millions | |
| Recent Price: 174.00 Smart Investing & Trading Score: 70 | |
| Day Percent Change: 3.91162% Day Change: 3.48 | |
| Week Change: 0.0402461% Year-to-date Change: 94.5% | |
| IRTC Links: Profile News Message Board | |
| Charts:- Daily , Weekly | |
| Add IRTC to Watchlist: View: Get Complete IRTC Trend Analysis ➞ | |
 | TFX Teleflex Incorporated |
| Sector: Health Care | |
| SubSector: Medical Instruments & Supplies | |
| MarketCap: 5776 Millions | |
| Recent Price: 125.50 Smart Investing & Trading Score: 80 | |
| Day Percent Change: 1.27502% Day Change: 0.58 | |
| Week Change: 1.79252% Year-to-date Change: -29.5% | |
| TFX Links: Profile News Message Board | |
| Charts:- Daily , Weekly | |
| Add TFX to Watchlist: View: Get Complete TFX Trend Analysis ➞ | |
 | MMSI Merit Medical Systems, Inc |
| Sector: Health Care | |
| SubSector: Medical Instruments & Supplies | |
| MarketCap: 5505.6 Millions | |
| Recent Price: 82.44 Smart Investing & Trading Score: 40 | |
| Day Percent Change: 0.438596% Day Change: -0.73 | |
| Week Change: -0.770342% Year-to-date Change: -14.2% | |
| MMSI Links: Profile News Message Board | |
| Charts:- Daily , Weekly | |
| Add MMSI to Watchlist: View: Get Complete MMSI Trend Analysis ➞ | |
 | RDNT Radnet Inc |
| Sector: Health Care | |
| SubSector: Diagnostics & Research | |
| MarketCap: 5492.58 Millions | |
| Recent Price: 78.31 Smart Investing & Trading Score: 90 | |
| Day Percent Change: 0.410309% Day Change: -0.03 | |
| Week Change: 3.66693% Year-to-date Change: 11.6% | |
| RDNT Links: Profile News Message Board | |
| Charts:- Daily , Weekly | |
| Add RDNT to Watchlist: View: Get Complete RDNT Trend Analysis ➞ | |
 | GKOS Glaukos Corporation |
| Sector: Health Care | |
| SubSector: Medical Devices | |
| MarketCap: 5387.46 Millions | |
| Recent Price: 84.49 Smart Investing & Trading Score: 70 | |
| Day Percent Change: 1.56269% Day Change: -1.15 | |
| Week Change: 2.05339% Year-to-date Change: -43.6% | |
| GKOS Links: Profile News Message Board | |
| Charts:- Daily , Weekly | |
| Add GKOS to Watchlist: View: Get Complete GKOS Trend Analysis ➞ | |
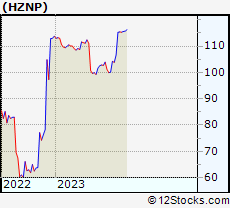 | HZNP Horizon Therapeutics Public Limited Company |
| Sector: Health Care | |
| SubSector: Drugs - Generic | |
| MarketCap: 5379.15 Millions | |
| Recent Price: 84.44 Smart Investing & Trading Score: 30 | |
| Day Percent Change: 1.22273% Day Change: -9999 | |
| Week Change: -27.3947% Year-to-date Change: 0.0% | |
| HZNP Links: Profile News Message Board | |
| Charts:- Daily , Weekly | |
| Add HZNP to Watchlist: View: Get Complete HZNP Trend Analysis ➞ | |
 | BLCO Bausch + Lomb Corp |
| Sector: Health Care | |
| SubSector: Medical Instruments & Supplies | |
| MarketCap: 5311.53 Millions | |
| Recent Price: 14.76 Smart Investing & Trading Score: 53 | |
| Day Percent Change: -1.23% Day Change: -0.18 | |
| Week Change: -0.07% Year-to-date Change: -16.5% | |
| BLCO Links: Profile News Message Board | |
| Charts:- Daily , Weekly | |
| Add BLCO to Watchlist: View: Get Complete BLCO Trend Analysis ➞ | |
 | TGTX TG Therapeutics Inc |
| Sector: Health Care | |
| SubSector: Biotechnology | |
| MarketCap: 5110.62 Millions | |
| Recent Price: 36.67 Smart Investing & Trading Score: 70 | |
| Day Percent Change: 0.300875% Day Change: 0.46 | |
| Week Change: 3.55832% Year-to-date Change: 18.1% | |
| TGTX Links: Profile News Message Board | |
| Charts:- Daily , Weekly | |
| Add TGTX to Watchlist: View: Get Complete TGTX Trend Analysis ➞ | |
 | MRUS Merus N.V |
| Sector: Health Care | |
| SubSector: Biotechnology | |
| MarketCap: 5103.05 Millions | |
| Recent Price: 94.14 Smart Investing & Trading Score: 100 | |
| Day Percent Change: -0.00531067% Day Change: -0.06 | |
| Week Change: 37.9414% Year-to-date Change: 122.6% | |
| MRUS Links: Profile News Message Board | |
| Charts:- Daily , Weekly | |
| Add MRUS to Watchlist: View: Get Complete MRUS Trend Analysis ➞ | |
 | OSCR Oscar Health Inc |
| Sector: Health Care | |
| SubSector: Healthcare Plans | |
| MarketCap: 5023.79 Millions | |
| Recent Price: 19.28 Smart Investing & Trading Score: 70 | |
| Day Percent Change: 2.01058% Day Change: 0.15 | |
| Week Change: 4.55531% Year-to-date Change: 42.3% | |
| OSCR Links: Profile News Message Board | |
| Charts:- Daily , Weekly | |
| Add OSCR to Watchlist: View: Get Complete OSCR Trend Analysis ➞ | |
 | CRSP CRISPR Therapeutics AG |
| Sector: Health Care | |
| SubSector: Biotechnology | |
| MarketCap: 4989.54 Millions | |
| Recent Price: 72.85 Smart Investing & Trading Score: 100 | |
| Day Percent Change: 10.1118% Day Change: 2.41 | |
| Week Change: 19.3284% Year-to-date Change: 75.8% | |
| CRSP Links: Profile News Message Board | |
| Charts:- Daily , Weekly | |
| Add CRSP to Watchlist: View: Get Complete CRSP Trend Analysis ➞ | |
 | ALKS Alkermes plc |
| Sector: Health Care | |
| SubSector: Drug Manufacturers - Specialty & Generic | |
| MarketCap: 4942.44 Millions | |
| Recent Price: 31.27 Smart Investing & Trading Score: 100 | |
| Day Percent Change: 2.00653% Day Change: 0.29 | |
| Week Change: 12.4236% Year-to-date Change: 8.7% | |
| ALKS Links: Profile News Message Board | |
| Charts:- Daily , Weekly | |
| Add ALKS to Watchlist: View: Get Complete ALKS Trend Analysis ➞ | |
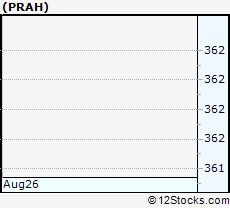 | PRAH PRA Health Sciences, Inc. |
| Sector: Health Care | |
| SubSector: Medical Laboratories & Research | |
| MarketCap: 4742.1 Millions | |
| Recent Price: 361.84 Smart Investing & Trading Score: 90 | |
| Day Percent Change: 1.83497% Day Change: -9999 | |
| Week Change: 119.018% Year-to-date Change: 0.0% | |
| PRAH Links: Profile News Message Board | |
| Charts:- Daily , Weekly | |
| Add PRAH to Watchlist: View: Get Complete PRAH Trend Analysis ➞ | |
 | BRKR Bruker Corp |
| Sector: Health Care | |
| SubSector: Medical Devices | |
| MarketCap: 4677.51 Millions | |
| Recent Price: 34.85 Smart Investing & Trading Score: 90 | |
| Day Percent Change: 0.374424% Day Change: 0.14 | |
| Week Change: 8.87223% Year-to-date Change: -40.6% | |
| BRKR Links: Profile News Message Board | |
| Charts:- Daily , Weekly | |
| Add BRKR to Watchlist: View: Get Complete BRKR Trend Analysis ➞ | |
 | ATHN athenahealth, Inc. |
| Sector: Health Care | |
| SubSector: Healthcare Information Services | |
| MarketCap: 4602.71 Millions | |
| Recent Price: 335.65 Smart Investing & Trading Score: 30 | |
| Day Percent Change: -0.518672% Day Change: -9999 | |
| Week Change: -3.81143% Year-to-date Change: 0.0% | |
| ATHN Links: Profile News Message Board | |
| Charts:- Daily , Weekly | |
| Add ATHN to Watchlist: View: Get Complete ATHN Trend Analysis ➞ | |
 | PTCT PTC Therapeutics Inc |
| Sector: Health Care | |
| SubSector: Biotechnology | |
| MarketCap: 4548.63 Millions | |
| Recent Price: 63.05 Smart Investing & Trading Score: 100 | |
| Day Percent Change: 1.67715% Day Change: 0.07 | |
| Week Change: 5.96639% Year-to-date Change: 37.4% | |
| PTCT Links: Profile News Message Board | |
| Charts:- Daily , Weekly | |
| Add PTCT to Watchlist: View: Get Complete PTCT Trend Analysis ➞ | |
| For tabular summary view of above stock list: Summary View ➞ 0 - 25 , 25 - 50 , 50 - 75 , 75 - 100 , 100 - 125 , 125 - 150 , 150 - 175 , 175 - 200 , 200 - 225 , 225 - 250 , 250 - 275 , 275 - 300 , 300 - 325 , 325 - 350 , 350 - 375 , 375 - 400 , 400 - 425 , 425 - 450 , 450 - 475 , 475 - 500 , 500 - 525 , 525 - 550 , 550 - 575 , 575 - 600 , 600 - 625 , 625 - 650 , 650 - 675 , 675 - 700 , 700 - 725 , 725 - 750 , 750 - 775 , 775 - 800 , 800 - 825 , 825 - 850 , 850 - 875 , 875 - 900 , 900 - 925 , 925 - 950 , 950 - 975 , 975 - 1000 | ||
| Click To Change The Sort Order: By Market Cap or Company Size Performance: Year-to-date, Week and Day | |
| Select Chart Type: | ||
|
Best Stocks Today 12Stocks.com |
© 2025 12Stocks.com Terms & Conditions Privacy Contact Us
All Information Provided Only For Education And Not To Be Used For Investing or Trading. See Terms & Conditions


One More Thing ... Get Best Stocks Delivered Daily!
Never Ever Miss A Move With Our Top Ten Stocks Lists
Find Best Stocks In Any Market - Bull or Bear Market
Take A Peek At Our Top Ten Stocks Lists: Daily, Weekly, Year-to-Date & Top Trends
Find Best Stocks In Any Market - Bull or Bear Market
Take A Peek At Our Top Ten Stocks Lists: Daily, Weekly, Year-to-Date & Top Trends
Healthcare Stocks With Best Up Trends [0-bearish to 100-bullish]: Taysha Gene[100], DBV Technologies[100], Valneva SE[100], ClearPoint Neuro[100], Prime Medicine[100], AlloVir [100], Sarepta [100], Monopar [100], Cara [100], Absci Corp[100], Spruce Biosciences[100]
Best Healthcare Stocks Year-to-Date:
Regencell Bioscience[12636.6%], Kaleido BioSciences[9900%], Vor Biopharma[3175%], Nanobiotix ADR[581.379%], Eagle [542.857%], So-Young [395.711%], I-Mab ADR[357.506%], Monopar [337.489%], Nektar [319.84%], 908 Devices[299.543%], DBV Technologies[276.923%] Best Healthcare Stocks This Week:
Athersys [193287%], Nobilis Health[101349%], VBI Vaccines[86898.5%], ContraFect [47677.8%], Clovis Oncology[39610.5%], Endo [28369.6%], NanoString Technologies[17224.7%], Neptune Wellness[14100%], ViewRay [11470.2%], Mallkrodt [11382.1%], Achillion [10033.3%] Best Healthcare Stocks Daily:
Kaleido BioSciences[9900%], Neoleukin [332.665%], Syros [226.23%], Athenex [103.333%], Taysha Gene[53.4591%], DBV Technologies[21.6485%], Valneva SE[20.197%], ClearPoint Neuro[19.7991%], Prime Medicine[19.4097%], Accelerate Diagnostics[17.6471%], Aptose Biosciences[17.5439%]