
 Login Sign Up


| |||||
 |  | ||||

| 12Stocks.com Market Intelligence |
Best China Stocks
|
On this page, you will find the most comprehensive analysis of Chinese stocks and ETFs - from latest trends to performances to charts ➞. First, here are the year-to-date (YTD) performances of the most requested China stocks at 12Stocks.com (click stock for review):
| Alibaba 88% | ||
| NetEase 80% | ||
| Weibo Corp 47% | ||
| Vipshop 44% | ||
| Baidu 39% | ||
| Sohu.com . 21% | ||
| JOYY 20% | ||
| JD.com 1% | ||
| Aluminum 0% | ||
| China Eastern 0% | ||
| CNOOC 0% | ||
| China Mobile 0% | ||
| Ctrip.com 0% | ||
| 51job 0% | ||
| Michael Kors 0% | ||
| China Life 0% | ||
| Melco Crown 0% | ||
| PetroChina 0% | ||
| SINA 0% | ||
| 58.com 0% | ||
| New Oriental -14% | ||
| In a hurry? China Stocks Lists: Performance Trends Table, Stock Charts
Sort China stocks: Daily, Weekly, Year-to-Date, Market Cap & Trends. Filter China stocks list by sector: Show all, Tech, Finance, Energy, Staples, Retail, Industrial, Materials, Utilities and HealthCare Filter China stocks list by size: All China Large Medium Small and MicroCap |
| September 16, 2025 - 12Stocks.com China Stocks Performances & Trends Daily | |||||||||
|
|  The overall Smart Investing & Trading Score is 100 (0-bearish to 100-bullish) which puts China index in short term bullish trend. The Smart Investing & Trading Score from previous trading session is 70 and an improvement of trend continues.
| ||||||||
Here are the Smart Investing & Trading Scores of the most requested China stocks at 12Stocks.com (click stock name for detailed review):
|


| 12Stocks.com: Top Performing China Index Stocks | |||||||||||||||||||||||||||||||||||||||||||||||
 The top performing China Index stocks year to date are
Now, more recently, over last week, the top performing China Index stocks on the move are


|
|||||||||||||||||||||||||||||||||||||||||||||||
| 12Stocks.com: Investing in China Index with Stocks | |
|
The following table helps investors and traders sort through current performance and trends (as measured by Smart Investing & Trading Score) of various
stocks in the China Index. Quick View: Move mouse or cursor over stock symbol (ticker) to view short-term technical chart and over stock name to view long term chart. Click on  to add stock symbol to your watchlist and to add stock symbol to your watchlist and  to view watchlist. Click on any ticker or stock name for detailed market intelligence report for that stock. to view watchlist. Click on any ticker or stock name for detailed market intelligence report for that stock. |
12Stocks.com Performance of Stocks in China Index
| Ticker | Stock Name | Watchlist | Category | Recent Price | Smart Investing & Trading Score | Change % | YTD Change% |
| CHL | China Mobile |   | Technology | 170.03 | 60 | 0.57% | 0.00% |
| NTES | NetEase | | Technology | 154.83 | 100 | 1.35% | 79.51% |
| BIDU | Baidu | | Technology | 114.82 | 90 | 0.03% | 38.84% |
| CHU | China Unicom | | Technology | 44.89 | 60 | -1.30% | 0.00% |
| LIZI | Lizhi | | Technology | 3.40 | 20 | -3.41% | 0.00% |
| TME | Tencent Music | | Technology | 25.52 | 90 | 2.08% | 125.44% |
| YMM | Full Truck | | Technology | 13.55 | 90 | -0.51% | 25.23% |
| BZ | Kanzhun | | Technology | 24.68 | 80 | 0.57% | 80.94% |
| BILI | Bilibili | | Technology | 27.08 | 100 | 6.40% | 58.09% |
| WUBA | 58.com | | Technology | 78.83 | 0 | -1.08% | 0.00% |
| GDS | GDS | | Technology | 37.20 | 80 | -2.64% | 60.48% |
| SMI | Semiconductor | | Technology | 46.56 | 50 | 0.02% | 0.00% |
| KC | Kingsoft Cloud | | Technology | 16.34 | 60 | 0.37% | 52.43% |
| YY | JOYY | | Technology | 47.85 | 70 | -2.39% | 20.29% |
| ATHM | Autohome | | Technology | 29.41 | 90 | -0.03% | 14.13% |
| SIMO | Silicon Motion | | Technology | 90.01 | 100 | 1.44% | 68.91% |
| SINA | SINA | | Technology | 79.70 | 100 | 1.07% | 0.00% |
| VNET | VNET | | Technology | 9.59 | 100 | 0.21% | 89.53% |
| DQ | Daqo New | | Technology | 27.38 | 90 | 6.08% | 35.28% |
| WB | Weibo Corp | | Technology | 12.25 | 70 | 2.85% | 47.40% |
| IQ | iQIYI | | Technology | 2.57 | 40 | -1.53% | 29.15% |
| TUYA | Tuya | | Technology | 2.61 | 70 | 1.16% | 51.85% |
| JKS | JinkoSolar Holding | | Technology | 26.32 | 100 | 4.90% | 7.68% |
| MOMO | Hello | | Technology | 7.62 | 40 | 1.87% | 9.03% |
| QTT | Qutoutiao | | Technology | 0.18 | 30 | 0.00% | 0.00% |
| For chart view version of above stock list: Chart View ➞ 0 - 25 , 25 - 50 , 50 - 75 | ||
 | Click To Change The Sort Order: By Market Cap or Company Size Performance: Year-to-date, Week and Day |  |
|
Get the most comprehensive stock market coverage daily at 12Stocks.com ➞ Best Stocks Today ➞ Best Stocks Weekly ➞ Best Stocks Year-to-Date ➞ Best Stocks Trends ➞  Best Stocks Today 12Stocks.com Best Nasdaq Stocks ➞ Best S&P 500 Stocks ➞ Best Tech Stocks ➞ Best Biotech Stocks ➞ |
| Detailed Overview of China Stocks |
| China Technical Overview, Leaders & Laggards, Top China ETF Funds & Detailed China Stocks List, Charts, Trends & More |
| China: Technical Analysis, Trends & YTD Performance | |
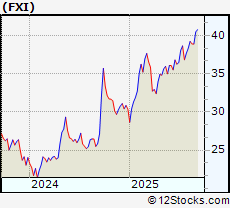
 FXI Weekly Chart |
|
| Long Term Trend: Very Good | |
| Medium Term Trend: Very Good | |
 FXI Daily Chart |
|
| Short Term Trend: Very Good | |
| Overall Trend Score: 100 | |
| YTD Performance: 36.4336% | |
| **Trend Scores & Views Are Only For Educational Purposes And Not For Investing | |
| 12Stocks.com: Investing in China Index using Exchange Traded Funds | |
|
The following table shows list of key exchange traded funds (ETF) that
help investors play China stock market. For detailed view, check out our ETF Funds section of our website. Quick View: Move mouse or cursor over ETF symbol (ticker) to view short-term technical chart and over ETF name to view long term chart. Click on ticker or stock name for detailed view. Click on to add stock symbol to your watchlist and to view watchlist. |
12Stocks.com List of ETFs that track China Index
| Ticker | ETF Name | Watchlist | Recent Price | Smart Investing & Trading Score | Change % | Week % | Year-to-date % |
| QQQC | China Technology | | 116.80 | 70 | -0.0513435 | 5.72049 | 0% |
| YAO | China All-Cap | | 54.77 | 60 | -0.327571 | 1.44471 | 0% |
| CN | All China Eq | | 23.67 | 30 | 0 | 0 | 0% |
| CYB | Chinese Yuan | | 11.27 | 40 | 3.67985 | -53.5591 | 0% |
| 12Stocks.com: Charts, Trends, Fundamental Data and Performances of China Stocks | |
|
We now take in-depth look at all China stocks including charts, multi-period performances and overall trends (as measured by Smart Investing & Trading Score). One can sort China stocks (click link to choose) by Daily, Weekly and by Year-to-Date performances. Also, one can sort by size of the company or by market capitalization. |
| Select Your Default Chart Type: | |||||
| |||||
| Click on stock symbol or name for detailed view. Click on to add stock symbol to your watchlist and to view watchlist. Quick View: Move mouse or cursor over "Daily" to quickly view daily technical stock chart and over "Weekly" to view weekly technical stock chart. | |||||

 | CHL China Mobile Limited |
| Sector: Technology | |
| SubSector: Wireless Communications | |
| MarketCap: 152730 Millions | |
| Recent Price: 170.03 Smart Investing & Trading Score: 60 | |
| Day Percent Change: 0.573761% Day Change: -9999 | |
| Week Change: 27.9576% Year-to-date Change: 0.0% | |
| CHL Links: Profile News Message Board | |
| Charts:- Daily , Weekly | |
| Add CHL to Watchlist: View: Get Complete CHL Trend Analysis ➞ | |
 | NTES NetEase Inc ADR |
| Sector: Technology | |
| SubSector: Electronic Gaming & Multimedia | |
| MarketCap: 85372.9 Millions | |
| Recent Price: 154.83 Smart Investing & Trading Score: 100 | |
| Day Percent Change: 1.34843% Day Change: 2.31 | |
| Week Change: 15.3124% Year-to-date Change: 79.5% | |
| NTES Links: Profile News Message Board | |
| Charts:- Daily , Weekly | |
| Add NTES to Watchlist: View: Get Complete NTES Trend Analysis ➞ | |
 | BIDU Baidu Inc ADR |
| Sector: Technology | |
| SubSector: Internet Content & Information | |
| MarketCap: 28539.6 Millions | |
| Recent Price: 114.82 Smart Investing & Trading Score: 90 | |
| Day Percent Change: 0.0348493% Day Change: 0.07 | |
| Week Change: 12.6128% Year-to-date Change: 38.8% | |
| BIDU Links: Profile News Message Board | |
| Charts:- Daily , Weekly | |
| Add BIDU to Watchlist: View: Get Complete BIDU Trend Analysis ➞ | |
 | CHU China Unicom (Hong Kong) Limited |
| Sector: Technology | |
| SubSector: Wireless Communications | |
| MarketCap: 19006.1 Millions | |
| Recent Price: 44.89 Smart Investing & Trading Score: 60 | |
| Day Percent Change: -1.29727% Day Change: -9999 | |
| Week Change: 15.7555% Year-to-date Change: 0.0% | |
| CHU Links: Profile News Message Board | |
| Charts:- Daily , Weekly | |
| Add CHU to Watchlist: View: Get Complete CHU Trend Analysis ➞ | |
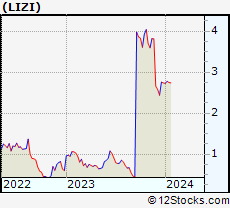 | LIZI Lizhi Inc. |
| Sector: Technology | |
| SubSector: Internet Content & Information | |
| MarketCap: 16837 Millions | |
| Recent Price: 3.40 Smart Investing & Trading Score: 20 | |
| Day Percent Change: -3.40909% Day Change: -9999 | |
| Week Change: -6.84932% Year-to-date Change: 0.0% | |
| LIZI Links: Profile News Message Board | |
| Charts:- Daily , Weekly | |
| Add LIZI to Watchlist: View: Get Complete LIZI Trend Analysis ➞ | |
 | TME Tencent Music Entertainment Group ADR |
| Sector: Technology | |
| SubSector: Internet Content & Information | |
| MarketCap: 14109.9 Millions | |
| Recent Price: 25.52 Smart Investing & Trading Score: 90 | |
| Day Percent Change: 2.08% Day Change: -0.11 | |
| Week Change: 4.2058% Year-to-date Change: 125.4% | |
| TME Links: Profile News Message Board | |
| Charts:- Daily , Weekly | |
| Add TME to Watchlist: View: Get Complete TME Trend Analysis ➞ | |
 | YMM Full Truck Alliance Co Ltd ADR |
| Sector: Technology | |
| SubSector: Software - Application | |
| MarketCap: 12347.5 Millions | |
| Recent Price: 13.55 Smart Investing & Trading Score: 90 | |
| Day Percent Change: -0.51395% Day Change: 1.08 | |
| Week Change: 3.43511% Year-to-date Change: 25.2% | |
| YMM Links: Profile News Message Board | |
| Charts:- Daily , Weekly | |
| Add YMM to Watchlist: View: Get Complete YMM Trend Analysis ➞ | |
 | BZ Kanzhun Ltd ADR |
| Sector: Technology | |
| SubSector: Internet Content & Information | |
| MarketCap: 9401.12 Millions | |
| Recent Price: 24.68 Smart Investing & Trading Score: 80 | |
| Day Percent Change: 0.570497% Day Change: 1.46 | |
| Week Change: 2.9191% Year-to-date Change: 80.9% | |
| BZ Links: Profile News Message Board | |
| Charts:- Daily , Weekly | |
| Add BZ to Watchlist: View: Get Complete BZ Trend Analysis ➞ | |
 | BILI Bilibili Inc ADR |
| Sector: Technology | |
| SubSector: Internet Content & Information | |
| MarketCap: 7252.55 Millions | |
| Recent Price: 27.08 Smart Investing & Trading Score: 100 | |
| Day Percent Change: 6.40472% Day Change: -1.54 | |
| Week Change: 20.8389% Year-to-date Change: 58.1% | |
| BILI Links: Profile News Message Board | |
| Charts:- Daily , Weekly | |
| Add BILI to Watchlist: View: Get Complete BILI Trend Analysis ➞ | |
 | WUBA 58.com Inc. |
| Sector: Technology | |
| SubSector: Internet Information Providers | |
| MarketCap: 7215.3 Millions | |
| Recent Price: 78.83 Smart Investing & Trading Score: 0 | |
| Day Percent Change: -1.07918% Day Change: -9999 | |
| Week Change: -24.0851% Year-to-date Change: 0.0% | |
| WUBA Links: Profile News Message Board | |
| Charts:- Daily , Weekly | |
| Add WUBA to Watchlist: View: Get Complete WUBA Trend Analysis ➞ | |
 | GDS GDS Holdings Limited ADR |
| Sector: Technology | |
| SubSector: Information Technology Services | |
| MarketCap: 6664.85 Millions | |
| Recent Price: 37.20 Smart Investing & Trading Score: 80 | |
| Day Percent Change: -2.64329% Day Change: -1.9 | |
| Week Change: 12.1495% Year-to-date Change: 60.5% | |
| GDS Links: Profile News Message Board | |
| Charts:- Daily , Weekly | |
| Add GDS to Watchlist: View: Get Complete GDS Trend Analysis ➞ | |
 | SMI Semiconductor Manufacturing International Corporation |
| Sector: Technology | |
| SubSector: Semiconductor - Integrated Circuits | |
| MarketCap: 6287.56 Millions | |
| Recent Price: 46.56 Smart Investing & Trading Score: 50 | |
| Day Percent Change: 0.0214823% Day Change: -9999 | |
| Week Change: -0.192926% Year-to-date Change: 0.0% | |
| SMI Links: Profile News Message Board | |
| Charts:- Daily , Weekly | |
| Add SMI to Watchlist: View: Get Complete SMI Trend Analysis ➞ | |
 | KC Kingsoft Cloud Holdings Ltd ADR |
| Sector: Technology | |
| SubSector: Software - Application | |
| MarketCap: 3755.58 Millions | |
| Recent Price: 16.34 Smart Investing & Trading Score: 60 | |
| Day Percent Change: 0.36855% Day Change: -0.23 | |
| Week Change: 18.2344% Year-to-date Change: 52.4% | |
| KC Links: Profile News Message Board | |
| Charts:- Daily , Weekly | |
| Add KC to Watchlist: View: Get Complete KC Trend Analysis ➞ | |
 | YY JOYY Inc. |
| Sector: Technology | |
| SubSector: Internet Information Providers | |
| MarketCap: 3527.6 Millions | |
| Recent Price: 47.85 Smart Investing & Trading Score: 70 | |
| Day Percent Change: -2.38678% Day Change: -9999 | |
| Week Change: 10.8922% Year-to-date Change: 20.3% | |
| YY Links: Profile News Message Board | |
| Charts:- Daily , Weekly | |
| Add YY to Watchlist: View: Get Complete YY Trend Analysis ➞ | |
 | ATHM Autohome Inc ADR |
| Sector: Technology | |
| SubSector: Internet Content & Information | |
| MarketCap: 3388.57 Millions | |
| Recent Price: 29.41 Smart Investing & Trading Score: 90 | |
| Day Percent Change: -0.0339905% Day Change: 0.28 | |
| Week Change: 2.79623% Year-to-date Change: 14.1% | |
| ATHM Links: Profile News Message Board | |
| Charts:- Daily , Weekly | |
| Add ATHM to Watchlist: View: Get Complete ATHM Trend Analysis ➞ | |
 | SIMO Silicon Motion Technology Corp ADR |
| Sector: Technology | |
| SubSector: Semiconductors | |
| MarketCap: 2799.27 Millions | |
| Recent Price: 90.01 Smart Investing & Trading Score: 100 | |
| Day Percent Change: 1.44258% Day Change: 0.06 | |
| Week Change: 9.26196% Year-to-date Change: 68.9% | |
| SIMO Links: Profile News Message Board | |
| Charts:- Daily , Weekly | |
| Add SIMO to Watchlist: View: Get Complete SIMO Trend Analysis ➞ | |
 | SINA SINA Corporation |
| Sector: Technology | |
| SubSector: Internet Software & Services | |
| MarketCap: 2168.61 Millions | |
| Recent Price: 79.70 Smart Investing & Trading Score: 100 | |
| Day Percent Change: 1.06518% Day Change: -9999 | |
| Week Change: 64.9762% Year-to-date Change: 0.0% | |
| SINA Links: Profile News Message Board | |
| Charts:- Daily , Weekly | |
| Add SINA to Watchlist: View: Get Complete SINA Trend Analysis ➞ | |
 | VNET VNET Group Inc ADR |
| Sector: Technology | |
| SubSector: Information Technology Services | |
| MarketCap: 2084.81 Millions | |
| Recent Price: 9.59 Smart Investing & Trading Score: 100 | |
| Day Percent Change: 0.208986% Day Change: -0.64 | |
| Week Change: 21.3924% Year-to-date Change: 89.5% | |
| VNET Links: Profile News Message Board | |
| Charts:- Daily , Weekly | |
| Add VNET to Watchlist: View: Get Complete VNET Trend Analysis ➞ | |
 | DQ Daqo New Energy Corp ADR |
| Sector: Technology | |
| SubSector: Solar | |
| MarketCap: 1949.77 Millions | |
| Recent Price: 27.38 Smart Investing & Trading Score: 90 | |
| Day Percent Change: 6.08291% Day Change: -0.36 | |
| Week Change: -6.26498% Year-to-date Change: 35.3% | |
| DQ Links: Profile News Message Board | |
| Charts:- Daily , Weekly | |
| Add DQ to Watchlist: View: Get Complete DQ Trend Analysis ➞ | |
 | WB Weibo Corp ADR |
| Sector: Technology | |
| SubSector: Internet Content & Information | |
| MarketCap: 1832.03 Millions | |
| Recent Price: 12.25 Smart Investing & Trading Score: 70 | |
| Day Percent Change: 2.85474% Day Change: 0.12 | |
| Week Change: 6.15251% Year-to-date Change: 47.4% | |
| WB Links: Profile News Message Board | |
| Charts:- Daily , Weekly | |
| Add WB to Watchlist: View: Get Complete WB Trend Analysis ➞ | |
 | IQ iQIYI Inc ADR |
| Sector: Technology | |
| SubSector: Entertainment | |
| MarketCap: 1431.96 Millions | |
| Recent Price: 2.57 Smart Investing & Trading Score: 40 | |
| Day Percent Change: -1.53257% Day Change: 0.05 | |
| Week Change: -5.16605% Year-to-date Change: 29.1% | |
| IQ Links: Profile News Message Board | |
| Charts:- Daily , Weekly | |
| Add IQ to Watchlist: View: Get Complete IQ Trend Analysis ➞ | |
 | TUYA Tuya Inc ADR |
| Sector: Technology | |
| SubSector: Software - Infrastructure | |
| MarketCap: 1359.24 Millions | |
| Recent Price: 2.61 Smart Investing & Trading Score: 70 | |
| Day Percent Change: 1.16279% Day Change: 0.07 | |
| Week Change: 3.57143% Year-to-date Change: 51.9% | |
| TUYA Links: Profile News Message Board | |
| Charts:- Daily , Weekly | |
| Add TUYA to Watchlist: View: Get Complete TUYA Trend Analysis ➞ | |
 | JKS JinkoSolar Holding Co. Ltd ADR |
| Sector: Technology | |
| SubSector: Solar | |
| MarketCap: 1277.06 Millions | |
| Recent Price: 26.32 Smart Investing & Trading Score: 100 | |
| Day Percent Change: 4.90235% Day Change: -0.97 | |
| Week Change: 3.2967% Year-to-date Change: 7.7% | |
| JKS Links: Profile News Message Board | |
| Charts:- Daily , Weekly | |
| Add JKS to Watchlist: View: Get Complete JKS Trend Analysis ➞ | |
 | MOMO Hello Group Inc ADR |
| Sector: Technology | |
| SubSector: Internet Content & Information | |
| MarketCap: 1026.57 Millions | |
| Recent Price: 7.62 Smart Investing & Trading Score: 40 | |
| Day Percent Change: 1.87166% Day Change: 0.13 | |
| Week Change: -10.5634% Year-to-date Change: 9.0% | |
| MOMO Links: Profile News Message Board | |
| Charts:- Daily , Weekly | |
| Add MOMO to Watchlist: View: Get Complete MOMO Trend Analysis ➞ | |
 | QTT Qutoutiao Inc. |
| Sector: Technology | |
| SubSector: Internet Information Providers | |
| MarketCap: 956.98 Millions | |
| Recent Price: 0.18 Smart Investing & Trading Score: 30 | |
| Day Percent Change: 0% Day Change: -9999 | |
| Week Change: 0% Year-to-date Change: 0.0% | |
| QTT Links: Profile News Message Board | |
| Charts:- Daily , Weekly | |
| Add QTT to Watchlist: View: Get Complete QTT Trend Analysis ➞ | |
| For tabular summary view of above stock list: Summary View ➞ 0 - 25 , 25 - 50 , 50 - 75 | ||
| Click To Change The Sort Order: By Market Cap or Company Size Performance: Year-to-date, Week and Day | |
| Select Chart Type: | ||
|
Best Stocks Today 12Stocks.com |
© 2025 12Stocks.com Terms & Conditions Privacy Contact Us
All Information Provided Only For Education And Not To Be Used For Investing or Trading. See Terms & Conditions


One More Thing ... Get Best Stocks Delivered Daily!
Never Ever Miss A Move With Our Top Ten Stocks Lists
Find Best Stocks In Any Market - Bull or Bear Market
Take A Peek At Our Top Ten Stocks Lists: Daily, Weekly, Year-to-Date & Top Trends
Find Best Stocks In Any Market - Bull or Bear Market
Take A Peek At Our Top Ten Stocks Lists: Daily, Weekly, Year-to-Date & Top Trends
China Stocks With Best Up Trends [0-bearish to 100-bullish]: Bilibili [100], JinkoSolar Holding[100], Zhihu [100], Alibaba [100], Silicon Motion[100], NetEase [100], China [100], Ctrip.com [100], SINA [100], Hollysys Automation[100], VNET [100]
Best China Stocks Year-to-Date:
Regencell Bioscience[11217%], So-Young [375.53%], QuantaSing [269.91%], Xunlei [266.667%], Oneconnect Financial[195.885%], Yatsen Holding[162.24%], Masterbeef [156.098%], Niu [136.782%], Tencent Music[125.442%], HUYA [104.307%], VNET [89.5257%] Best China Stocks This Week:
CNOOC [137266%], Nam Tai[5033.33%], Fang [4150%], Sinopec Shanghai[1992.58%], PetroChina [1137.09%], China [1104.2%], China Life[690.958%], Leju [539.091%], Aluminum [516.255%], Global Cord[335.132%], eHi Car[175.244%] Best China Stocks Daily:
Masterbeef [12.2995%], Jianpu [7.78054%], Li Auto[6.90359%], Bilibili [6.40472%], Daqo New[6.08291%], JinkoSolar Holding[4.90235%], NIO [4.34084%], Zhihu [4.2471%], QuantaSing [3.9%], Solowin [3.84615%], Tarena [3.52941%]