
 Login Sign Up


| |||||
 |  | ||||

| 12Stocks.com Market Intelligence |
Best China Stocks
|
On this page, you will find the most comprehensive analysis of Chinese stocks and ETFs - from latest trends to performances to charts ➞. First, here are the year-to-date (YTD) performances of the most requested China stocks at 12Stocks.com (click stock for review):
| Alibaba 93% | ||
| NetEase 79% | ||
| Baidu 64% | ||
| Weibo Corp 54% | ||
| Vipshop 50% | ||
| Sohu.com . 23% | ||
| JOYY 20% | ||
| JD.com 7% | ||
| Aluminum 0% | ||
| China Eastern 0% | ||
| CNOOC 0% | ||
| China Mobile 0% | ||
| Ctrip.com 0% | ||
| 51job 0% | ||
| Michael Kors 0% | ||
| China Life 0% | ||
| Melco Crown 0% | ||
| PetroChina 0% | ||
| SINA 0% | ||
| 58.com 0% | ||
| New Oriental -12% | ||
| In a hurry? China Stocks Lists: Performance Trends Table, Stock Charts
Sort China stocks: Daily, Weekly, Year-to-Date, Market Cap & Trends. Filter China stocks list by sector: Show all, Tech, Finance, Energy, Staples, Retail, Industrial, Materials, Utilities and HealthCare Filter China stocks list by size: All China Large Medium Small and MicroCap |
| September 18, 2025 - 12Stocks.com China Stocks Performances & Trends Daily | |||||||||
|
|  The overall Smart Investing & Trading Score is 70 (0-bearish to 100-bullish) which puts China index in short term neutral to bullish trend. The Smart Investing & Trading Score from previous trading session is 100 and a deterioration of trend continues.
| ||||||||
Here are the Smart Investing & Trading Scores of the most requested China stocks at 12Stocks.com (click stock name for detailed review):
|


| 12Stocks.com: Top Performing China Index Stocks | |||||||||||||||||||||||||||||||||||||||||||||||
 The top performing China Index stocks year to date are
Now, more recently, over last week, the top performing China Index stocks on the move are


|
|||||||||||||||||||||||||||||||||||||||||||||||
| 12Stocks.com: Investing in China Index with Stocks | |
|
The following table helps investors and traders sort through current performance and trends (as measured by Smart Investing & Trading Score) of various
stocks in the China Index. Quick View: Move mouse or cursor over stock symbol (ticker) to view short-term technical chart and over stock name to view long term chart. Click on  to add stock symbol to your watchlist and to add stock symbol to your watchlist and  to view watchlist. Click on any ticker or stock name for detailed market intelligence report for that stock. to view watchlist. Click on any ticker or stock name for detailed market intelligence report for that stock. |
12Stocks.com Performance of Stocks in China Index
| Ticker | Stock Name | Watchlist | Category | Recent Price | Smart Investing & Trading Score | Change % | YTD Change% |
| LFC | China Life |   | Financials | 43.74 | 80 | -0.36% | 0.00% |
| BRLI | Brilliant Acquisition | | Financials | 4.70 | 10 | 0.00% | 0.00% |
| BEKE | KE | | Financials | 20.36 | 100 | 1.85% | 16.39% |
| QFIN | Qfin | | Financials | 30.76 | 70 | 6.66% | -19.00% |
| LU | Lufax Holding | | Financials | 3.14 | 80 | 5.72% | 31.38% |
| FANH | Fanhua | | Financials | 1.51 | 10 | -1.31% | 0.00% |
| FINV | FinVolution | | Financials | 7.97 | 50 | 4.32% | 21.99% |
| CANG | Cango | | Financials | 4.49 | 10 | -1.54% | -10.56% |
| LX | LexinFintech | | Financials | 5.86 | 50 | 3.17% | 3.16% |
| NOAH | Noah | | Financials | 11.65 | 20 | 0.78% | 14.46% |
| WDH | Waterdrop | | Financials | 1.90 | 60 | 0.00% | 64.46% |
| YRD | Yiren Digital | | Financials | 5.98 | 50 | 1.36% | 23.30% |
| QD | Qudian | | Financials | 4.12 | 30 | -0.72% | 47.14% |
| YIN | Yintech | | Financials | 4.66 | 70 | -0.85% | 0.00% |
| XYF | X Financial | | Financials | 14.68 | 60 | 4.78% | 77.13% |
| PUYI | Puyi | | Financials | 9.00 | 50 | 0.00% | 0.00% |
| WINS | Wins Finance | | Financials | 7.19 | 70 | -0.69% | 0.00% |
| LEJU | Leju | | Financials | 7.03 | 70 | -3.43% | 0.00% |
| SWIN | Solowin | | Financials | 2.87 | 50 | 7.49% | 43.86% |
| MATH | Metalpha | | Financials | 3.35 | 70 | -0.59% | 196.46% |
| NCTY | The9 | | Financials | 10.02 | 50 | -6.79% | -33.02% |
| SRL | Scully Royalty | | Financials | 5.30 | 60 | -0.78% | -35.97% |
| ATIF | ATIF | | Financials | 1.07 | 30 | -0.47% | -23.75% |
| For chart view version of above stock list: Chart View ➞ 0 - 25 , 25 - 50 | ||
 | Click To Change The Sort Order: By Market Cap or Company Size Performance: Year-to-date, Week and Day |  |
|
Get the most comprehensive stock market coverage daily at 12Stocks.com ➞ Best Stocks Today ➞ Best Stocks Weekly ➞ Best Stocks Year-to-Date ➞ Best Stocks Trends ➞  Best Stocks Today 12Stocks.com Best Nasdaq Stocks ➞ Best S&P 500 Stocks ➞ Best Tech Stocks ➞ Best Biotech Stocks ➞ |
| Detailed Overview of China Stocks |
| China Technical Overview, Leaders & Laggards, Top China ETF Funds & Detailed China Stocks List, Charts, Trends & More |
| China: Technical Analysis, Trends & YTD Performance | |
 FXI Weekly Chart |
|
| Long Term Trend: Very Good | |
| Medium Term Trend: Very Good | |
 FXI Daily Chart |
|
| Short Term Trend: Good | |
| Overall Trend Score: 70 | |
| YTD Performance: 37.6045% | |
| **Trend Scores & Views Are Only For Educational Purposes And Not For Investing | |
| 12Stocks.com: Investing in China Index using Exchange Traded Funds | |
|
The following table shows list of key exchange traded funds (ETF) that
help investors play China stock market. For detailed view, check out our ETF Funds section of our website. Quick View: Move mouse or cursor over ETF symbol (ticker) to view short-term technical chart and over ETF name to view long term chart. Click on ticker or stock name for detailed view. Click on to add stock symbol to your watchlist and to view watchlist. |
12Stocks.com List of ETFs that track China Index
| Ticker | ETF Name | Watchlist | Recent Price | Smart Investing & Trading Score | Change % | Week % | Year-to-date % |
| QQQC | China Technology | | 116.80 | 70 | -0.0513435 | 5.72049 | 0% |
| YAO | China All-Cap | | 54.77 | 60 | -0.327571 | 1.44471 | 0% |
| CN | All China Eq | | 23.67 | 30 | 0 | 0 | 0% |
| CYB | Chinese Yuan | | 11.27 | 40 | 3.67985 | -53.5591 | 0% |
| 12Stocks.com: Charts, Trends, Fundamental Data and Performances of China Stocks | |
|
We now take in-depth look at all China stocks including charts, multi-period performances and overall trends (as measured by Smart Investing & Trading Score). One can sort China stocks (click link to choose) by Daily, Weekly and by Year-to-Date performances. Also, one can sort by size of the company or by market capitalization. |
| Select Your Default Chart Type: | |||||
| |||||
| Click on stock symbol or name for detailed view. Click on to add stock symbol to your watchlist and to view watchlist. Quick View: Move mouse or cursor over "Daily" to quickly view daily technical stock chart and over "Weekly" to view weekly technical stock chart. | |||||

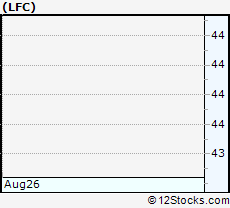 | LFC China Life Insurance Company Limited |
| Sector: Financials | |
| SubSector: Life Insurance | |
| MarketCap: 92028.5 Millions | |
| Recent Price: 43.74 Smart Investing & Trading Score: 80 | |
| Day Percent Change: -0.364465% Day Change: -9999 | |
| Week Change: 690.958% Year-to-date Change: 0.0% | |
| LFC Links: Profile News Message Board | |
| Charts:- Daily , Weekly | |
| Add LFC to Watchlist: View: Get Complete LFC Trend Analysis ➞ | |
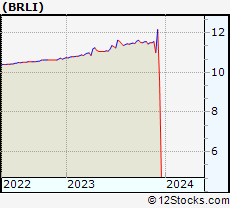 | BRLI Brilliant Acquisition Corporation |
| Sector: Financials | |
| SubSector: SPAC | |
| MarketCap: 60157 Millions | |
| Recent Price: 4.70 Smart Investing & Trading Score: 10 | |
| Day Percent Change: 0% Day Change: -9999 | |
| Week Change: 0% Year-to-date Change: 0.0% | |
| BRLI Links: Profile News Message Board | |
| Charts:- Daily , Weekly | |
| Add BRLI to Watchlist: View: Get Complete BRLI Trend Analysis ➞ | |
 | BEKE KE Holdings Inc ADR |
| Sector: Financials | |
| SubSector: Real Estate Services | |
| MarketCap: 20791.6 Millions | |
| Recent Price: 20.36 Smart Investing & Trading Score: 100 | |
| Day Percent Change: 1.85093% Day Change: -0.04 | |
| Week Change: 2.26017% Year-to-date Change: 16.4% | |
| BEKE Links: Profile News Message Board | |
| Charts:- Daily , Weekly | |
| Add BEKE to Watchlist: View: Get Complete BEKE Trend Analysis ➞ | |
 | QFIN Qfin Holdings Inc. ADR |
| Sector: Financials | |
| SubSector: Credit Services | |
| MarketCap: 3718.52 Millions | |
| Recent Price: 30.76 Smart Investing & Trading Score: 70 | |
| Day Percent Change: 6.65742% Day Change: 0.99 | |
| Week Change: 8.42439% Year-to-date Change: -19.0% | |
| QFIN Links: Profile News Message Board | |
| Charts:- Daily , Weekly | |
| Add QFIN to Watchlist: View: Get Complete QFIN Trend Analysis ➞ | |
 | LU Lufax Holding Ltd ADR |
| Sector: Financials | |
| SubSector: Credit Services | |
| MarketCap: 2522.68 Millions | |
| Recent Price: 3.14 Smart Investing & Trading Score: 80 | |
| Day Percent Change: 5.72391% Day Change: 0.15 | |
| Week Change: 4.31894% Year-to-date Change: 31.4% | |
| LU Links: Profile News Message Board | |
| Charts:- Daily , Weekly | |
| Add LU to Watchlist: View: Get Complete LU Trend Analysis ➞ | |
 | FANH Fanhua Inc. |
| Sector: Financials | |
| SubSector: Insurance Brokers | |
| MarketCap: 1436.67 Millions | |
| Recent Price: 1.51 Smart Investing & Trading Score: 10 | |
| Day Percent Change: -1.30719% Day Change: -9999 | |
| Week Change: -7.92683% Year-to-date Change: 0.0% | |
| FANH Links: Profile News Message Board | |
| Charts:- Daily , Weekly | |
| Add FANH to Watchlist: View: Get Complete FANH Trend Analysis ➞ | |
 | FINV FinVolution Group ADR |
| Sector: Financials | |
| SubSector: Credit Services | |
| MarketCap: 1107.95 Millions | |
| Recent Price: 7.97 Smart Investing & Trading Score: 50 | |
| Day Percent Change: 4.31937% Day Change: 0.48 | |
| Week Change: 1.78799% Year-to-date Change: 22.0% | |
| FINV Links: Profile News Message Board | |
| Charts:- Daily , Weekly | |
| Add FINV to Watchlist: View: Get Complete FINV Trend Analysis ➞ | |
 | CANG Cango Inc ADR |
| Sector: Financials | |
| SubSector: Capital Markets | |
| MarketCap: 868.19 Millions | |
| Recent Price: 4.49 Smart Investing & Trading Score: 10 | |
| Day Percent Change: -1.53509% Day Change: 0.1 | |
| Week Change: -7.42268% Year-to-date Change: -10.6% | |
| CANG Links: Profile News Message Board | |
| Charts:- Daily , Weekly | |
| Add CANG to Watchlist: View: Get Complete CANG Trend Analysis ➞ | |
 | LX LexinFintech Holdings Ltd ADR |
| Sector: Financials | |
| SubSector: Credit Services | |
| MarketCap: 807.47 Millions | |
| Recent Price: 5.86 Smart Investing & Trading Score: 50 | |
| Day Percent Change: 3.16901% Day Change: 0.17 | |
| Week Change: -2.33333% Year-to-date Change: 3.2% | |
| LX Links: Profile News Message Board | |
| Charts:- Daily , Weekly | |
| Add LX to Watchlist: View: Get Complete LX Trend Analysis ➞ | |
 | NOAH Noah Holdings Ltd ADR |
| Sector: Financials | |
| SubSector: Asset Management | |
| MarketCap: 805.6 Millions | |
| Recent Price: 11.65 Smart Investing & Trading Score: 20 | |
| Day Percent Change: 0.778547% Day Change: 0.07 | |
| Week Change: -3.2392% Year-to-date Change: 14.5% | |
| NOAH Links: Profile News Message Board | |
| Charts:- Daily , Weekly | |
| Add NOAH to Watchlist: View: Get Complete NOAH Trend Analysis ➞ | |
 | WDH Waterdrop Inc ADR |
| Sector: Financials | |
| SubSector: Insurance - Diversified | |
| MarketCap: 509.46 Millions | |
| Recent Price: 1.90 Smart Investing & Trading Score: 60 | |
| Day Percent Change: 0% Day Change: -0.01 | |
| Week Change: 2.15054% Year-to-date Change: 64.5% | |
| WDH Links: Profile News Message Board | |
| Charts:- Daily , Weekly | |
| Add WDH to Watchlist: View: Get Complete WDH Trend Analysis ➞ | |
 | YRD Yiren Digital Ltd ADR |
| Sector: Financials | |
| SubSector: Credit Services | |
| MarketCap: 495.13 Millions | |
| Recent Price: 5.98 Smart Investing & Trading Score: 50 | |
| Day Percent Change: 1.35593% Day Change: 0.21 | |
| Week Change: 3.28152% Year-to-date Change: 23.3% | |
| YRD Links: Profile News Message Board | |
| Charts:- Daily , Weekly | |
| Add YRD to Watchlist: View: Get Complete YRD Trend Analysis ➞ | |
 | QD Qudian Inc ADR |
| Sector: Financials | |
| SubSector: Credit Services | |
| MarketCap: 451.28 Millions | |
| Recent Price: 4.12 Smart Investing & Trading Score: 30 | |
| Day Percent Change: -0.722892% Day Change: -0.19 | |
| Week Change: -2.60047% Year-to-date Change: 47.1% | |
| QD Links: Profile News Message Board | |
| Charts:- Daily , Weekly | |
| Add QD to Watchlist: View: Get Complete QD Trend Analysis ➞ | |
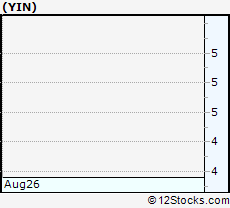 | YIN Yintech Investment Holdings Limited |
| Sector: Financials | |
| SubSector: Investment Brokerage - National | |
| MarketCap: 441.905 Millions | |
| Recent Price: 4.66 Smart Investing & Trading Score: 70 | |
| Day Percent Change: -0.851064% Day Change: -9999 | |
| Week Change: 33.908% Year-to-date Change: 0.0% | |
| YIN Links: Profile News Message Board | |
| Charts:- Daily , Weekly | |
| Add YIN to Watchlist: View: Get Complete YIN Trend Analysis ➞ | |
 | XYF X Financial ADR |
| Sector: Financials | |
| SubSector: Credit Services | |
| MarketCap: 368.36 Millions | |
| Recent Price: 14.68 Smart Investing & Trading Score: 60 | |
| Day Percent Change: 4.7823% Day Change: 2.01 | |
| Week Change: 6.06936% Year-to-date Change: 77.1% | |
| XYF Links: Profile News Message Board | |
| Charts:- Daily , Weekly | |
| Add XYF to Watchlist: View: Get Complete XYF Trend Analysis ➞ | |
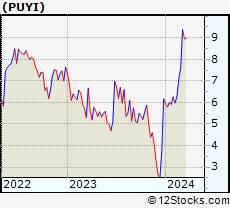 | PUYI Puyi Inc. |
| Sector: Financials | |
| SubSector: Asset Management | |
| MarketCap: 320.803 Millions | |
| Recent Price: 9.00 Smart Investing & Trading Score: 50 | |
| Day Percent Change: 0% Day Change: -9999 | |
| Week Change: 0.559783% Year-to-date Change: 0.0% | |
| PUYI Links: Profile News Message Board | |
| Charts:- Daily , Weekly | |
| Add PUYI to Watchlist: View: Get Complete PUYI Trend Analysis ➞ | |
 | WINS Wins Finance Holdings Inc. |
| Sector: Financials | |
| SubSector: Asset Management | |
| MarketCap: 226.903 Millions | |
| Recent Price: 7.19 Smart Investing & Trading Score: 70 | |
| Day Percent Change: -0.690608% Day Change: -9999 | |
| Week Change: 4.9635% Year-to-date Change: 0.0% | |
| WINS Links: Profile News Message Board | |
| Charts:- Daily , Weekly | |
| Add WINS to Watchlist: View: Get Complete WINS Trend Analysis ➞ | |
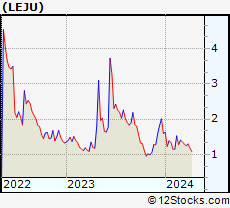 | LEJU Leju Holdings Limited |
| Sector: Financials | |
| SubSector: Property Management | |
| MarketCap: 226.042 Millions | |
| Recent Price: 7.03 Smart Investing & Trading Score: 70 | |
| Day Percent Change: -3.43407% Day Change: -9999 | |
| Week Change: 539.091% Year-to-date Change: 0.0% | |
| LEJU Links: Profile News Message Board | |
| Charts:- Daily , Weekly | |
| Add LEJU to Watchlist: View: Get Complete LEJU Trend Analysis ➞ | |
 | SWIN Solowin Holdings |
| Sector: Financials | |
| SubSector: Capital Markets | |
| MarketCap: 155.27 Millions | |
| Recent Price: 2.87 Smart Investing & Trading Score: 50 | |
| Day Percent Change: 7.49064% Day Change: -0.09 | |
| Week Change: 7.89474% Year-to-date Change: 43.9% | |
| SWIN Links: Profile News Message Board | |
| Charts:- Daily , Weekly | |
| Add SWIN to Watchlist: View: Get Complete SWIN Trend Analysis ➞ | |
 | MATH Metalpha Technology Holding Ltd |
| Sector: Financials | |
| SubSector: Capital Markets | |
| MarketCap: 129.55 Millions | |
| Recent Price: 3.35 Smart Investing & Trading Score: 70 | |
| Day Percent Change: -0.593472% Day Change: -0.06 | |
| Week Change: 0.903614% Year-to-date Change: 196.5% | |
| MATH Links: Profile News Message Board | |
| Charts:- Daily , Weekly | |
| Add MATH to Watchlist: View: Get Complete MATH Trend Analysis ➞ | |
 | NCTY The9 Limited ADR |
| Sector: Financials | |
| SubSector: Capital Markets | |
| MarketCap: 118.27 Millions | |
| Recent Price: 10.02 Smart Investing & Trading Score: 50 | |
| Day Percent Change: -6.7907% Day Change: 0.17 | |
| Week Change: -2.33918% Year-to-date Change: -33.0% | |
| NCTY Links: Profile News Message Board | |
| Charts:- Daily , Weekly | |
| Add NCTY to Watchlist: View: Get Complete NCTY Trend Analysis ➞ | |
 | SRL Scully Royalty Ltd |
| Sector: Financials | |
| SubSector: Capital Markets | |
| MarketCap: 80.78 Millions | |
| Recent Price: 5.30 Smart Investing & Trading Score: 60 | |
| Day Percent Change: -0.776935% Day Change: 0 | |
| Week Change: 0.409215% Year-to-date Change: -36.0% | |
| SRL Links: Profile News Message Board | |
| Charts:- Daily , Weekly | |
| Add SRL to Watchlist: View: Get Complete SRL Trend Analysis ➞ | |
 | ATIF ATIF Holdings Limited |
| Sector: Financials | |
| SubSector: Asset Management | |
| MarketCap: 68.5203 Millions | |
| Recent Price: 1.07 Smart Investing & Trading Score: 30 | |
| Day Percent Change: -0.465116% Day Change: -9999 | |
| Week Change: 7% Year-to-date Change: -23.7% | |
| ATIF Links: Profile News Message Board | |
| Charts:- Daily , Weekly | |
| Add ATIF to Watchlist: View: Get Complete ATIF Trend Analysis ➞ | |
| For tabular summary view of above stock list: Summary View ➞ 0 - 25 , 25 - 50 | ||
| Click To Change The Sort Order: By Market Cap or Company Size Performance: Year-to-date, Week and Day | |
| Select Chart Type: | ||
|
Best Stocks Today 12Stocks.com |
© 2025 12Stocks.com Terms & Conditions Privacy Contact Us
All Information Provided Only For Education And Not To Be Used For Investing or Trading. See Terms & Conditions


One More Thing ... Get Best Stocks Delivered Daily!
Never Ever Miss A Move With Our Top Ten Stocks Lists
Find Best Stocks In Any Market - Bull or Bear Market
Take A Peek At Our Top Ten Stocks Lists: Daily, Weekly, Year-to-Date & Top Trends
Find Best Stocks In Any Market - Bull or Bear Market
Take A Peek At Our Top Ten Stocks Lists: Daily, Weekly, Year-to-Date & Top Trends
China Stocks With Best Up Trends [0-bearish to 100-bullish]: Xunlei [100], GDS [100], NIO [100], Kingsoft Cloud[100], H World[100], Vipshop [100], VNET [100], Bilibili [100], KE [100], China [100], Weibo Corp[100]
Best China Stocks Year-to-Date:
Regencell Bioscience[12202.8%], So-Young [395.711%], Xunlei [288.571%], QuantaSing [269.91%], Oneconnect Financial[194.239%], Yatsen Holding[159.896%], Niu [154.023%], Masterbeef [138.293%], Tencent Music[132.862%], HUYA [106.054%], VNET [94.664%] Best China Stocks This Week:
CNOOC [137266%], Nam Tai[5033.33%], Fang [4150%], Sinopec Shanghai[1992.58%], PetroChina [1137.09%], China [1104.2%], China Life[690.958%], Leju [539.091%], Aluminum [516.255%], Global Cord[335.132%], eHi Car[175.244%] Best China Stocks Daily:
Xunlei [11.6279%], Regencell Bioscience[9.01468%], Uxin [8.28221%], Jianpu [7.78054%], GDS [7.55627%], Solowin [7.49064%], Niu [7.02179%], Qfin [6.65742%], NIO [6.12536%], Lufax Holding[5.72391%], Kingsoft Cloud[5.35492%]