
 Login Sign Up


| |||||
 |  | ||||

| 12Stocks.com Market Intelligence |
Best China Stocks
|
On this page, you will find the most comprehensive analysis of Chinese stocks and ETFs - from latest trends to performances to charts ➞. First, here are the year-to-date (YTD) performances of the most requested China stocks at 12Stocks.com (click stock for review):
| Alibaba 97% | ||
| NetEase 85% | ||
| Baidu 67% | ||
| Weibo Corp 54% | ||
| Vipshop 50% | ||
| Sohu.com . 23% | ||
| JOYY 20% | ||
| JD.com 6% | ||
| Aluminum 0% | ||
| China Eastern 0% | ||
| CNOOC 0% | ||
| China Mobile 0% | ||
| Ctrip.com 0% | ||
| 51job 0% | ||
| Michael Kors 0% | ||
| China Life 0% | ||
| Melco Crown 0% | ||
| PetroChina 0% | ||
| SINA 0% | ||
| 58.com 0% | ||
| New Oriental -12% | ||
| In a hurry? China Stocks Lists: Performance Trends Table, Stock Charts
Sort China stocks: Daily, Weekly, Year-to-Date, Market Cap & Trends. Filter China stocks list by sector: Show all, Tech, Finance, Energy, Staples, Retail, Industrial, Materials, Utilities and HealthCare Filter China stocks list by size: All China Large Medium Small and MicroCap |
| September 18, 2025 - 12Stocks.com China Stocks Performances & Trends Daily | |||||||||
|
|  The overall Smart Investing & Trading Score is 100 (0-bearish to 100-bullish) which puts China index in short term bullish trend. The Smart Investing & Trading Score from previous trading session is 60 and an improvement of trend continues.
| ||||||||
Here are the Smart Investing & Trading Scores of the most requested China stocks at 12Stocks.com (click stock name for detailed review):
|

| 12Stocks.com: Top Performing China Index Stocks | |||||||||||||||||||||||||||||||||||||||||||||||
 The top performing China Index stocks year to date are
Now, more recently, over last week, the top performing China Index stocks on the move are


|
|||||||||||||||||||||||||||||||||||||||||||||||
| 12Stocks.com: Investing in China Index with Stocks | |
|
The following table helps investors and traders sort through current performance and trends (as measured by Smart Investing & Trading Score) of various
stocks in the China Index. Quick View: Move mouse or cursor over stock symbol (ticker) to view short-term technical chart and over stock name to view long term chart. Click on  to add stock symbol to your watchlist and to add stock symbol to your watchlist and  to view watchlist. Click on any ticker or stock name for detailed market intelligence report for that stock. to view watchlist. Click on any ticker or stock name for detailed market intelligence report for that stock. |
12Stocks.com Performance of Stocks in China Index
| Ticker | Stock Name | Watchlist | Category | Recent Price | Smart Investing & Trading Score | Change % | YTD Change% |
| PTR | PetroChina |   | Energy | 521.31 | 70 | 0.60% | 0.00% |
| SNP | China | | Energy | 510.10 | 100 | 1.35% | 0.00% |
| CEO | CNOOC | | Energy | 903.87 | 70 | 1.82% | 0.00% |
| SHI | Sinopec Shanghai | | Energy | 273.71 | 80 | 0.16% | 0.00% |
| RCON | Recon | | Energy | 2.04 | 30 | -3.57% | -4.91% |
| For chart view version of above stock list: Chart View ➞ 0 - 25 | ||
 | Click To Change The Sort Order: By Market Cap or Company Size Performance: Year-to-date, Week and Day |  |
|
Get the most comprehensive stock market coverage daily at 12Stocks.com ➞ Best Stocks Today ➞ Best Stocks Weekly ➞ Best Stocks Year-to-Date ➞ Best Stocks Trends ➞  Best Stocks Today 12Stocks.com Best Nasdaq Stocks ➞ Best S&P 500 Stocks ➞ Best Tech Stocks ➞ Best Biotech Stocks ➞ |
| Detailed Overview of China Stocks |
| China Technical Overview, Leaders & Laggards, Top China ETF Funds & Detailed China Stocks List, Charts, Trends & More |
| China: Technical Analysis, Trends & YTD Performance | |
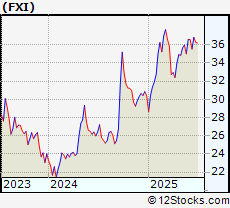
 FXI Weekly Chart |
|
| Long Term Trend: Very Good | |
| Medium Term Trend: Very Good | |
 FXI Daily Chart |
|
| Short Term Trend: Very Good | |
| Overall Trend Score: 100 | |
| YTD Performance: 39.2439% | |
| **Trend Scores & Views Are Only For Educational Purposes And Not For Investing | |
| 12Stocks.com: Investing in China Index using Exchange Traded Funds | |
|
The following table shows list of key exchange traded funds (ETF) that
help investors play China stock market. For detailed view, check out our ETF Funds section of our website. Quick View: Move mouse or cursor over ETF symbol (ticker) to view short-term technical chart and over ETF name to view long term chart. Click on ticker or stock name for detailed view. Click on to add stock symbol to your watchlist and to view watchlist. |
12Stocks.com List of ETFs that track China Index
| Ticker | ETF Name | Watchlist | Recent Price | Smart Investing & Trading Score | Change % | Week % | Year-to-date % |
| QQQC | China Technology | | 116.80 | 70 | -0.0513435 | 5.72049 | 0% |
| YAO | China All-Cap | | 54.77 | 60 | -0.327571 | 1.44471 | 0% |
| CN | All China Eq | | 23.67 | 30 | 0 | 0 | 0% |
| CYB | Chinese Yuan | | 11.27 | 40 | 3.67985 | -53.5591 | 0% |
| 12Stocks.com: Charts, Trends, Fundamental Data and Performances of China Stocks | |
|
We now take in-depth look at all China stocks including charts, multi-period performances and overall trends (as measured by Smart Investing & Trading Score). One can sort China stocks (click link to choose) by Daily, Weekly and by Year-to-Date performances. Also, one can sort by size of the company or by market capitalization. |
| Select Your Default Chart Type: | |||||
| |||||
| Click on stock symbol or name for detailed view. Click on to add stock symbol to your watchlist and to view watchlist. Quick View: Move mouse or cursor over "Daily" to quickly view daily technical stock chart and over "Weekly" to view weekly technical stock chart. | |||||

 | PTR PetroChina Company Limited |
| Sector: Energy | |
| SubSector: Major Integrated Oil & Gas | |
| MarketCap: 119480 Millions | |
| Recent Price: 521.31 Smart Investing & Trading Score: 70 | |
| Day Percent Change: 0.596272% Day Change: -9999 | |
| Week Change: 1137.09% Year-to-date Change: 0.0% | |
| PTR Links: Profile News Message Board | |
| Charts:- Daily , Weekly | |
| Add PTR to Watchlist: View: Get Complete PTR Trend Analysis ➞ | |
 | SNP China Petroleum & Chemical Corporation |
| Sector: Energy | |
| SubSector: Major Integrated Oil & Gas | |
| MarketCap: 74664.2 Millions | |
| Recent Price: 510.10 Smart Investing & Trading Score: 100 | |
| Day Percent Change: 1.34504% Day Change: -9999 | |
| Week Change: 1104.2% Year-to-date Change: 0.0% | |
| SNP Links: Profile News Message Board | |
| Charts:- Daily , Weekly | |
| Add SNP to Watchlist: View: Get Complete SNP Trend Analysis ➞ | |
 | CEO CNOOC Limited |
| Sector: Energy | |
| SubSector: Oil & Gas Drilling & Exploration | |
| MarketCap: 44343.2 Millions | |
| Recent Price: 903.87 Smart Investing & Trading Score: 70 | |
| Day Percent Change: 1.82041% Day Change: -9999 | |
| Week Change: 137266% Year-to-date Change: 0.0% | |
| CEO Links: Profile News Message Board | |
| Charts:- Daily , Weekly | |
| Add CEO to Watchlist: View: Get Complete CEO Trend Analysis ➞ | |
 | SHI Sinopec Shanghai Petrochemical Company Limited |
| Sector: Energy | |
| SubSector: Oil & Gas Refining & Marketing | |
| MarketCap: 5411.84 Millions | |
| Recent Price: 273.71 Smart Investing & Trading Score: 80 | |
| Day Percent Change: 0.164678% Day Change: -9999 | |
| Week Change: 1992.58% Year-to-date Change: 0.0% | |
| SHI Links: Profile News Message Board | |
| Charts:- Daily , Weekly | |
| Add SHI to Watchlist: View: Get Complete SHI Trend Analysis ➞ | |
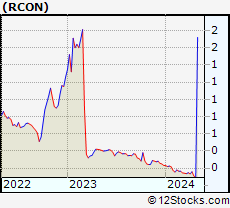 | RCON Recon Technology Ltd |
| Sector: Energy | |
| SubSector: Oil & Gas Equipment & Services | |
| MarketCap: 60.64 Millions | |
| Recent Price: 2.04 Smart Investing & Trading Score: 30 | |
| Day Percent Change: -3.56604% Day Change: 0.06 | |
| Week Change: 5.38144% Year-to-date Change: -4.9% | |
| RCON Links: Profile News Message Board | |
| Charts:- Daily , Weekly | |
| Add RCON to Watchlist: View: Get Complete RCON Trend Analysis ➞ | |
| For tabular summary view of above stock list: Summary View ➞ 0 - 25 | ||
| Click To Change The Sort Order: By Market Cap or Company Size Performance: Year-to-date, Week and Day | |
| Select Chart Type: | ||
|
Best Stocks Today 12Stocks.com |
© 2025 12Stocks.com Terms & Conditions Privacy Contact Us
All Information Provided Only For Education And Not To Be Used For Investing or Trading. See Terms & Conditions


One More Thing ... Get Best Stocks Delivered Daily!
Never Ever Miss A Move With Our Top Ten Stocks Lists
Find Best Stocks In Any Market - Bull or Bear Market
Take A Peek At Our Top Ten Stocks Lists: Daily, Weekly, Year-to-Date & Top Trends
Find Best Stocks In Any Market - Bull or Bear Market
Take A Peek At Our Top Ten Stocks Lists: Daily, Weekly, Year-to-Date & Top Trends
China Stocks With Best Up Trends [0-bearish to 100-bullish]: Xunlei [100], Baidu [100], GDS [100], NIO [100], Kingsoft Cloud[100], PDD [100], H World[100], Vipshop [100], VNET [100], Alibaba [100], Bilibili [100]
Best China Stocks Year-to-Date:
Regencell Bioscience[12202.8%], So-Young [395.711%], Xunlei [288.571%], QuantaSing [269.91%], Oneconnect Financial[194.239%], Yatsen Holding[159.896%], Niu [154.023%], Masterbeef [138.293%], Tencent Music[132.862%], HUYA [106.054%], Alibaba [97.1659%] Best China Stocks This Week:
CNOOC [137266%], Nam Tai[5033.33%], Fang [4150%], Sinopec Shanghai[1992.58%], PetroChina [1137.09%], China [1104.2%], China Life[690.958%], Leju [539.091%], Aluminum [516.255%], Global Cord[335.132%], eHi Car[175.244%] Best China Stocks Daily:
Xunlei [11.6279%], Baidu [11.3418%], Regencell Bioscience[9.01468%], Uxin [8.28221%], Jianpu [7.78054%], GDS [7.55627%], Solowin [7.49064%], Niu [7.02179%], Qfin [6.65742%], NIO [6.12536%], Lufax Holding[5.72391%]