
 Login Sign Up


| |||||
 |  | ||||

| 12Stocks.com Market Intelligence |
Best Financial Stocks
| In a hurry? Financial Stocks Lists: Performance Trends Table, Stock Charts
Sort Financial stocks: Daily, Weekly, Year-to-Date, Market Cap & Trends. Filter Financial stocks list by size:All Financial Large Mid-Range Small & MicroCap |
| 12Stocks.com Financial Stocks Performances & Trends Daily | |||||||||
|
|  The overall Smart Investing & Trading Score is 95 (0-bearish to 100-bullish) which puts Financial sector in short term bullish trend. The Smart Investing & Trading Score from previous trading session is 100 and a deterioration of trend continues.
| ||||||||
Here are the Smart Investing & Trading Scores of the most requested Financial stocks at 12Stocks.com (click stock name for detailed review):
|


| 12Stocks.com: Investing in Financial sector with Stocks | |
|
The following table helps investors and traders sort through current performance and trends (as measured by Smart Investing & Trading Score) of various
stocks in the Financial sector. Quick View: Move mouse or cursor over stock symbol (ticker) to view short-term Technical chart and over stock name to view long term chart. Click on  to add stock symbol to your watchlist and to add stock symbol to your watchlist and  to view watchlist. Click on any ticker or stock name for detailed market intelligence report for that stock. to view watchlist. Click on any ticker or stock name for detailed market intelligence report for that stock. |
12Stocks.com Performance of Stocks in Financial Sector
| Ticker | Stock Name | Watchlist | Category | Recent Price | Smart Investing & Trading Score | Change % | Weekly Change% |
| TSBK | Timberland Bancorp |   | S&L | 26.13 | 80 | 0.56% | 0.02% |
| UNM | Unum | | Insurance | 53.09 | 83 | 0.61% | 0.00% |
| FBP | First Ban | | Foreign Banks | 18.09 | 68 | 0.22% | 0.00% |
| GBBK | Global Blockchain | | SPAC | 10.87 | 41 | 0.00% | 0.00% |
| MCBC | Macatawa Bank | | Regional Banks | 14.48 | 88 | 0.35% | 0.00% |
| USA | Liberty All-Star | | Closed-End Fund - Equity | 6.80 | 28 | 0.00% | 0.00% |
| RFI | Cohen & Steers Total Return Realty Fund | | Closed-End Fund - Equity | 11.65 | 50 | -1.19% | 0.00% |
| NXP | Nuveen Select | | Closed-End Fund - Debt | 14.35 | 33 | -0.28% | 0.00% |
| IIM | Invesco Value | | Closed-End Fund - Debt | 11.74 | 48 | 0.17% | 0.00% |
| PZC | PIMCO California | | Closed-End Fund - Debt | 7.20 | 25 | -0.41% | 0.00% |
| BLE | BlackRock Municipal | | Asset Mgmt | 10.62 | 52 | 0.00% | 0.00% |
| BYM | BlackRock Municipal | | Closed-End Fund - Debt | 11.20 | 42 | -0.40% | 0.00% |
| CM | Canadian Imperial | | Banks | 49.40 | 90 | 0.94% | 0.00% |
| NAZ | Nuveen Arizona | | Asset Mgmt | 10.87 | 70 | -0.09% | 0.00% |
| NNY | Nuveen New | | Closed-End Fund - Debt | 8.20 | 18 | -0.12% | 0.00% |
| PKBK | Parke Bancorp | | Regional Banks | 16.98 | 50 | -0.79% | 0.00% |
| SLRC | Solar Capital | | Investments | 16.21 | 83 | 0.31% | 0.00% |
| CNDA | Concord Acquisition | | SPAC | 10.59 | 50 | -0.14% | 0.00% |
| AJX | Great Ajax | | Mortgage | 3.59 | 57 | -1.91% | 0.00% |
| PVBC | Provident Bancorp | | Banks | 9.40 | 45 | 0.00% | 0.00% |
| DIAX | Nuveen Dow | | Closed-End Fund - Equity | 14.30 | 50 | -0.28% | 0.00% |
| ARDC | Ares Dynamic | | Asset Mgmt | 14.59 | 76 | 0.27% | 0.00% |
| ALCYU | Alchemy s | | SPAC | 10.70 | 44 | 0.00% | 0.00% |
| ALSA | Alpha Star | | SPAC | 11.40 | 34 | 0.00% | 0.00% |
| ISRLU | Israel Acquisitions | | SPAC | 10.88 | 23 | 0.00% | 0.00% |
| For chart view version of above stock list: Chart View ➞ 0 - 25 , 25 - 50 , 50 - 75 , 75 - 100 , 100 - 125 , 125 - 150 , 150 - 175 , 175 - 200 , 200 - 225 , 225 - 250 , 250 - 275 , 275 - 300 , 300 - 325 , 325 - 350 , 350 - 375 , 375 - 400 , 400 - 425 , 425 - 450 , 450 - 475 , 475 - 500 , 500 - 525 , 525 - 550 , 550 - 575 , 575 - 600 , 600 - 625 , 625 - 650 , 650 - 675 , 675 - 700 , 700 - 725 , 725 - 750 , 750 - 775 , 775 - 800 , 800 - 825 , 825 - 850 , 850 - 875 , 875 - 900 , 900 - 925 , 925 - 950 , 950 - 975 , 975 - 1000 , 1000 - 1025 , 1025 - 1050 , 1050 - 1075 , 1075 - 1100 , 1100 - 1125 , 1125 - 1150 , 1150 - 1175 , 1175 - 1200 , 1200 - 1225 | ||
 | Click To Change The Sort Order: By Market Cap or Company Size Performance: Year-to-date, Week and Day |  |
|
Get the most comprehensive stock market coverage daily at 12Stocks.com ➞ Best Stocks Today ➞ Best Stocks Weekly ➞ Best Stocks Year-to-Date ➞ Best Stocks Trends ➞  Best Stocks Today 12Stocks.com Best Nasdaq Stocks ➞ Best S&P 500 Stocks ➞ Best Tech Stocks ➞ Best Biotech Stocks ➞ |
| Detailed Overview of Financial Stocks |
| Financial Technical Overview, Leaders & Laggards, Top Financial ETF Funds & Detailed Financial Stocks List, Charts, Trends & More |
| Financial Sector: Technical Analysis, Trends & YTD Performance | |
| Financial sector is composed of stocks
from banks, brokers, insurance, REITs
and services subsectors. Financial sector, as represented by XLF, an exchange-traded fund [ETF] that holds basket of Financial stocks (e.g, Bank of America, Goldman Sachs) is up by 13.01% and is currently outperforming the overall market by 2.44% year-to-date. Below is a quick view of Technical charts and trends: |
|
 XLF Weekly Chart |
|
| Long Term Trend: Very Good | |
| Medium Term Trend: Very Good | |
 XLF Daily Chart |
|
| Short Term Trend: Very Good | |
| Overall Trend Score: 95 | |
| YTD Performance: 13.01% | |
| **Trend Scores & Views Are Only For Educational Purposes And Not For Investing | |
| 12Stocks.com: Top Performing Financial Sector Stocks | ||||||||||||||||||||||||||||||||||||||||||||||||
 The top performing Financial sector stocks year to date are
Now, more recently, over last week, the top performing Financial sector stocks on the move are


|
||||||||||||||||||||||||||||||||||||||||||||||||
| 12Stocks.com: Investing in Financial Sector using Exchange Traded Funds | |
|
The following table shows list of key exchange traded funds (ETF) that
help investors track Financial Index. For detailed view, check out our ETF Funds section of our website. Quick View: Move mouse or cursor over ETF symbol (ticker) to view short-term Technical chart and over ETF name to view long term chart. Click on ticker or stock name for detailed view. Click on to add stock symbol to your watchlist and to view watchlist. |
12Stocks.com List of ETFs that track Financial Index
| Ticker | ETF Name | Watchlist | Recent Price | Smart Investing & Trading Score | Change % | Week % | Year-to-date % |
| XLF | Financial | | 42.49 | 95 | 0.73 | 1.58 | 13.01% |
| IAI | Broker-Dealers & Secs | | 119.47 | 100 | 1.08 | 2.59 | 10.08% |
| IYF | Financials | | 96.85 | 95 | 0.43 | 1.73 | 13.39% |
| IYG | Financial Services | | 67.11 | 95 | 0.15 | 1.56 | 12.34% |
| KRE | Regional Banking | | 51.19 | 83 | 0.23 | 1.67 | -2.37% |
| IXG | Global Financials | | 88.72 | 88 | 0.21 | 1.41 | 12.91% |
| VFH | Financials | | 103.00 | 95 | 0.18 | 1.45 | 11.64% |
| KBE | Bank | | 47.93 | 83 | 0.44 | 1.25 | 4.15% |
| FAS | Financial Bull 3X | | 112.32 | 95 | 1.81 | 4.06 | 35.9% |
| FAZ | Financial Bear 3X | | 9.75 | 10 | -1.71 | -3.75 | -28.68% |
| UYG | Financials | | 68.54 | 100 | 1.23 | 2.77 | 24.17% |
| IAT | Regional Banks | | 43.42 | 76 | -0.26 | 1.02 | 3.78% |
| KIE | Insurance | | 51.83 | 100 | 0.88 | 1.09 | 14.62% |
| PSCF | SmallCap Financials | | 49.03 | 95 | 0.28 | 1.44 | -0.31% |
| EUFN | Europe Financials | | 24.13 | 95 | 0.67 | 2.51 | 15.12% |
| PGF | Financial Preferred | | 14.81 | 52 | -0.10 | 0.68 | 1.58% |
| 12Stocks.com: Charts, Trends, Fundamental Data and Performances of Financial Stocks | |
|
We now take in-depth look at all Financial stocks including charts, multi-period performances and overall trends (as measured by Smart Investing & Trading Score). One can sort Financial stocks (click link to choose) by Daily, Weekly and by Year-to-Date performances. Also, one can sort by size of the company or by market capitalization. |
| Select Your Default Chart Type: | |||||
| |||||
| Click on stock symbol or name for detailed view. Click on to add stock symbol to your watchlist and to view watchlist. Quick View: Move mouse or cursor over "Daily" to quickly view daily Technical stock chart and over "Weekly" to view weekly Technical stock chart. | |||||

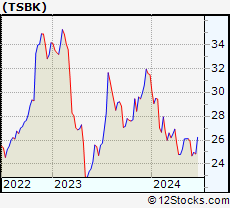 | TSBK Timberland Bancorp, Inc. |
| Sector: Financials | |
| SubSector: Savings & Loans | |
| MarketCap: 155.03 Millions | |
| Recent Price: 26.13 Smart Investing & Trading Score: 80 | |
| Day Percent Change: 0.56% Day Change: 0.14 | |
| Week Change: 0.02% Year-to-date Change: -17.0% | |
| TSBK Links: Profile News Message Board | |
| Charts:- Daily , Weekly | |
| Add TSBK to Watchlist: View: Get Complete TSBK Trend Analysis ➞ | |
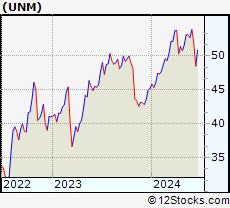 | UNM Unum Group |
| Sector: Financials | |
| SubSector: Accident & Health Insurance | |
| MarketCap: 2760.9 Millions | |
| Recent Price: 53.09 Smart Investing & Trading Score: 83 | |
| Day Percent Change: 0.61% Day Change: 0.32 | |
| Week Change: 0% Year-to-date Change: 17.4% | |
| UNM Links: Profile News Message Board | |
| Charts:- Daily , Weekly | |
| Add UNM to Watchlist: View: Get Complete UNM Trend Analysis ➞ | |
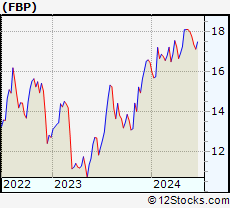 | FBP First BanCorp. |
| Sector: Financials | |
| SubSector: Foreign Regional Banks | |
| MarketCap: 913.079 Millions | |
| Recent Price: 18.09 Smart Investing & Trading Score: 68 | |
| Day Percent Change: 0.22% Day Change: 0.04 | |
| Week Change: 0% Year-to-date Change: 10.0% | |
| FBP Links: Profile News Message Board | |
| Charts:- Daily , Weekly | |
| Add FBP to Watchlist: View: Get Complete FBP Trend Analysis ➞ | |
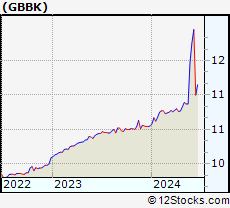 | GBBK Global Blockchain Acquisition Corp. |
| Sector: Financials | |
| SubSector: SPAC | |
| MarketCap: 231 Millions | |
| Recent Price: 10.87 Smart Investing & Trading Score: 41 | |
| Day Percent Change: 0.00% Day Change: 0.00 | |
| Week Change: 0% Year-to-date Change: 3.0% | |
| GBBK Links: Profile News Message Board | |
| Charts:- Daily , Weekly | |
| Add GBBK to Watchlist: View: Get Complete GBBK Trend Analysis ➞ | |
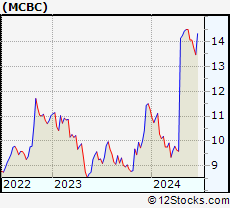 | MCBC Macatawa Bank Corporation |
| Sector: Financials | |
| SubSector: Regional - Midwest Banks | |
| MarketCap: 264.37 Millions | |
| Recent Price: 14.48 Smart Investing & Trading Score: 88 | |
| Day Percent Change: 0.35% Day Change: 0.05 | |
| Week Change: 0% Year-to-date Change: 28.4% | |
| MCBC Links: Profile News Message Board | |
| Charts:- Daily , Weekly | |
| Add MCBC to Watchlist: View: Get Complete MCBC Trend Analysis ➞ | |
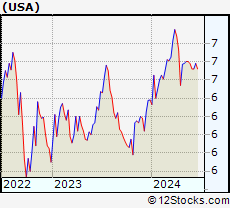 | USA Liberty All-Star Equity Fund |
| Sector: Financials | |
| SubSector: Closed-End Fund - Equity | |
| MarketCap: 839.547 Millions | |
| Recent Price: 6.80 Smart Investing & Trading Score: 28 | |
| Day Percent Change: 0.00% Day Change: 0.00 | |
| Week Change: 0% Year-to-date Change: 6.6% | |
| USA Links: Profile News Message Board | |
| Charts:- Daily , Weekly | |
| Add USA to Watchlist: View: Get Complete USA Trend Analysis ➞ | |
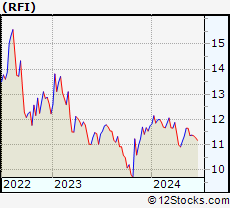 | RFI Cohen & Steers Total Return Realty Fund, Inc. |
| Sector: Financials | |
| SubSector: Closed-End Fund - Equity | |
| MarketCap: 221.147 Millions | |
| Recent Price: 11.65 Smart Investing & Trading Score: 50 | |
| Day Percent Change: -1.19% Day Change: -0.14 | |
| Week Change: 0% Year-to-date Change: -0.9% | |
| RFI Links: Profile News Message Board | |
| Charts:- Daily , Weekly | |
| Add RFI to Watchlist: View: Get Complete RFI Trend Analysis ➞ | |
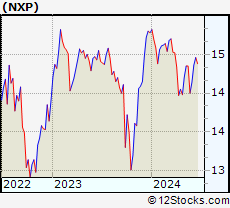 | NXP Nuveen Select Tax-Free Income Portfolio |
| Sector: Financials | |
| SubSector: Closed-End Fund - Debt | |
| MarketCap: 231.907 Millions | |
| Recent Price: 14.35 Smart Investing & Trading Score: 33 | |
| Day Percent Change: -0.28% Day Change: -0.04 | |
| Week Change: 0% Year-to-date Change: -2.9% | |
| NXP Links: Profile News Message Board | |
| Charts:- Daily , Weekly | |
| Add NXP to Watchlist: View: Get Complete NXP Trend Analysis ➞ | |
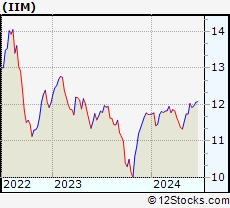 | IIM Invesco Value Municipal Income Trust |
| Sector: Financials | |
| SubSector: Closed-End Fund - Debt | |
| MarketCap: 587.207 Millions | |
| Recent Price: 11.74 Smart Investing & Trading Score: 48 | |
| Day Percent Change: 0.17% Day Change: 0.02 | |
| Week Change: 0% Year-to-date Change: 0.1% | |
| IIM Links: Profile News Message Board | |
| Charts:- Daily , Weekly | |
| Add IIM to Watchlist: View: Get Complete IIM Trend Analysis ➞ | |
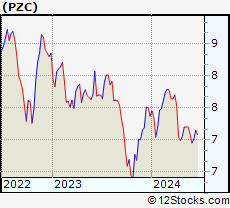 | PZC PIMCO California Municipal Income Fund III |
| Sector: Financials | |
| SubSector: Closed-End Fund - Debt | |
| MarketCap: 186.607 Millions | |
| Recent Price: 7.20 Smart Investing & Trading Score: 25 | |
| Day Percent Change: -0.41% Day Change: -0.03 | |
| Week Change: 0% Year-to-date Change: -2.3% | |
| PZC Links: Profile News Message Board | |
| Charts:- Daily , Weekly | |
| Add PZC to Watchlist: View: Get Complete PZC Trend Analysis ➞ | |
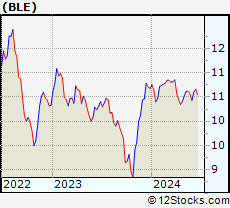 | BLE BlackRock Municipal Income Trust II |
| Sector: Financials | |
| SubSector: Asset Management | |
| MarketCap: 276.503 Millions | |
| Recent Price: 10.62 Smart Investing & Trading Score: 52 | |
| Day Percent Change: 0.00% Day Change: 0.00 | |
| Week Change: 0% Year-to-date Change: -0.6% | |
| BLE Links: Profile News Message Board | |
| Charts:- Daily , Weekly | |
| Add BLE to Watchlist: View: Get Complete BLE Trend Analysis ➞ | |
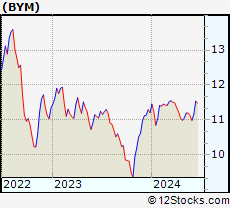 | BYM BlackRock Municipal Income Quality Trust |
| Sector: Financials | |
| SubSector: Closed-End Fund - Debt | |
| MarketCap: 306.507 Millions | |
| Recent Price: 11.20 Smart Investing & Trading Score: 42 | |
| Day Percent Change: -0.40% Day Change: -0.04 | |
| Week Change: 0% Year-to-date Change: -0.1% | |
| BYM Links: Profile News Message Board | |
| Charts:- Daily , Weekly | |
| Add BYM to Watchlist: View: Get Complete BYM Trend Analysis ➞ | |
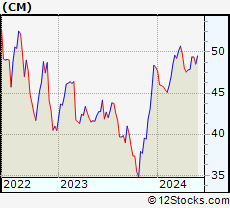 | CM Canadian Imperial Bank of Commerce |
| Sector: Financials | |
| SubSector: Money Center Banks | |
| MarketCap: 27150.5 Millions | |
| Recent Price: 49.40 Smart Investing & Trading Score: 90 | |
| Day Percent Change: 0.94% Day Change: 0.46 | |
| Week Change: 0% Year-to-date Change: 2.6% | |
| CM Links: Profile News Message Board | |
| Charts:- Daily , Weekly | |
| Add CM to Watchlist: View: Get Complete CM Trend Analysis ➞ | |
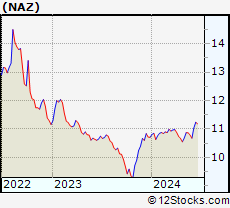 | NAZ Nuveen Arizona Quality Municipal Income Fund |
| Sector: Financials | |
| SubSector: Asset Management | |
| MarketCap: 146.903 Millions | |
| Recent Price: 10.87 Smart Investing & Trading Score: 70 | |
| Day Percent Change: -0.09% Day Change: -0.01 | |
| Week Change: 0% Year-to-date Change: 1.5% | |
| NAZ Links: Profile News Message Board | |
| Charts:- Daily , Weekly | |
| Add NAZ to Watchlist: View: Get Complete NAZ Trend Analysis ➞ | |
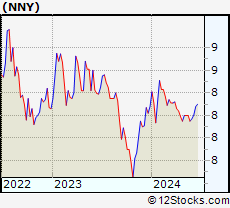 | NNY Nuveen New York Municipal Value Fund, Inc. |
| Sector: Financials | |
| SubSector: Closed-End Fund - Debt | |
| MarketCap: 130.607 Millions | |
| Recent Price: 8.20 Smart Investing & Trading Score: 18 | |
| Day Percent Change: -0.12% Day Change: -0.01 | |
| Week Change: 0% Year-to-date Change: -1.0% | |
| NNY Links: Profile News Message Board | |
| Charts:- Daily , Weekly | |
| Add NNY to Watchlist: View: Get Complete NNY Trend Analysis ➞ | |
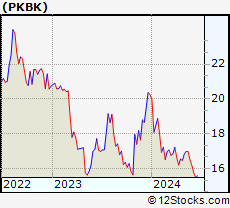 | PKBK Parke Bancorp, Inc. |
| Sector: Financials | |
| SubSector: Regional - Northeast Banks | |
| MarketCap: 165.799 Millions | |
| Recent Price: 16.98 Smart Investing & Trading Score: 50 | |
| Day Percent Change: -0.79% Day Change: -0.13 | |
| Week Change: 0% Year-to-date Change: -16.2% | |
| PKBK Links: Profile News Message Board | |
| Charts:- Daily , Weekly | |
| Add PKBK to Watchlist: View: Get Complete PKBK Trend Analysis ➞ | |
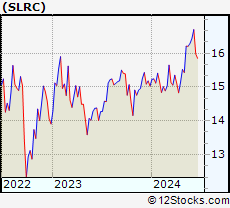 | SLRC Solar Capital Ltd. |
| Sector: Financials | |
| SubSector: Diversified Investments | |
| MarketCap: 412.87 Millions | |
| Recent Price: 16.21 Smart Investing & Trading Score: 83 | |
| Day Percent Change: 0.31% Day Change: 0.05 | |
| Week Change: 0% Year-to-date Change: 7.9% | |
| SLRC Links: Profile News Message Board | |
| Charts:- Daily , Weekly | |
| Add SLRC to Watchlist: View: Get Complete SLRC Trend Analysis ➞ | |
 | CNDA Concord Acquisition Corp II |
| Sector: Financials | |
| SubSector: SPAC | |
| MarketCap: 359 Millions | |
| Recent Price: 10.59 Smart Investing & Trading Score: 50 | |
| Day Percent Change: -0.14% Day Change: -0.01 | |
| Week Change: 0% Year-to-date Change: 2.0% | |
| CNDA Links: Profile News Message Board | |
| Charts:- Daily , Weekly | |
| Add CNDA to Watchlist: View: Get Complete CNDA Trend Analysis ➞ | |
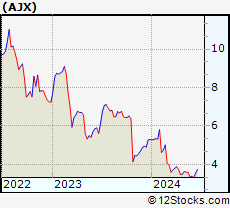 | AJX Great Ajax Corp. |
| Sector: Financials | |
| SubSector: Mortgage Investment | |
| MarketCap: 154.539 Millions | |
| Recent Price: 3.59 Smart Investing & Trading Score: 57 | |
| Day Percent Change: -1.91% Day Change: -0.07 | |
| Week Change: 0% Year-to-date Change: -32.3% | |
| AJX Links: Profile News Message Board | |
| Charts:- Daily , Weekly | |
| Add AJX to Watchlist: View: Get Complete AJX Trend Analysis ➞ | |
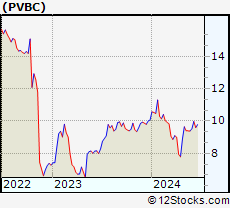 | PVBC Provident Bancorp, Inc. |
| Sector: Financials | |
| SubSector: Money Center Banks | |
| MarketCap: 168.599 Millions | |
| Recent Price: 9.40 Smart Investing & Trading Score: 45 | |
| Day Percent Change: 0.00% Day Change: 0.00 | |
| Week Change: 0% Year-to-date Change: -6.7% | |
| PVBC Links: Profile News Message Board | |
| Charts:- Daily , Weekly | |
| Add PVBC to Watchlist: View: Get Complete PVBC Trend Analysis ➞ | |
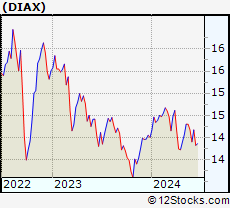 | DIAX Nuveen Dow 30 Dynamic Overwrite Fund |
| Sector: Financials | |
| SubSector: Closed-End Fund - Equity | |
| MarketCap: 379.747 Millions | |
| Recent Price: 14.30 Smart Investing & Trading Score: 50 | |
| Day Percent Change: -0.28% Day Change: -0.04 | |
| Week Change: 0% Year-to-date Change: 2.1% | |
| DIAX Links: Profile News Message Board | |
| Charts:- Daily , Weekly | |
| Add DIAX to Watchlist: View: Get Complete DIAX Trend Analysis ➞ | |
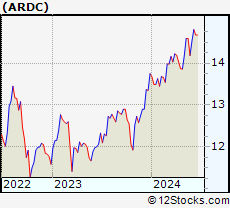 | ARDC Ares Dynamic Credit Allocation Fund, Inc. |
| Sector: Financials | |
| SubSector: Asset Management | |
| MarketCap: 234.803 Millions | |
| Recent Price: 14.59 Smart Investing & Trading Score: 76 | |
| Day Percent Change: 0.27% Day Change: 0.04 | |
| Week Change: 0% Year-to-date Change: 6.1% | |
| ARDC Links: Profile News Message Board | |
| Charts:- Daily , Weekly | |
| Add ARDC to Watchlist: View: Get Complete ARDC Trend Analysis ➞ | |
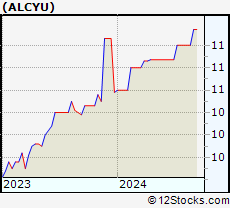 | ALCYU Alchemy Investments Acquisition Corp 1 |
| Sector: Financials | |
| SubSector: SPAC | |
| MarketCap: 147 Millions | |
| Recent Price: 10.70 Smart Investing & Trading Score: 44 | |
| Day Percent Change: 0.00% Day Change: 0.00 | |
| Week Change: 0% Year-to-date Change: 2.0% | |
| ALCYU Links: Profile News Message Board | |
| Charts:- Daily , Weekly | |
| Add ALCYU to Watchlist: View: Get Complete ALCYU Trend Analysis ➞ | |
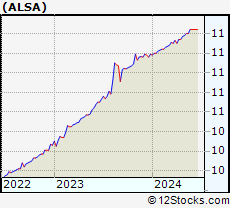 | ALSA Alpha Star Acquisition Corporation |
| Sector: Financials | |
| SubSector: SPAC | |
| MarketCap: 158 Millions | |
| Recent Price: 11.40 Smart Investing & Trading Score: 34 | |
| Day Percent Change: 0.00% Day Change: 0.00 | |
| Week Change: 0% Year-to-date Change: 1.9% | |
| ALSA Links: Profile News Message Board | |
| Charts:- Daily , Weekly | |
| Add ALSA to Watchlist: View: Get Complete ALSA Trend Analysis ➞ | |
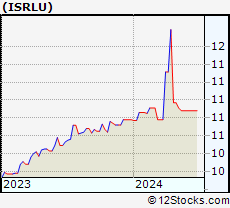 | ISRLU Israel Acquisitions Corp |
| Sector: Financials | |
| SubSector: SPAC | |
| MarketCap: 208 Millions | |
| Recent Price: 10.88 Smart Investing & Trading Score: 23 | |
| Day Percent Change: 0.00% Day Change: 0.00 | |
| Week Change: 0% Year-to-date Change: 0.9% | |
| ISRLU Links: Profile News Message Board | |
| Charts:- Daily , Weekly | |
| Add ISRLU to Watchlist: View: Get Complete ISRLU Trend Analysis ➞ | |
| For tabular summary view of above stock list: Summary View ➞ 0 - 25 , 25 - 50 , 50 - 75 , 75 - 100 , 100 - 125 , 125 - 150 , 150 - 175 , 175 - 200 , 200 - 225 , 225 - 250 , 250 - 275 , 275 - 300 , 300 - 325 , 325 - 350 , 350 - 375 , 375 - 400 , 400 - 425 , 425 - 450 , 450 - 475 , 475 - 500 , 500 - 525 , 525 - 550 , 550 - 575 , 575 - 600 , 600 - 625 , 625 - 650 , 650 - 675 , 675 - 700 , 700 - 725 , 725 - 750 , 750 - 775 , 775 - 800 , 800 - 825 , 825 - 850 , 850 - 875 , 875 - 900 , 900 - 925 , 925 - 950 , 950 - 975 , 975 - 1000 , 1000 - 1025 , 1025 - 1050 , 1050 - 1075 , 1075 - 1100 , 1100 - 1125 , 1125 - 1150 , 1150 - 1175 , 1175 - 1200 , 1200 - 1225 | ||
| Click To Change The Sort Order: By Market Cap or Company Size Performance: Year-to-date, Week and Day | |
| Select Chart Type: | ||
|
Best Stocks Today 12Stocks.com |
© 2024 12Stocks.com Terms & Conditions Privacy Contact Us
All Information Provided Only For Education And Not To Be Used For Investing or Trading. See Terms & Conditions


One More Thing ... Get Best Stocks Delivered Daily!
Never Ever Miss A Move With Our Top Ten Stocks Lists
Find Best Stocks In Any Market - Bull or Bear Market
Take A Peek At Our Top Ten Stocks Lists: Daily, Weekly, Year-to-Date & Top Trends
Find Best Stocks In Any Market - Bull or Bear Market
Take A Peek At Our Top Ten Stocks Lists: Daily, Weekly, Year-to-Date & Top Trends
Financial Stocks With Best Up Trends [0-bearish to 100-bullish]: Fangdd Network[100], Xinyuan Real[100], MicroSectors Gold[100], Sprott Physical[100], Citizens & Northern[100], Sumitomo Mitsui[100], First Community[100], Chubb [100], Angel Oak[100], Sprott Physical[100], Iris Energy[100]
Best Financial Stocks Year-to-Date:
Root [526.36%], Fangdd Network[149.63%], Banco Macro[126.41%], Grupo Financiero[112.4%], Banco BBVA[110.66%], SelectQuote [110.22%], Gladstone Capital[106.92%], EverQuote [98.2%], Hippo [92.54%], Grupo Supervielle[86.95%], Vista Oil[60.93%] Best Financial Stocks This Week:
Fangdd Network[360.27%], Xinyuan Real[53.28%], Iris Energy[25.68%], Fathom [25.35%], Huize Holding[21.83%], First Foundation[18.98%], Trupanion [17.21%], Bridge [16.67%], MicroSectors Gold[15.19%], KE [13.86%], Douglas Elliman[13.56%] Best Financial Stocks Daily:
Fangdd Network[321.26%], Xinyuan Real[39.49%], MicroSectors Gold[12.02%], Fathom [9.88%], Citizens [8.53%], Hywin [8.28%], Root [6.10%], First Foundation[6.09%], Sprott Physical[6.09%], Freedom Holding[5.02%], NexGen Energy[4.99%]