
 Login Sign Up


| |||||
 |  | ||||

| 12Stocks.com Market Intelligence |
Best Financial Stocks
| In a hurry? Financial Stocks Lists: Performance Trends Table, Stock Charts
Sort Financial stocks: Daily, Weekly, Year-to-Date, Market Cap & Trends. Filter Financial stocks list by size:All Financial Large Mid-Range Small & MicroCap |
| 12Stocks.com Financial Stocks Performances & Trends Daily | |||||||||
|
|  The overall Smart Investing & Trading Score is 95 (0-bearish to 100-bullish) which puts Financial sector in short term bullish trend. The Smart Investing & Trading Score from previous trading session is 100 and a deterioration of trend continues.
| ||||||||
Here are the Smart Investing & Trading Scores of the most requested Financial stocks at 12Stocks.com (click stock name for detailed review):
|


| 12Stocks.com: Investing in Financial sector with Stocks | |
|
The following table helps investors and traders sort through current performance and trends (as measured by Smart Investing & Trading Score) of various
stocks in the Financial sector. Quick View: Move mouse or cursor over stock symbol (ticker) to view short-term Technical chart and over stock name to view long term chart. Click on  to add stock symbol to your watchlist and to add stock symbol to your watchlist and  to view watchlist. Click on any ticker or stock name for detailed market intelligence report for that stock. to view watchlist. Click on any ticker or stock name for detailed market intelligence report for that stock. |
12Stocks.com Performance of Stocks in Financial Sector
| Ticker | Stock Name | Watchlist | Category | Recent Price | Smart Investing & Trading Score | Change % | Weekly Change% |
| IVV | iShares Core |   | Exchange Traded Fund | 532.13 | 83 | -0.34% | 1.67% |
| MFA | MFA | | Mortgage | 11.02 | 69 | 0.18% | 1.66% |
| BAM | Brookfield Asset | | Real Estatet | 40.41 | 69 | 1.10% | 1.66% |
| ENX | Eaton Vance | | Asset Mgmt | 9.84 | 82 | 0.20% | 1.65% |
| HELX | Franklin Genomic | | Exchange Traded Fund | 31.66 | 50 | -0.47% | 1.64% |
| WF | Woori | | Foreign Banks | 32.76 | 52 | 0.06% | 1.64% |
| DFS | Discover | | Credit Services | 125.42 | 63 | 0.49% | 1.64% |
| RNR | RenaissanceRe | | Insurance | 229.43 | 90 | 1.14% | 1.63% |
| SHG | Shinhan | | Foreign Banks | 35.56 | 83 | -0.28% | 1.63% |
| EQBK | Equity Bancshares | | Regional Banks | 34.94 | 100 | 1.78% | 1.63% |
| PMT | PennyMac Mortgage | | Mortgage | 15.04 | 90 | -0.86% | 1.62% |
| CIVB | Civista Bancshares | | Regional Banks | 15.07 | 87 | 2.87% | 1.62% |
| EVT | Eaton Vance | | Closed-End Fund - Equity | 23.99 | 88 | 0.33% | 1.61% |
| FPI | Farmland Partners | | REIT - | 11.37 | 49 | -0.96% | 1.61% |
| ASGI | Aberdeen Standard | | Exchange Traded Fund | 18.95 | 76 | 0.16% | 1.61% |
| EJAN | Innovator MSCI | | Exchange Traded Fund | 30.07 | 95 | 0.24% | 1.61% |
| TDSC | Cabana Target | | Exchange Traded Fund | 24.43 | 95 | 0.38% | 1.60% |
| PFBC | Preferred Bank | | Regional Banks | 79.97 | 90 | 0.11% | 1.60% |
| EPRT | Essential Properties | | REIT - | 27.54 | 100 | 1.21% | 1.60% |
| LCG | Sterling Capital | | Exchange Traded Fund | 28.30 | 52 | -0.43% | 1.59% |
| THG | Hanover Insurance | | Insurance | 137.56 | 100 | 0.79% | 1.58% |
| CTRE | CareTrust REIT | | REIT | 25.08 | 100 | 0.84% | 1.58% |
| KOKU | Xtrackers MSCI | | Exchange Traded Fund | 94.39 | 95 | -0.10% | 1.58% |
| NUSI | Nationwide Risk | | Exchange Traded Fund | 23.86 | 78 | -0.21% | 1.58% |
| SSUS | Day Hagan/Ned | | Exchange Traded Fund | 38.67 | 83 | 0.16% | 1.58% |
| For chart view version of above stock list: Chart View ➞ 0 - 25 , 25 - 50 , 50 - 75 , 75 - 100 , 100 - 125 , 125 - 150 , 150 - 175 , 175 - 200 , 200 - 225 , 225 - 250 , 250 - 275 , 275 - 300 , 300 - 325 , 325 - 350 , 350 - 375 , 375 - 400 , 400 - 425 , 425 - 450 , 450 - 475 , 475 - 500 , 500 - 525 , 525 - 550 , 550 - 575 , 575 - 600 , 600 - 625 , 625 - 650 , 650 - 675 , 675 - 700 , 700 - 725 , 725 - 750 , 750 - 775 , 775 - 800 , 800 - 825 , 825 - 850 , 850 - 875 , 875 - 900 , 900 - 925 , 925 - 950 , 950 - 975 , 975 - 1000 , 1000 - 1025 , 1025 - 1050 , 1050 - 1075 , 1075 - 1100 , 1100 - 1125 , 1125 - 1150 , 1150 - 1175 , 1175 - 1200 , 1200 - 1225 | ||
 | Click To Change The Sort Order: By Market Cap or Company Size Performance: Year-to-date, Week and Day |  |
|
Get the most comprehensive stock market coverage daily at 12Stocks.com ➞ Best Stocks Today ➞ Best Stocks Weekly ➞ Best Stocks Year-to-Date ➞ Best Stocks Trends ➞  Best Stocks Today 12Stocks.com Best Nasdaq Stocks ➞ Best S&P 500 Stocks ➞ Best Tech Stocks ➞ Best Biotech Stocks ➞ |
| Detailed Overview of Financial Stocks |
| Financial Technical Overview, Leaders & Laggards, Top Financial ETF Funds & Detailed Financial Stocks List, Charts, Trends & More |
| Financial Sector: Technical Analysis, Trends & YTD Performance | |
| Financial sector is composed of stocks
from banks, brokers, insurance, REITs
and services subsectors. Financial sector, as represented by XLF, an exchange-traded fund [ETF] that holds basket of Financial stocks (e.g, Bank of America, Goldman Sachs) is up by 13.01% and is currently outperforming the overall market by 2.44% year-to-date. Below is a quick view of Technical charts and trends: |
|
 XLF Weekly Chart |
|
| Long Term Trend: Very Good | |
| Medium Term Trend: Very Good | |
 XLF Daily Chart |
|
| Short Term Trend: Very Good | |
| Overall Trend Score: 95 | |
| YTD Performance: 13.01% | |
| **Trend Scores & Views Are Only For Educational Purposes And Not For Investing | |
| 12Stocks.com: Top Performing Financial Sector Stocks | ||||||||||||||||||||||||||||||||||||||||||||||||
 The top performing Financial sector stocks year to date are
Now, more recently, over last week, the top performing Financial sector stocks on the move are


|
||||||||||||||||||||||||||||||||||||||||||||||||
| 12Stocks.com: Investing in Financial Sector using Exchange Traded Funds | |
|
The following table shows list of key exchange traded funds (ETF) that
help investors track Financial Index. For detailed view, check out our ETF Funds section of our website. Quick View: Move mouse or cursor over ETF symbol (ticker) to view short-term Technical chart and over ETF name to view long term chart. Click on ticker or stock name for detailed view. Click on to add stock symbol to your watchlist and to view watchlist. |
12Stocks.com List of ETFs that track Financial Index
| Ticker | ETF Name | Watchlist | Recent Price | Smart Investing & Trading Score | Change % | Week % | Year-to-date % |
| XLF | Financial | | 42.49 | 95 | 0.73 | 1.58 | 13.01% |
| IAI | Broker-Dealers & Secs | | 119.47 | 100 | 1.08 | 2.59 | 10.08% |
| IYF | Financials | | 96.85 | 95 | 0.43 | 1.73 | 13.39% |
| IYG | Financial Services | | 67.11 | 95 | 0.15 | 1.56 | 12.34% |
| KRE | Regional Banking | | 51.19 | 83 | 0.23 | 1.67 | -2.37% |
| IXG | Global Financials | | 88.72 | 88 | 0.21 | 1.41 | 12.91% |
| VFH | Financials | | 103.00 | 95 | 0.18 | 1.45 | 11.64% |
| KBE | Bank | | 47.93 | 83 | 0.44 | 1.25 | 4.15% |
| FAS | Financial Bull 3X | | 112.32 | 95 | 1.81 | 4.06 | 35.9% |
| FAZ | Financial Bear 3X | | 9.75 | 10 | -1.71 | -3.75 | -28.68% |
| UYG | Financials | | 68.54 | 100 | 1.23 | 2.77 | 24.17% |
| IAT | Regional Banks | | 43.42 | 76 | -0.26 | 1.02 | 3.78% |
| KIE | Insurance | | 51.83 | 100 | 0.88 | 1.09 | 14.62% |
| PSCF | SmallCap Financials | | 49.03 | 95 | 0.28 | 1.44 | -0.31% |
| EUFN | Europe Financials | | 24.13 | 95 | 0.67 | 2.51 | 15.12% |
| PGF | Financial Preferred | | 14.81 | 52 | -0.10 | 0.68 | 1.58% |
| 12Stocks.com: Charts, Trends, Fundamental Data and Performances of Financial Stocks | |
|
We now take in-depth look at all Financial stocks including charts, multi-period performances and overall trends (as measured by Smart Investing & Trading Score). One can sort Financial stocks (click link to choose) by Daily, Weekly and by Year-to-Date performances. Also, one can sort by size of the company or by market capitalization. |
| Select Your Default Chart Type: | |||||
| |||||
| Click on stock symbol or name for detailed view. Click on to add stock symbol to your watchlist and to view watchlist. Quick View: Move mouse or cursor over "Daily" to quickly view daily Technical stock chart and over "Weekly" to view weekly Technical stock chart. | |||||

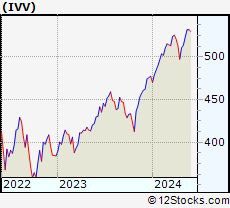 | IVV iShares Core S&P 500 ETF |
| Sector: Financials | |
| SubSector: Exchange Traded Fund | |
| MarketCap: 167045 Millions | |
| Recent Price: 532.13 Smart Investing & Trading Score: 83 | |
| Day Percent Change: -0.34% Day Change: -1.82 | |
| Week Change: 1.67% Year-to-date Change: 11.4% | |
| IVV Links: Profile News Message Board | |
| Charts:- Daily , Weekly | |
| Add IVV to Watchlist: View: Get Complete IVV Trend Analysis ➞ | |
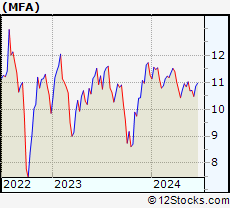 | MFA MFA Financial, Inc. |
| Sector: Financials | |
| SubSector: Mortgage Investment | |
| MarketCap: 1869.69 Millions | |
| Recent Price: 11.02 Smart Investing & Trading Score: 69 | |
| Day Percent Change: 0.18% Day Change: 0.02 | |
| Week Change: 1.66% Year-to-date Change: -2.2% | |
| MFA Links: Profile News Message Board | |
| Charts:- Daily , Weekly | |
| Add MFA to Watchlist: View: Get Complete MFA Trend Analysis ➞ | |
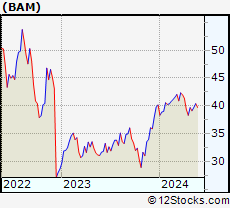 | BAM Brookfield Asset Management Inc. |
| Sector: Financials | |
| SubSector: Real Estate Development | |
| MarketCap: 47134.9 Millions | |
| Recent Price: 40.41 Smart Investing & Trading Score: 69 | |
| Day Percent Change: 1.10% Day Change: 0.44 | |
| Week Change: 1.66% Year-to-date Change: 0.6% | |
| BAM Links: Profile News Message Board | |
| Charts:- Daily , Weekly | |
| Add BAM to Watchlist: View: Get Complete BAM Trend Analysis ➞ | |
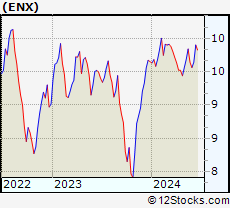 | ENX Eaton Vance New York Municipal Bond Fund |
| Sector: Financials | |
| SubSector: Asset Management | |
| MarketCap: 187.303 Millions | |
| Recent Price: 9.84 Smart Investing & Trading Score: 82 | |
| Day Percent Change: 0.20% Day Change: 0.02 | |
| Week Change: 1.65% Year-to-date Change: 2.0% | |
| ENX Links: Profile News Message Board | |
| Charts:- Daily , Weekly | |
| Add ENX to Watchlist: View: Get Complete ENX Trend Analysis ➞ | |
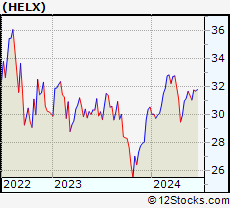 | HELX Franklin Genomic Advancements ETF |
| Sector: Financials | |
| SubSector: Exchange Traded Fund | |
| MarketCap: 60157 Millions | |
| Recent Price: 31.66 Smart Investing & Trading Score: 50 | |
| Day Percent Change: -0.47% Day Change: -0.15 | |
| Week Change: 1.64% Year-to-date Change: 3.7% | |
| HELX Links: Profile News Message Board | |
| Charts:- Daily , Weekly | |
| Add HELX to Watchlist: View: Get Complete HELX Trend Analysis ➞ | |
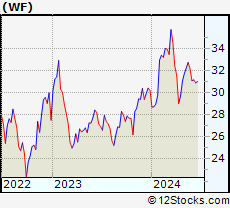 | WF Woori Financial Group Inc. |
| Sector: Financials | |
| SubSector: Foreign Regional Banks | |
| MarketCap: 4772.69 Millions | |
| Recent Price: 32.76 Smart Investing & Trading Score: 52 | |
| Day Percent Change: 0.06% Day Change: 0.02 | |
| Week Change: 1.64% Year-to-date Change: 8.4% | |
| WF Links: Profile News Message Board | |
| Charts:- Daily , Weekly | |
| Add WF to Watchlist: View: Get Complete WF Trend Analysis ➞ | |
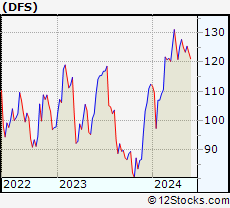 | DFS Discover Financial Services |
| Sector: Financials | |
| SubSector: Credit Services | |
| MarketCap: 9228.88 Millions | |
| Recent Price: 125.42 Smart Investing & Trading Score: 63 | |
| Day Percent Change: 0.49% Day Change: 0.61 | |
| Week Change: 1.64% Year-to-date Change: 11.6% | |
| DFS Links: Profile News Message Board | |
| Charts:- Daily , Weekly | |
| Add DFS to Watchlist: View: Get Complete DFS Trend Analysis ➞ | |
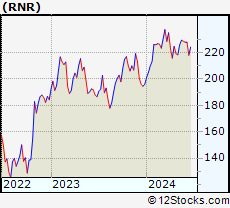 | RNR RenaissanceRe Holdings Ltd. |
| Sector: Financials | |
| SubSector: Property & Casualty Insurance | |
| MarketCap: 6153.32 Millions | |
| Recent Price: 229.43 Smart Investing & Trading Score: 90 | |
| Day Percent Change: 1.14% Day Change: 2.58 | |
| Week Change: 1.63% Year-to-date Change: 17.1% | |
| RNR Links: Profile News Message Board | |
| Charts:- Daily , Weekly | |
| Add RNR to Watchlist: View: Get Complete RNR Trend Analysis ➞ | |
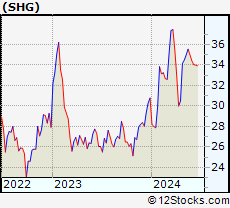 | SHG Shinhan Financial Group Co., Ltd. |
| Sector: Financials | |
| SubSector: Foreign Regional Banks | |
| MarketCap: 9959.09 Millions | |
| Recent Price: 35.56 Smart Investing & Trading Score: 83 | |
| Day Percent Change: -0.28% Day Change: -0.10 | |
| Week Change: 1.63% Year-to-date Change: 15.5% | |
| SHG Links: Profile News Message Board | |
| Charts:- Daily , Weekly | |
| Add SHG to Watchlist: View: Get Complete SHG Trend Analysis ➞ | |
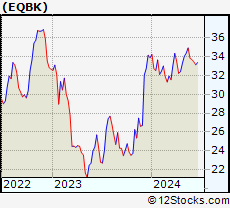 | EQBK Equity Bancshares, Inc. |
| Sector: Financials | |
| SubSector: Regional - Midwest Banks | |
| MarketCap: 272.87 Millions | |
| Recent Price: 34.94 Smart Investing & Trading Score: 100 | |
| Day Percent Change: 1.78% Day Change: 0.61 | |
| Week Change: 1.63% Year-to-date Change: 3.1% | |
| EQBK Links: Profile News Message Board | |
| Charts:- Daily , Weekly | |
| Add EQBK to Watchlist: View: Get Complete EQBK Trend Analysis ➞ | |
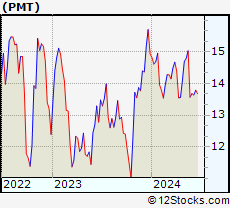 | PMT PennyMac Mortgage Investment Trust |
| Sector: Financials | |
| SubSector: Mortgage Investment | |
| MarketCap: 917.639 Millions | |
| Recent Price: 15.04 Smart Investing & Trading Score: 90 | |
| Day Percent Change: -0.86% Day Change: -0.13 | |
| Week Change: 1.62% Year-to-date Change: 0.6% | |
| PMT Links: Profile News Message Board | |
| Charts:- Daily , Weekly | |
| Add PMT to Watchlist: View: Get Complete PMT Trend Analysis ➞ | |
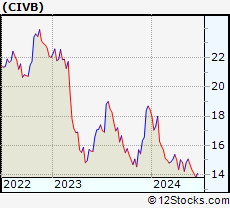 | CIVB Civista Bancshares, Inc. |
| Sector: Financials | |
| SubSector: Regional - Pacific Banks | |
| MarketCap: 255.929 Millions | |
| Recent Price: 15.07 Smart Investing & Trading Score: 87 | |
| Day Percent Change: 2.87% Day Change: 0.42 | |
| Week Change: 1.62% Year-to-date Change: -18.3% | |
| CIVB Links: Profile News Message Board | |
| Charts:- Daily , Weekly | |
| Add CIVB to Watchlist: View: Get Complete CIVB Trend Analysis ➞ | |
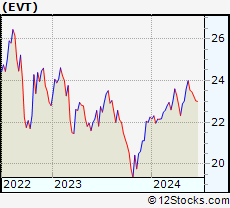 | EVT Eaton Vance Tax-Advantaged Dividend Income Fund |
| Sector: Financials | |
| SubSector: Closed-End Fund - Equity | |
| MarketCap: 979.647 Millions | |
| Recent Price: 23.99 Smart Investing & Trading Score: 88 | |
| Day Percent Change: 0.33% Day Change: 0.08 | |
| Week Change: 1.61% Year-to-date Change: 7.8% | |
| EVT Links: Profile News Message Board | |
| Charts:- Daily , Weekly | |
| Add EVT to Watchlist: View: Get Complete EVT Trend Analysis ➞ | |
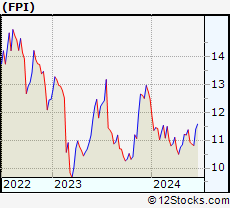 | FPI Farmland Partners Inc. |
| Sector: Financials | |
| SubSector: REIT - Diversified | |
| MarketCap: 182.653 Millions | |
| Recent Price: 11.37 Smart Investing & Trading Score: 49 | |
| Day Percent Change: -0.96% Day Change: -0.11 | |
| Week Change: 1.61% Year-to-date Change: -8.9% | |
| FPI Links: Profile News Message Board | |
| Charts:- Daily , Weekly | |
| Add FPI to Watchlist: View: Get Complete FPI Trend Analysis ➞ | |
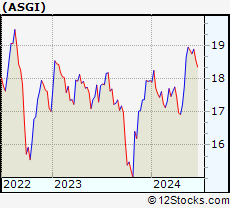 | ASGI Aberdeen Standard Global Infrastructure Income Fund |
| Sector: Financials | |
| SubSector: Exchange Traded Fund | |
| MarketCap: 60157 Millions | |
| Recent Price: 18.95 Smart Investing & Trading Score: 76 | |
| Day Percent Change: 0.16% Day Change: 0.03 | |
| Week Change: 1.61% Year-to-date Change: 5.6% | |
| ASGI Links: Profile News Message Board | |
| Charts:- Daily , Weekly | |
| Add ASGI to Watchlist: View: Get Complete ASGI Trend Analysis ➞ | |
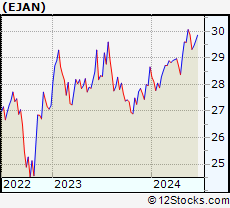 | EJAN Innovator MSCI EM Power Buffer ETF January |
| Sector: Financials | |
| SubSector: Exchange Traded Fund | |
| MarketCap: 60157 Millions | |
| Recent Price: 30.07 Smart Investing & Trading Score: 95 | |
| Day Percent Change: 0.24% Day Change: 0.07 | |
| Week Change: 1.61% Year-to-date Change: 4.9% | |
| EJAN Links: Profile News Message Board | |
| Charts:- Daily , Weekly | |
| Add EJAN to Watchlist: View: Get Complete EJAN Trend Analysis ➞ | |
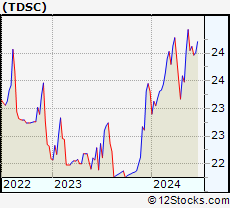 | TDSC Cabana Target Drawdown 10 ETF |
| Sector: Financials | |
| SubSector: Exchange Traded Fund | |
| MarketCap: 60157 Millions | |
| Recent Price: 24.43 Smart Investing & Trading Score: 95 | |
| Day Percent Change: 0.38% Day Change: 0.09 | |
| Week Change: 1.6% Year-to-date Change: 4.8% | |
| TDSC Links: Profile News Message Board | |
| Charts:- Daily , Weekly | |
| Add TDSC to Watchlist: View: Get Complete TDSC Trend Analysis ➞ | |
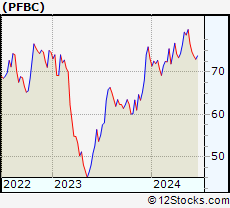 | PFBC Preferred Bank |
| Sector: Financials | |
| SubSector: Regional - Pacific Banks | |
| MarketCap: 559.629 Millions | |
| Recent Price: 79.97 Smart Investing & Trading Score: 90 | |
| Day Percent Change: 0.11% Day Change: 0.09 | |
| Week Change: 1.6% Year-to-date Change: 9.5% | |
| PFBC Links: Profile News Message Board | |
| Charts:- Daily , Weekly | |
| Add PFBC to Watchlist: View: Get Complete PFBC Trend Analysis ➞ | |
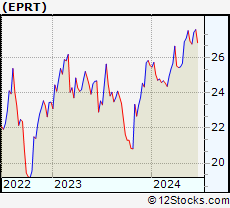 | EPRT Essential Properties Realty Trust, Inc. |
| Sector: Financials | |
| SubSector: REIT - Diversified | |
| MarketCap: 1424.43 Millions | |
| Recent Price: 27.54 Smart Investing & Trading Score: 100 | |
| Day Percent Change: 1.21% Day Change: 0.33 | |
| Week Change: 1.6% Year-to-date Change: 7.8% | |
| EPRT Links: Profile News Message Board | |
| Charts:- Daily , Weekly | |
| Add EPRT to Watchlist: View: Get Complete EPRT Trend Analysis ➞ | |
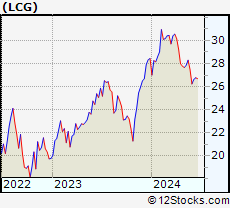 | LCG Sterling Capital Focus Equity ETF |
| Sector: Financials | |
| SubSector: Exchange Traded Fund | |
| MarketCap: 60157 Millions | |
| Recent Price: 28.30 Smart Investing & Trading Score: 52 | |
| Day Percent Change: -0.43% Day Change: -0.12 | |
| Week Change: 1.59% Year-to-date Change: -0.5% | |
| LCG Links: Profile News Message Board | |
| Charts:- Daily , Weekly | |
| Add LCG to Watchlist: View: Get Complete LCG Trend Analysis ➞ | |
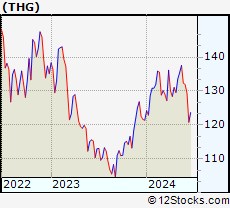 | THG The Hanover Insurance Group, Inc. |
| Sector: Financials | |
| SubSector: Property & Casualty Insurance | |
| MarketCap: 3677.92 Millions | |
| Recent Price: 137.56 Smart Investing & Trading Score: 100 | |
| Day Percent Change: 0.79% Day Change: 1.08 | |
| Week Change: 1.58% Year-to-date Change: 13.3% | |
| THG Links: Profile News Message Board | |
| Charts:- Daily , Weekly | |
| Add THG to Watchlist: View: Get Complete THG Trend Analysis ➞ | |
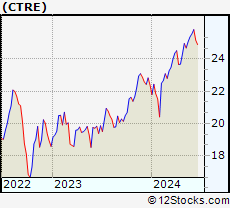 | CTRE CareTrust REIT, Inc. |
| Sector: Financials | |
| SubSector: REIT - Healthcare Facilities | |
| MarketCap: 1507.94 Millions | |
| Recent Price: 25.08 Smart Investing & Trading Score: 100 | |
| Day Percent Change: 0.84% Day Change: 0.21 | |
| Week Change: 1.58% Year-to-date Change: 12.1% | |
| CTRE Links: Profile News Message Board | |
| Charts:- Daily , Weekly | |
| Add CTRE to Watchlist: View: Get Complete CTRE Trend Analysis ➞ | |
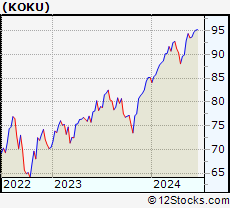 | KOKU Xtrackers MSCI Kokusai Equity ETF |
| Sector: Financials | |
| SubSector: Exchange Traded Fund | |
| MarketCap: 60157 Millions | |
| Recent Price: 94.39 Smart Investing & Trading Score: 95 | |
| Day Percent Change: -0.10% Day Change: -0.10 | |
| Week Change: 1.58% Year-to-date Change: 10.8% | |
| KOKU Links: Profile News Message Board | |
| Charts:- Daily , Weekly | |
| Add KOKU to Watchlist: View: Get Complete KOKU Trend Analysis ➞ | |
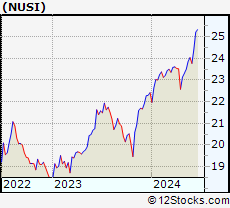 | NUSI Nationwide Risk Managed Income ETF |
| Sector: Financials | |
| SubSector: Exchange Traded Fund | |
| MarketCap: 60157 Millions | |
| Recent Price: 23.86 Smart Investing & Trading Score: 78 | |
| Day Percent Change: -0.21% Day Change: -0.05 | |
| Week Change: 1.58% Year-to-date Change: 6.4% | |
| NUSI Links: Profile News Message Board | |
| Charts:- Daily , Weekly | |
| Add NUSI to Watchlist: View: Get Complete NUSI Trend Analysis ➞ | |
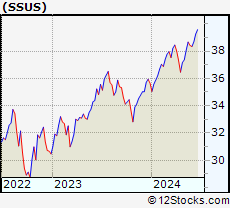 | SSUS Day Hagan/Ned Davis Research Smart Sector ETF |
| Sector: Financials | |
| SubSector: Exchange Traded Fund | |
| MarketCap: 60157 Millions | |
| Recent Price: 38.67 Smart Investing & Trading Score: 83 | |
| Day Percent Change: 0.16% Day Change: 0.06 | |
| Week Change: 1.58% Year-to-date Change: 8.5% | |
| SSUS Links: Profile News Message Board | |
| Charts:- Daily , Weekly | |
| Add SSUS to Watchlist: View: Get Complete SSUS Trend Analysis ➞ | |
| For tabular summary view of above stock list: Summary View ➞ 0 - 25 , 25 - 50 , 50 - 75 , 75 - 100 , 100 - 125 , 125 - 150 , 150 - 175 , 175 - 200 , 200 - 225 , 225 - 250 , 250 - 275 , 275 - 300 , 300 - 325 , 325 - 350 , 350 - 375 , 375 - 400 , 400 - 425 , 425 - 450 , 450 - 475 , 475 - 500 , 500 - 525 , 525 - 550 , 550 - 575 , 575 - 600 , 600 - 625 , 625 - 650 , 650 - 675 , 675 - 700 , 700 - 725 , 725 - 750 , 750 - 775 , 775 - 800 , 800 - 825 , 825 - 850 , 850 - 875 , 875 - 900 , 900 - 925 , 925 - 950 , 950 - 975 , 975 - 1000 , 1000 - 1025 , 1025 - 1050 , 1050 - 1075 , 1075 - 1100 , 1100 - 1125 , 1125 - 1150 , 1150 - 1175 , 1175 - 1200 , 1200 - 1225 | ||
| Click To Change The Sort Order: By Market Cap or Company Size Performance: Year-to-date, Week and Day | |
| Select Chart Type: | ||
|
Best Stocks Today 12Stocks.com |
© 2024 12Stocks.com Terms & Conditions Privacy Contact Us
All Information Provided Only For Education And Not To Be Used For Investing or Trading. See Terms & Conditions


One More Thing ... Get Best Stocks Delivered Daily!
Never Ever Miss A Move With Our Top Ten Stocks Lists
Find Best Stocks In Any Market - Bull or Bear Market
Take A Peek At Our Top Ten Stocks Lists: Daily, Weekly, Year-to-Date & Top Trends
Find Best Stocks In Any Market - Bull or Bear Market
Take A Peek At Our Top Ten Stocks Lists: Daily, Weekly, Year-to-Date & Top Trends
Financial Stocks With Best Up Trends [0-bearish to 100-bullish]: Fangdd Network[100], Xinyuan Real[100], MicroSectors Gold[100], Sprott Physical[100], Citizens & Northern[100], Sumitomo Mitsui[100], First Community[100], Chubb [100], Angel Oak[100], Sprott Physical[100], Iris Energy[100]
Best Financial Stocks Year-to-Date:
Root [526.36%], Fangdd Network[149.63%], Banco Macro[126.41%], Grupo Financiero[112.4%], Banco BBVA[110.66%], SelectQuote [110.22%], Gladstone Capital[106.92%], EverQuote [98.2%], Hippo [92.54%], Grupo Supervielle[86.95%], Vista Oil[60.93%] Best Financial Stocks This Week:
Fangdd Network[360.27%], Xinyuan Real[53.28%], Iris Energy[25.68%], Fathom [25.35%], Huize Holding[21.83%], First Foundation[18.98%], Trupanion [17.21%], Bridge [16.67%], MicroSectors Gold[15.19%], KE [13.86%], Douglas Elliman[13.56%] Best Financial Stocks Daily:
Fangdd Network[321.26%], Xinyuan Real[39.49%], MicroSectors Gold[12.02%], Fathom [9.88%], Citizens [8.53%], Hywin [8.28%], Root [6.10%], First Foundation[6.09%], Sprott Physical[6.09%], Freedom Holding[5.02%], NexGen Energy[4.99%]