
 Login Sign Up


| |||||
 |  | ||||

| 12Stocks.com Market Intelligence |
Best Financial Stocks
| In a hurry? Financial Stocks Lists: Performance Trends Table, Stock Charts
Sort Financial stocks: Daily, Weekly, Year-to-Date, Market Cap & Trends. Filter Financial stocks list by size:All Financial Large Mid-Range Small & MicroCap |
| 12Stocks.com Financial Stocks Performances & Trends Daily | |||||||||
|
|  The overall Smart Investing & Trading Score is 95 (0-bearish to 100-bullish) which puts Financial sector in short term bullish trend. The Smart Investing & Trading Score from previous trading session is 100 and a deterioration of trend continues.
| ||||||||
Here are the Smart Investing & Trading Scores of the most requested Financial stocks at 12Stocks.com (click stock name for detailed review):
|


| 12Stocks.com: Investing in Financial sector with Stocks | |
|
The following table helps investors and traders sort through current performance and trends (as measured by Smart Investing & Trading Score) of various
stocks in the Financial sector. Quick View: Move mouse or cursor over stock symbol (ticker) to view short-term Technical chart and over stock name to view long term chart. Click on  to add stock symbol to your watchlist and to add stock symbol to your watchlist and  to view watchlist. Click on any ticker or stock name for detailed market intelligence report for that stock. to view watchlist. Click on any ticker or stock name for detailed market intelligence report for that stock. |
12Stocks.com Performance of Stocks in Financial Sector
| Ticker | Stock Name | Watchlist | Category | Recent Price | Smart Investing & Trading Score | Change % | Weekly Change% |
| NZF | Nuveen Municipal |   | Asset Mgmt | 12.06 | 90 | -0.17% | 0.17% |
| HYI | Western Asset | | Asset Mgmt | 11.62 | 32 | -0.17% | 0.17% |
| PEBO | Peoples Bancorp | | Regional Banks | 30.50 | 83 | 0.16% | 0.16% |
| KMPR | Kemper | | Insurance | 60.85 | 78 | 0.07% | 0.16% |
| FMAY | FT Cboe | | Exchange Traded Fund | 43.70 | 78 | 0.07% | 0.16% |
| FSCO | FS Credit | | Closed-End Fund - Debt | 6.17 | 71 | 0.33% | 0.16% |
| MHF | Western Asset | | Closed-End Fund - Debt | 6.81 | 46 | 0.00% | 0.15% |
| FRA | BlackRock Floating | | Closed-End Fund - Debt | 13.26 | 58 | 0.68% | 0.15% |
| CHW | Calamos Global | | Closed-End Fund - Equity | 6.65 | 59 | 0.30% | 0.15% |
| HWC | Hancock Whitney | | Regional Banks | 47.86 | 61 | -0.17% | 0.15% |
| NUW | Nuveen AMT-Free | | Asset Mgmt | 13.56 | 55 | -0.15% | 0.15% |
| SSBK | Southern States | | Banks - Regional | 26.98 | 68 | 0.52% | 0.15% |
| SKGR | SK Growth | | SPAC | 11.13 | 45 | 0.70% | 0.15% |
| PPT | Putnam Premier | | Closed-End Fund - Debt | 3.53 | 64 | 0.80% | 0.14% |
| SIXH | 6 Meridian | | Exchange Traded Fund | 35.95 | 93 | 0.25% | 0.14% |
| AMP | Ameriprise | | Asset Mgmt | 434.12 | 76 | -0.43% | 0.13% |
| ETJ | Eaton Vance | | Exchange Traded Fund | 8.45 | 76 | -0.82% | 0.12% |
| AMK | AssetMark | | Asset Mgmt | 33.94 | 25 | -0.21% | 0.12% |
| CBH | AllianzGI Convertible | | Asset Mgmt | 8.92 | 51 | -0.11% | 0.11% |
| SPSK | SP Funds | | Exchange Traded Fund | 17.70 | 32 | -0.23% | 0.11% |
| VGM | Invesco Trust | | Closed-End Fund - Debt | 9.86 | 50 | -0.10% | 0.10% |
| BFK | BlackRock Municipal | | Closed-End Fund - Debt | 10.07 | 40 | 0.20% | 0.10% |
| VMO | Invesco Municipal | | Closed-End Fund - Debt | 9.59 | 55 | 0.21% | 0.10% |
| KSM | DWS Strategic | | Closed-End Fund - Debt | 9.63 | 58 | -0.21% | 0.10% |
| JHS | John Hancock | | Closed-End Fund - Debt | 11.51 | 69 | 0.00% | 0.09% |
| For chart view version of above stock list: Chart View ➞ 0 - 25 , 25 - 50 , 50 - 75 , 75 - 100 , 100 - 125 , 125 - 150 , 150 - 175 , 175 - 200 , 200 - 225 , 225 - 250 , 250 - 275 , 275 - 300 , 300 - 325 , 325 - 350 , 350 - 375 , 375 - 400 , 400 - 425 , 425 - 450 , 450 - 475 , 475 - 500 , 500 - 525 , 525 - 550 , 550 - 575 , 575 - 600 , 600 - 625 , 625 - 650 , 650 - 675 , 675 - 700 , 700 - 725 , 725 - 750 , 750 - 775 , 775 - 800 , 800 - 825 , 825 - 850 , 850 - 875 , 875 - 900 , 900 - 925 , 925 - 950 , 950 - 975 , 975 - 1000 , 1000 - 1025 , 1025 - 1050 , 1050 - 1075 , 1075 - 1100 , 1100 - 1125 , 1125 - 1150 , 1150 - 1175 , 1175 - 1200 , 1200 - 1225 | ||
 | Click To Change The Sort Order: By Market Cap or Company Size Performance: Year-to-date, Week and Day |  |
|
Get the most comprehensive stock market coverage daily at 12Stocks.com ➞ Best Stocks Today ➞ Best Stocks Weekly ➞ Best Stocks Year-to-Date ➞ Best Stocks Trends ➞  Best Stocks Today 12Stocks.com Best Nasdaq Stocks ➞ Best S&P 500 Stocks ➞ Best Tech Stocks ➞ Best Biotech Stocks ➞ |
| Detailed Overview of Financial Stocks |
| Financial Technical Overview, Leaders & Laggards, Top Financial ETF Funds & Detailed Financial Stocks List, Charts, Trends & More |
| Financial Sector: Technical Analysis, Trends & YTD Performance | |
| Financial sector is composed of stocks
from banks, brokers, insurance, REITs
and services subsectors. Financial sector, as represented by XLF, an exchange-traded fund [ETF] that holds basket of Financial stocks (e.g, Bank of America, Goldman Sachs) is up by 13.01% and is currently outperforming the overall market by 2.44% year-to-date. Below is a quick view of Technical charts and trends: |
|
 XLF Weekly Chart |
|
| Long Term Trend: Very Good | |
| Medium Term Trend: Very Good | |
 XLF Daily Chart |
|
| Short Term Trend: Very Good | |
| Overall Trend Score: 95 | |
| YTD Performance: 13.01% | |
| **Trend Scores & Views Are Only For Educational Purposes And Not For Investing | |
| 12Stocks.com: Top Performing Financial Sector Stocks | ||||||||||||||||||||||||||||||||||||||||||||||||
 The top performing Financial sector stocks year to date are
Now, more recently, over last week, the top performing Financial sector stocks on the move are


|
||||||||||||||||||||||||||||||||||||||||||||||||
| 12Stocks.com: Investing in Financial Sector using Exchange Traded Funds | |
|
The following table shows list of key exchange traded funds (ETF) that
help investors track Financial Index. For detailed view, check out our ETF Funds section of our website. Quick View: Move mouse or cursor over ETF symbol (ticker) to view short-term Technical chart and over ETF name to view long term chart. Click on ticker or stock name for detailed view. Click on to add stock symbol to your watchlist and to view watchlist. |
12Stocks.com List of ETFs that track Financial Index
| Ticker | ETF Name | Watchlist | Recent Price | Smart Investing & Trading Score | Change % | Week % | Year-to-date % |
| XLF | Financial | | 42.49 | 95 | 0.73 | 1.58 | 13.01% |
| IAI | Broker-Dealers & Secs | | 119.47 | 100 | 1.08 | 2.59 | 10.08% |
| IYF | Financials | | 96.85 | 95 | 0.43 | 1.73 | 13.39% |
| IYG | Financial Services | | 67.11 | 95 | 0.15 | 1.56 | 12.34% |
| KRE | Regional Banking | | 51.19 | 83 | 0.23 | 1.67 | -2.37% |
| IXG | Global Financials | | 88.72 | 88 | 0.21 | 1.41 | 12.91% |
| VFH | Financials | | 103.00 | 95 | 0.18 | 1.45 | 11.64% |
| KBE | Bank | | 47.93 | 83 | 0.44 | 1.25 | 4.15% |
| FAS | Financial Bull 3X | | 112.32 | 95 | 1.81 | 4.06 | 35.9% |
| FAZ | Financial Bear 3X | | 9.75 | 10 | -1.71 | -3.75 | -28.68% |
| UYG | Financials | | 68.54 | 100 | 1.23 | 2.77 | 24.17% |
| IAT | Regional Banks | | 43.42 | 76 | -0.26 | 1.02 | 3.78% |
| KIE | Insurance | | 51.83 | 100 | 0.88 | 1.09 | 14.62% |
| PSCF | SmallCap Financials | | 49.03 | 95 | 0.28 | 1.44 | -0.31% |
| EUFN | Europe Financials | | 24.13 | 95 | 0.67 | 2.51 | 15.12% |
| PGF | Financial Preferred | | 14.81 | 52 | -0.10 | 0.68 | 1.58% |
| 12Stocks.com: Charts, Trends, Fundamental Data and Performances of Financial Stocks | |
|
We now take in-depth look at all Financial stocks including charts, multi-period performances and overall trends (as measured by Smart Investing & Trading Score). One can sort Financial stocks (click link to choose) by Daily, Weekly and by Year-to-Date performances. Also, one can sort by size of the company or by market capitalization. |
| Select Your Default Chart Type: | |||||
| |||||
| Click on stock symbol or name for detailed view. Click on to add stock symbol to your watchlist and to view watchlist. Quick View: Move mouse or cursor over "Daily" to quickly view daily Technical stock chart and over "Weekly" to view weekly Technical stock chart. | |||||

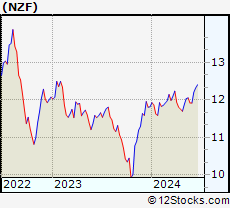 | NZF Nuveen Municipal Credit Income Fund |
| Sector: Financials | |
| SubSector: Asset Management | |
| MarketCap: 1779.43 Millions | |
| Recent Price: 12.06 Smart Investing & Trading Score: 90 | |
| Day Percent Change: -0.17% Day Change: -0.02 | |
| Week Change: 0.17% Year-to-date Change: 2.0% | |
| NZF Links: Profile News Message Board | |
| Charts:- Daily , Weekly | |
| Add NZF to Watchlist: View: Get Complete NZF Trend Analysis ➞ | |
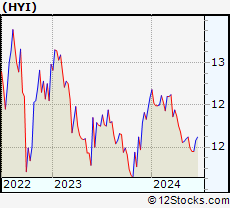 | HYI Western Asset High Yield Defined Opportunity Fund Inc. |
| Sector: Financials | |
| SubSector: Asset Management | |
| MarketCap: 249.703 Millions | |
| Recent Price: 11.62 Smart Investing & Trading Score: 32 | |
| Day Percent Change: -0.17% Day Change: -0.02 | |
| Week Change: 0.17% Year-to-date Change: -3.9% | |
| HYI Links: Profile News Message Board | |
| Charts:- Daily , Weekly | |
| Add HYI to Watchlist: View: Get Complete HYI Trend Analysis ➞ | |
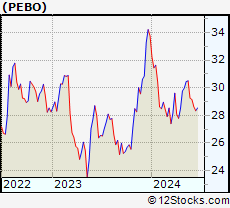 | PEBO Peoples Bancorp Inc. |
| Sector: Financials | |
| SubSector: Regional - Midwest Banks | |
| MarketCap: 449.77 Millions | |
| Recent Price: 30.50 Smart Investing & Trading Score: 83 | |
| Day Percent Change: 0.16% Day Change: 0.05 | |
| Week Change: 0.16% Year-to-date Change: -9.7% | |
| PEBO Links: Profile News Message Board | |
| Charts:- Daily , Weekly | |
| Add PEBO to Watchlist: View: Get Complete PEBO Trend Analysis ➞ | |
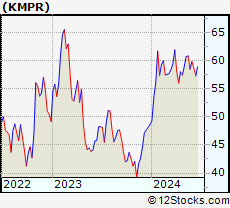 | KMPR Kemper Corporation |
| Sector: Financials | |
| SubSector: Property & Casualty Insurance | |
| MarketCap: 4035.12 Millions | |
| Recent Price: 60.85 Smart Investing & Trading Score: 78 | |
| Day Percent Change: 0.07% Day Change: 0.04 | |
| Week Change: 0.16% Year-to-date Change: 25.0% | |
| KMPR Links: Profile News Message Board | |
| Charts:- Daily , Weekly | |
| Add KMPR to Watchlist: View: Get Complete KMPR Trend Analysis ➞ | |
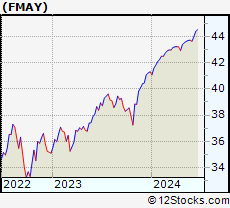 | FMAY FT Cboe Vest US Eq Buffer ETF May |
| Sector: Financials | |
| SubSector: Exchange Traded Fund | |
| MarketCap: 60157 Millions | |
| Recent Price: 43.70 Smart Investing & Trading Score: 78 | |
| Day Percent Change: 0.07% Day Change: 0.03 | |
| Week Change: 0.16% Year-to-date Change: 5.8% | |
| FMAY Links: Profile News Message Board | |
| Charts:- Daily , Weekly | |
| Add FMAY to Watchlist: View: Get Complete FMAY Trend Analysis ➞ | |
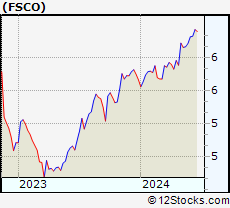 | FSCO FS Credit Opportunities Corp. |
| Sector: Financials | |
| SubSector: Closed-End Fund - Debt | |
| MarketCap: 942 Millions | |
| Recent Price: 6.17 Smart Investing & Trading Score: 71 | |
| Day Percent Change: 0.33% Day Change: 0.02 | |
| Week Change: 0.16% Year-to-date Change: 8.9% | |
| FSCO Links: Profile News Message Board | |
| Charts:- Daily , Weekly | |
| Add FSCO to Watchlist: View: Get Complete FSCO Trend Analysis ➞ | |
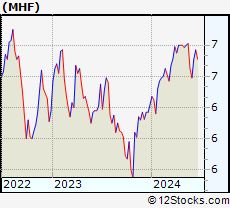 | MHF Western Asset Municipal High Income Fund Inc. |
| Sector: Financials | |
| SubSector: Closed-End Fund - Debt | |
| MarketCap: 139.107 Millions | |
| Recent Price: 6.81 Smart Investing & Trading Score: 46 | |
| Day Percent Change: 0.00% Day Change: 0.00 | |
| Week Change: 0.15% Year-to-date Change: 6.1% | |
| MHF Links: Profile News Message Board | |
| Charts:- Daily , Weekly | |
| Add MHF to Watchlist: View: Get Complete MHF Trend Analysis ➞ | |
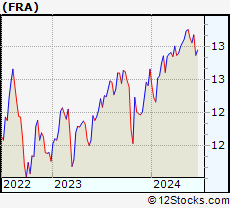 | FRA BlackRock Floating Rate Income Strategies Fund, Inc. |
| Sector: Financials | |
| SubSector: Closed-End Fund - Debt | |
| MarketCap: 312.007 Millions | |
| Recent Price: 13.26 Smart Investing & Trading Score: 58 | |
| Day Percent Change: 0.68% Day Change: 0.09 | |
| Week Change: 0.15% Year-to-date Change: 4.7% | |
| FRA Links: Profile News Message Board | |
| Charts:- Daily , Weekly | |
| Add FRA to Watchlist: View: Get Complete FRA Trend Analysis ➞ | |
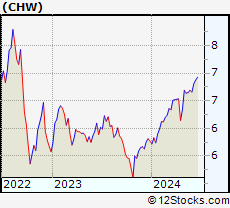 | CHW Calamos Global Dynamic Income Fund |
| Sector: Financials | |
| SubSector: Closed-End Fund - Equity | |
| MarketCap: 272.047 Millions | |
| Recent Price: 6.65 Smart Investing & Trading Score: 59 | |
| Day Percent Change: 0.30% Day Change: 0.02 | |
| Week Change: 0.15% Year-to-date Change: 15.3% | |
| CHW Links: Profile News Message Board | |
| Charts:- Daily , Weekly | |
| Add CHW to Watchlist: View: Get Complete CHW Trend Analysis ➞ | |
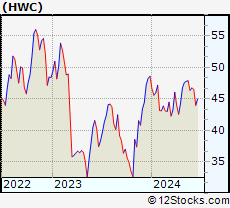 | HWC Hancock Whitney Corporation |
| Sector: Financials | |
| SubSector: Regional - Southeast Banks | |
| MarketCap: 1438.55 Millions | |
| Recent Price: 47.86 Smart Investing & Trading Score: 61 | |
| Day Percent Change: -0.17% Day Change: -0.08 | |
| Week Change: 0.15% Year-to-date Change: -1.5% | |
| HWC Links: Profile News Message Board | |
| Charts:- Daily , Weekly | |
| Add HWC to Watchlist: View: Get Complete HWC Trend Analysis ➞ | |
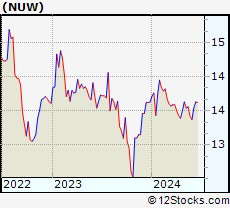 | NUW Nuveen AMT-Free Municipal Value Fund |
| Sector: Financials | |
| SubSector: Asset Management | |
| MarketCap: 211.803 Millions | |
| Recent Price: 13.56 Smart Investing & Trading Score: 55 | |
| Day Percent Change: -0.15% Day Change: -0.02 | |
| Week Change: 0.15% Year-to-date Change: -0.5% | |
| NUW Links: Profile News Message Board | |
| Charts:- Daily , Weekly | |
| Add NUW to Watchlist: View: Get Complete NUW Trend Analysis ➞ | |
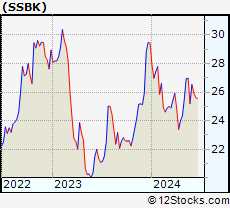 | SSBK Southern States Bancshares, Inc. |
| Sector: Financials | |
| SubSector: Banks - Regional | |
| MarketCap: 187 Millions | |
| Recent Price: 26.98 Smart Investing & Trading Score: 68 | |
| Day Percent Change: 0.52% Day Change: 0.14 | |
| Week Change: 0.15% Year-to-date Change: -8.4% | |
| SSBK Links: Profile News Message Board | |
| Charts:- Daily , Weekly | |
| Add SSBK to Watchlist: View: Get Complete SSBK Trend Analysis ➞ | |
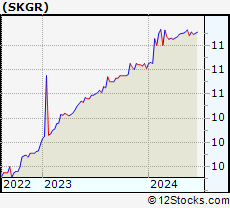 | SKGR SK Growth Opportunities Corporation |
| Sector: Financials | |
| SubSector: SPAC | |
| MarketCap: 277 Millions | |
| Recent Price: 11.13 Smart Investing & Trading Score: 45 | |
| Day Percent Change: 0.70% Day Change: 0.08 | |
| Week Change: 0.15% Year-to-date Change: 2.9% | |
| SKGR Links: Profile News Message Board | |
| Charts:- Daily , Weekly | |
| Add SKGR to Watchlist: View: Get Complete SKGR Trend Analysis ➞ | |
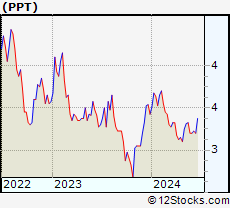 | PPT Putnam Premier Income Trust |
| Sector: Financials | |
| SubSector: Closed-End Fund - Debt | |
| MarketCap: 419.607 Millions | |
| Recent Price: 3.53 Smart Investing & Trading Score: 64 | |
| Day Percent Change: 0.80% Day Change: 0.03 | |
| Week Change: 0.14% Year-to-date Change: -1.1% | |
| PPT Links: Profile News Message Board | |
| Charts:- Daily , Weekly | |
| Add PPT to Watchlist: View: Get Complete PPT Trend Analysis ➞ | |
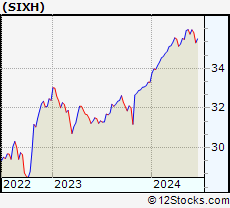 | SIXH 6 Meridian Hedged Equity Index Option Strategy ETF |
| Sector: Financials | |
| SubSector: Exchange Traded Fund | |
| MarketCap: 60157 Millions | |
| Recent Price: 35.95 Smart Investing & Trading Score: 93 | |
| Day Percent Change: 0.25% Day Change: 0.09 | |
| Week Change: 0.14% Year-to-date Change: 8.0% | |
| SIXH Links: Profile News Message Board | |
| Charts:- Daily , Weekly | |
| Add SIXH to Watchlist: View: Get Complete SIXH Trend Analysis ➞ | |
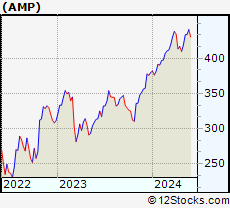 | AMP Ameriprise Financial, Inc. |
| Sector: Financials | |
| SubSector: Asset Management | |
| MarketCap: 13270.5 Millions | |
| Recent Price: 434.12 Smart Investing & Trading Score: 76 | |
| Day Percent Change: -0.43% Day Change: -1.86 | |
| Week Change: 0.13% Year-to-date Change: 14.3% | |
| AMP Links: Profile News Message Board | |
| Charts:- Daily , Weekly | |
| Add AMP to Watchlist: View: Get Complete AMP Trend Analysis ➞ | |
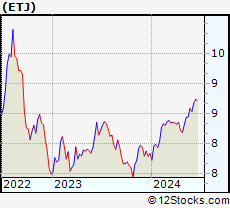 | ETJ Eaton Vance Risk-Managed Diversified Equity Income Fund |
| Sector: Financials | |
| SubSector: Exchange Traded Fund | |
| MarketCap: 473.951 Millions | |
| Recent Price: 8.45 Smart Investing & Trading Score: 76 | |
| Day Percent Change: -0.82% Day Change: -0.07 | |
| Week Change: 0.12% Year-to-date Change: 7.8% | |
| ETJ Links: Profile News Message Board | |
| Charts:- Daily , Weekly | |
| Add ETJ to Watchlist: View: Get Complete ETJ Trend Analysis ➞ | |
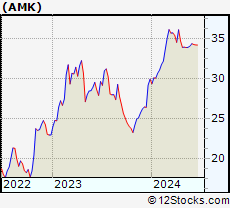 | AMK AssetMark Financial Holdings, Inc. |
| Sector: Financials | |
| SubSector: Asset Management | |
| MarketCap: 1296.33 Millions | |
| Recent Price: 33.94 Smart Investing & Trading Score: 25 | |
| Day Percent Change: -0.21% Day Change: -0.07 | |
| Week Change: 0.12% Year-to-date Change: 13.3% | |
| AMK Links: Profile News Message Board | |
| Charts:- Daily , Weekly | |
| Add AMK to Watchlist: View: Get Complete AMK Trend Analysis ➞ | |
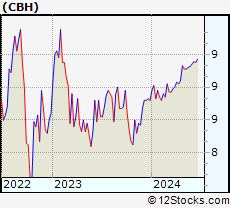 | CBH AllianzGI Convertible & Income 2024 Target Term Fund |
| Sector: Financials | |
| SubSector: Asset Management | |
| MarketCap: 131.403 Millions | |
| Recent Price: 8.92 Smart Investing & Trading Score: 51 | |
| Day Percent Change: -0.11% Day Change: -0.01 | |
| Week Change: 0.11% Year-to-date Change: 2.3% | |
| CBH Links: Profile News Message Board | |
| Charts:- Daily , Weekly | |
| Add CBH to Watchlist: View: Get Complete CBH Trend Analysis ➞ | |
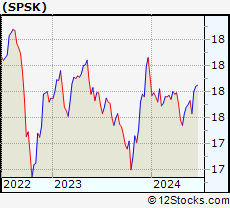 | SPSK SP Funds Dow Jones Global Sukuk ETF |
| Sector: Financials | |
| SubSector: Exchange Traded Fund | |
| MarketCap: 60157 Millions | |
| Recent Price: 17.70 Smart Investing & Trading Score: 32 | |
| Day Percent Change: -0.23% Day Change: -0.04 | |
| Week Change: 0.11% Year-to-date Change: -1.2% | |
| SPSK Links: Profile News Message Board | |
| Charts:- Daily , Weekly | |
| Add SPSK to Watchlist: View: Get Complete SPSK Trend Analysis ➞ | |
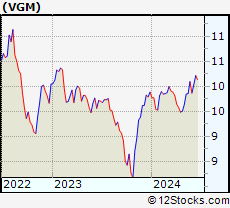 | VGM Invesco Trust for Investment Grade Municipals |
| Sector: Financials | |
| SubSector: Closed-End Fund - Debt | |
| MarketCap: 572.007 Millions | |
| Recent Price: 9.86 Smart Investing & Trading Score: 50 | |
| Day Percent Change: -0.10% Day Change: -0.01 | |
| Week Change: 0.1% Year-to-date Change: -0.3% | |
| VGM Links: Profile News Message Board | |
| Charts:- Daily , Weekly | |
| Add VGM to Watchlist: View: Get Complete VGM Trend Analysis ➞ | |
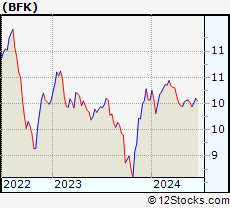 | BFK BlackRock Municipal Income Trust |
| Sector: Financials | |
| SubSector: Closed-End Fund - Debt | |
| MarketCap: 500.707 Millions | |
| Recent Price: 10.07 Smart Investing & Trading Score: 40 | |
| Day Percent Change: 0.20% Day Change: 0.02 | |
| Week Change: 0.1% Year-to-date Change: 0.0% | |
| BFK Links: Profile News Message Board | |
| Charts:- Daily , Weekly | |
| Add BFK to Watchlist: View: Get Complete BFK Trend Analysis ➞ | |
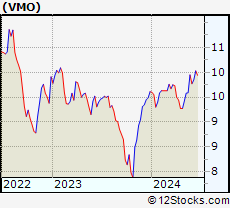 | VMO Invesco Municipal Opportunity Trust |
| Sector: Financials | |
| SubSector: Closed-End Fund - Debt | |
| MarketCap: 698.407 Millions | |
| Recent Price: 9.59 Smart Investing & Trading Score: 55 | |
| Day Percent Change: 0.21% Day Change: 0.02 | |
| Week Change: 0.1% Year-to-date Change: -0.2% | |
| VMO Links: Profile News Message Board | |
| Charts:- Daily , Weekly | |
| Add VMO to Watchlist: View: Get Complete VMO Trend Analysis ➞ | |
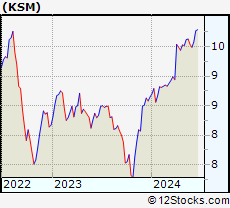 | KSM DWS Strategic Municipal Income Trust |
| Sector: Financials | |
| SubSector: Closed-End Fund - Debt | |
| MarketCap: 103.607 Millions | |
| Recent Price: 9.63 Smart Investing & Trading Score: 58 | |
| Day Percent Change: -0.21% Day Change: -0.02 | |
| Week Change: 0.1% Year-to-date Change: 11.3% | |
| KSM Links: Profile News Message Board | |
| Charts:- Daily , Weekly | |
| Add KSM to Watchlist: View: Get Complete KSM Trend Analysis ➞ | |
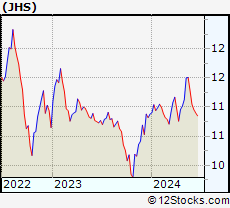 | JHS John Hancock Income Securities Trust |
| Sector: Financials | |
| SubSector: Closed-End Fund - Debt | |
| MarketCap: 137.107 Millions | |
| Recent Price: 11.51 Smart Investing & Trading Score: 69 | |
| Day Percent Change: 0.00% Day Change: 0.00 | |
| Week Change: 0.09% Year-to-date Change: 5.8% | |
| JHS Links: Profile News Message Board | |
| Charts:- Daily , Weekly | |
| Add JHS to Watchlist: View: Get Complete JHS Trend Analysis ➞ | |
| For tabular summary view of above stock list: Summary View ➞ 0 - 25 , 25 - 50 , 50 - 75 , 75 - 100 , 100 - 125 , 125 - 150 , 150 - 175 , 175 - 200 , 200 - 225 , 225 - 250 , 250 - 275 , 275 - 300 , 300 - 325 , 325 - 350 , 350 - 375 , 375 - 400 , 400 - 425 , 425 - 450 , 450 - 475 , 475 - 500 , 500 - 525 , 525 - 550 , 550 - 575 , 575 - 600 , 600 - 625 , 625 - 650 , 650 - 675 , 675 - 700 , 700 - 725 , 725 - 750 , 750 - 775 , 775 - 800 , 800 - 825 , 825 - 850 , 850 - 875 , 875 - 900 , 900 - 925 , 925 - 950 , 950 - 975 , 975 - 1000 , 1000 - 1025 , 1025 - 1050 , 1050 - 1075 , 1075 - 1100 , 1100 - 1125 , 1125 - 1150 , 1150 - 1175 , 1175 - 1200 , 1200 - 1225 | ||
| Click To Change The Sort Order: By Market Cap or Company Size Performance: Year-to-date, Week and Day | |
| Select Chart Type: | ||
|
Best Stocks Today 12Stocks.com |
© 2024 12Stocks.com Terms & Conditions Privacy Contact Us
All Information Provided Only For Education And Not To Be Used For Investing or Trading. See Terms & Conditions


One More Thing ... Get Best Stocks Delivered Daily!
Never Ever Miss A Move With Our Top Ten Stocks Lists
Find Best Stocks In Any Market - Bull or Bear Market
Take A Peek At Our Top Ten Stocks Lists: Daily, Weekly, Year-to-Date & Top Trends
Find Best Stocks In Any Market - Bull or Bear Market
Take A Peek At Our Top Ten Stocks Lists: Daily, Weekly, Year-to-Date & Top Trends
Financial Stocks With Best Up Trends [0-bearish to 100-bullish]: Fangdd Network[100], Xinyuan Real[100], MicroSectors Gold[100], Sprott Physical[100], Citizens & Northern[100], Sumitomo Mitsui[100], First Community[100], Chubb [100], Angel Oak[100], Sprott Physical[100], Iris Energy[100]
Best Financial Stocks Year-to-Date:
Root [526.36%], Fangdd Network[149.63%], Banco Macro[126.41%], Grupo Financiero[112.4%], Banco BBVA[110.66%], SelectQuote [110.22%], Gladstone Capital[106.92%], EverQuote [98.2%], Hippo [92.54%], Grupo Supervielle[86.95%], Vista Oil[60.93%] Best Financial Stocks This Week:
Fangdd Network[360.27%], Xinyuan Real[53.28%], Iris Energy[25.68%], Fathom [25.35%], Huize Holding[21.83%], First Foundation[18.98%], Trupanion [17.21%], Bridge [16.67%], MicroSectors Gold[15.19%], KE [13.86%], Douglas Elliman[13.56%] Best Financial Stocks Daily:
Fangdd Network[321.26%], Xinyuan Real[39.49%], MicroSectors Gold[12.02%], Fathom [9.88%], Citizens [8.53%], Hywin [8.28%], Root [6.10%], First Foundation[6.09%], Sprott Physical[6.09%], Freedom Holding[5.02%], NexGen Energy[4.99%]