
 Login Sign Up


| |||||
 |  | ||||

| 12Stocks.com Market Intelligence |
Best Financial Stocks
| In a hurry? Financial Stocks Lists: Performance Trends Table, Stock Charts
Sort Financial stocks: Daily, Weekly, Year-to-Date, Market Cap & Trends. Filter Financial stocks list by size:All Financial Large Mid-Range Small & MicroCap |
| 12Stocks.com Financial Stocks Performances & Trends Daily | |||||||||
|
|  The overall Smart Investing & Trading Score is 95 (0-bearish to 100-bullish) which puts Financial sector in short term bullish trend. The Smart Investing & Trading Score from previous trading session is 100 and a deterioration of trend continues.
| ||||||||
Here are the Smart Investing & Trading Scores of the most requested Financial stocks at 12Stocks.com (click stock name for detailed review):
|


| 12Stocks.com: Investing in Financial sector with Stocks | |
|
The following table helps investors and traders sort through current performance and trends (as measured by Smart Investing & Trading Score) of various
stocks in the Financial sector. Quick View: Move mouse or cursor over stock symbol (ticker) to view short-term Technical chart and over stock name to view long term chart. Click on  to add stock symbol to your watchlist and to add stock symbol to your watchlist and  to view watchlist. Click on any ticker or stock name for detailed market intelligence report for that stock. to view watchlist. Click on any ticker or stock name for detailed market intelligence report for that stock. |
12Stocks.com Performance of Stocks in Financial Sector
| Ticker | Stock Name | Watchlist | Category | Recent Price | Smart Investing & Trading Score | Change % | Weekly Change% |
| GDL | GDL Fund |   | Closed-End Fund - Equity | 7.94 | 100 | 0.51% | 1.34% |
| SIGIP | Selective Insurance | | Insurance Property & Casualty | 18.53 | 68 | 0.16% | 1.34% |
| GDO | Western Asset | | Asset Mgmt | 12.31 | 57 | 0.08% | 1.32% |
| BANR | Banner | | Regional Banks | 47.06 | 88 | 1.05% | 1.31% |
| BX | Blackstone | | Asset Mgmt | 125.67 | 40 | -1.73% | 1.31% |
| AGM | Federal Agricultural | | Credit Services | 181.84 | 44 | 0.24% | 1.30% |
| BHLB | Berkshire Hills | | S&L | 23.46 | 90 | 0.30% | 1.30% |
| EDD | Morgan Stanley | | Closed-End Fund - Debt | 4.68 | 40 | -0.43% | 1.30% |
| QCRH | QCR | | Regional - Southwest Banks | 59.98 | 95 | -0.12% | 1.30% |
| RWAY | Runway Growth | | Credit Services | 11.72 | 17 | -0.09% | 1.30% |
| CG | Carlyle | | Asset Mgmt | 43.05 | 32 | -0.81% | 1.29% |
| BGB | Blackstone/GSO Strategic | | Closed-End Fund - Debt | 12.13 | 93 | 0.29% | 1.29% |
| UDR | UDR | | REIT | 39.54 | 76 | 0.30% | 1.28% |
| SCD | LMP Capital | | Closed-End Fund - Equity | 15.48 | 81 | 0.29% | 1.28% |
| PAXS | PIMCO Access | | Closed-End Fund - Debt | 15.88 | 83 | 0.19% | 1.28% |
| RMT | Royce Micro-Cap | | Closed-End Fund - Equity | 9.57 | 76 | -0.10% | 1.27% |
| HIG | Hartford | | Insurance | 103.17 | 100 | 0.98% | 1.26% |
| KIM | Kimco Realty | | REIT - Retail | 19.22 | 42 | 0.63% | 1.26% |
| BRX | Brixmor Property | | REIT - Retail | 22.52 | 70 | 1.08% | 1.26% |
| FFC | Flaherty & Crumrine Preferred Securities ome Fund | | Closed-End Fund - Debt | 14.63 | 77 | -0.41% | 1.25% |
| NCV | AllianzGI Convertible | | Closed-End Fund - Debt | 3.24 | 50 | -0.31% | 1.25% |
| SAR | Saratoga | | Investments | 23.41 | 30 | 0.17% | 1.25% |
| UVSP | Univest | | Regional Banks | 22.93 | 90 | 0.57% | 1.24% |
| PNNT | PennantPark | | Asset Mgmt | 7.37 | 75 | 0.96% | 1.24% |
| ACGLO | Arch Capital | | Insurance | 22.94 | 50 | -0.13% | 1.24% |
| For chart view version of above stock list: Chart View ➞ 0 - 25 , 25 - 50 , 50 - 75 , 75 - 100 , 100 - 125 , 125 - 150 , 150 - 175 , 175 - 200 , 200 - 225 , 225 - 250 , 250 - 275 , 275 - 300 , 300 - 325 , 325 - 350 , 350 - 375 , 375 - 400 , 400 - 425 , 425 - 450 , 450 - 475 , 475 - 500 , 500 - 525 , 525 - 550 , 550 - 575 , 575 - 600 , 600 - 625 , 625 - 650 , 650 - 675 , 675 - 700 , 700 - 725 , 725 - 750 , 750 - 775 , 775 - 800 , 800 - 825 , 825 - 850 , 850 - 875 , 875 - 900 , 900 - 925 , 925 - 950 , 950 - 975 , 975 - 1000 , 1000 - 1025 , 1025 - 1050 , 1050 - 1075 , 1075 - 1100 , 1100 - 1125 , 1125 - 1150 , 1150 - 1175 , 1175 - 1200 , 1200 - 1225 | ||
 | Click To Change The Sort Order: By Market Cap or Company Size Performance: Year-to-date, Week and Day |  |
|
Get the most comprehensive stock market coverage daily at 12Stocks.com ➞ Best Stocks Today ➞ Best Stocks Weekly ➞ Best Stocks Year-to-Date ➞ Best Stocks Trends ➞  Best Stocks Today 12Stocks.com Best Nasdaq Stocks ➞ Best S&P 500 Stocks ➞ Best Tech Stocks ➞ Best Biotech Stocks ➞ |
| Detailed Overview of Financial Stocks |
| Financial Technical Overview, Leaders & Laggards, Top Financial ETF Funds & Detailed Financial Stocks List, Charts, Trends & More |
| Financial Sector: Technical Analysis, Trends & YTD Performance | |
| Financial sector is composed of stocks
from banks, brokers, insurance, REITs
and services subsectors. Financial sector, as represented by XLF, an exchange-traded fund [ETF] that holds basket of Financial stocks (e.g, Bank of America, Goldman Sachs) is up by 13.01% and is currently outperforming the overall market by 2.44% year-to-date. Below is a quick view of Technical charts and trends: |
|
 XLF Weekly Chart |
|
| Long Term Trend: Very Good | |
| Medium Term Trend: Very Good | |
 XLF Daily Chart |
|
| Short Term Trend: Very Good | |
| Overall Trend Score: 95 | |
| YTD Performance: 13.01% | |
| **Trend Scores & Views Are Only For Educational Purposes And Not For Investing | |
| 12Stocks.com: Top Performing Financial Sector Stocks | ||||||||||||||||||||||||||||||||||||||||||||||||
 The top performing Financial sector stocks year to date are
Now, more recently, over last week, the top performing Financial sector stocks on the move are


|
||||||||||||||||||||||||||||||||||||||||||||||||
| 12Stocks.com: Investing in Financial Sector using Exchange Traded Funds | |
|
The following table shows list of key exchange traded funds (ETF) that
help investors track Financial Index. For detailed view, check out our ETF Funds section of our website. Quick View: Move mouse or cursor over ETF symbol (ticker) to view short-term Technical chart and over ETF name to view long term chart. Click on ticker or stock name for detailed view. Click on to add stock symbol to your watchlist and to view watchlist. |
12Stocks.com List of ETFs that track Financial Index
| Ticker | ETF Name | Watchlist | Recent Price | Smart Investing & Trading Score | Change % | Week % | Year-to-date % |
| XLF | Financial | | 42.49 | 95 | 0.73 | 1.58 | 13.01% |
| IAI | Broker-Dealers & Secs | | 119.47 | 100 | 1.08 | 2.59 | 10.08% |
| IYF | Financials | | 96.85 | 95 | 0.43 | 1.73 | 13.39% |
| IYG | Financial Services | | 67.11 | 95 | 0.15 | 1.56 | 12.34% |
| KRE | Regional Banking | | 51.19 | 83 | 0.23 | 1.67 | -2.37% |
| IXG | Global Financials | | 88.72 | 88 | 0.21 | 1.41 | 12.91% |
| VFH | Financials | | 103.00 | 95 | 0.18 | 1.45 | 11.64% |
| KBE | Bank | | 47.93 | 83 | 0.44 | 1.25 | 4.15% |
| FAS | Financial Bull 3X | | 112.32 | 95 | 1.81 | 4.06 | 35.9% |
| FAZ | Financial Bear 3X | | 9.75 | 10 | -1.71 | -3.75 | -28.68% |
| UYG | Financials | | 68.54 | 100 | 1.23 | 2.77 | 24.17% |
| IAT | Regional Banks | | 43.42 | 76 | -0.26 | 1.02 | 3.78% |
| KIE | Insurance | | 51.83 | 100 | 0.88 | 1.09 | 14.62% |
| PSCF | SmallCap Financials | | 49.03 | 95 | 0.28 | 1.44 | -0.31% |
| EUFN | Europe Financials | | 24.13 | 95 | 0.67 | 2.51 | 15.12% |
| PGF | Financial Preferred | | 14.81 | 52 | -0.10 | 0.68 | 1.58% |
| 12Stocks.com: Charts, Trends, Fundamental Data and Performances of Financial Stocks | |
|
We now take in-depth look at all Financial stocks including charts, multi-period performances and overall trends (as measured by Smart Investing & Trading Score). One can sort Financial stocks (click link to choose) by Daily, Weekly and by Year-to-Date performances. Also, one can sort by size of the company or by market capitalization. |
| Select Your Default Chart Type: | |||||
| |||||
| Click on stock symbol or name for detailed view. Click on to add stock symbol to your watchlist and to view watchlist. Quick View: Move mouse or cursor over "Daily" to quickly view daily Technical stock chart and over "Weekly" to view weekly Technical stock chart. | |||||

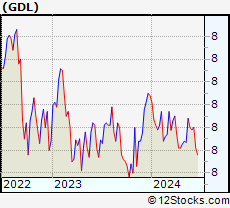 | GDL The GDL Fund |
| Sector: Financials | |
| SubSector: Closed-End Fund - Equity | |
| MarketCap: 104.847 Millions | |
| Recent Price: 7.94 Smart Investing & Trading Score: 100 | |
| Day Percent Change: 0.51% Day Change: 0.04 | |
| Week Change: 1.34% Year-to-date Change: -1.2% | |
| GDL Links: Profile News Message Board | |
| Charts:- Daily , Weekly | |
| Add GDL to Watchlist: View: Get Complete GDL Trend Analysis ➞ | |
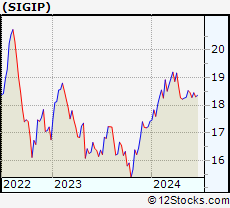 | SIGIP Selective Insurance Group, Inc. |
| Sector: Financials | |
| SubSector: Insurance Property & Casualty | |
| MarketCap: 60157 Millions | |
| Recent Price: 18.53 Smart Investing & Trading Score: 68 | |
| Day Percent Change: 0.16% Day Change: 0.03 | |
| Week Change: 1.34% Year-to-date Change: 6.4% | |
| SIGIP Links: Profile News Message Board | |
| Charts:- Daily , Weekly | |
| Add SIGIP to Watchlist: View: Get Complete SIGIP Trend Analysis ➞ | |
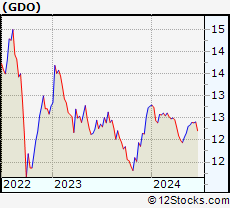 | GDO Western Asset Global Corporate Defined Opportunity Fund Inc. |
| Sector: Financials | |
| SubSector: Asset Management | |
| MarketCap: 194.203 Millions | |
| Recent Price: 12.31 Smart Investing & Trading Score: 57 | |
| Day Percent Change: 0.08% Day Change: 0.01 | |
| Week Change: 1.32% Year-to-date Change: -3.6% | |
| GDO Links: Profile News Message Board | |
| Charts:- Daily , Weekly | |
| Add GDO to Watchlist: View: Get Complete GDO Trend Analysis ➞ | |
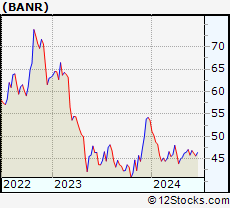 | BANR Banner Corporation |
| Sector: Financials | |
| SubSector: Regional - Mid-Atlantic Banks | |
| MarketCap: 1187.09 Millions | |
| Recent Price: 47.06 Smart Investing & Trading Score: 88 | |
| Day Percent Change: 1.05% Day Change: 0.49 | |
| Week Change: 1.31% Year-to-date Change: -12.1% | |
| BANR Links: Profile News Message Board | |
| Charts:- Daily , Weekly | |
| Add BANR to Watchlist: View: Get Complete BANR Trend Analysis ➞ | |
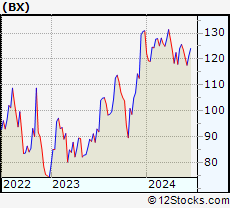 | BX The Blackstone Group Inc. |
| Sector: Financials | |
| SubSector: Asset Management | |
| MarketCap: 50957.7 Millions | |
| Recent Price: 125.67 Smart Investing & Trading Score: 40 | |
| Day Percent Change: -1.73% Day Change: -2.21 | |
| Week Change: 1.31% Year-to-date Change: -4.0% | |
| BX Links: Profile News Message Board | |
| Charts:- Daily , Weekly | |
| Add BX to Watchlist: View: Get Complete BX Trend Analysis ➞ | |
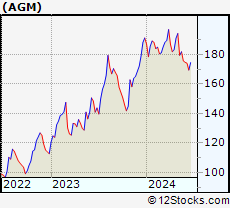 | AGM Federal Agricultural Mortgage Corporation |
| Sector: Financials | |
| SubSector: Credit Services | |
| MarketCap: 542.008 Millions | |
| Recent Price: 181.84 Smart Investing & Trading Score: 44 | |
| Day Percent Change: 0.24% Day Change: 0.44 | |
| Week Change: 1.3% Year-to-date Change: -4.9% | |
| AGM Links: Profile News Message Board | |
| Charts:- Daily , Weekly | |
| Add AGM to Watchlist: View: Get Complete AGM Trend Analysis ➞ | |
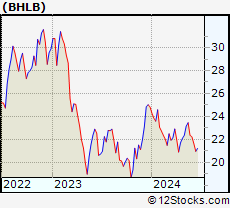 | BHLB Berkshire Hills Bancorp, Inc. |
| Sector: Financials | |
| SubSector: Savings & Loans | |
| MarketCap: 686.33 Millions | |
| Recent Price: 23.46 Smart Investing & Trading Score: 90 | |
| Day Percent Change: 0.30% Day Change: 0.07 | |
| Week Change: 1.3% Year-to-date Change: -5.5% | |
| BHLB Links: Profile News Message Board | |
| Charts:- Daily , Weekly | |
| Add BHLB to Watchlist: View: Get Complete BHLB Trend Analysis ➞ | |
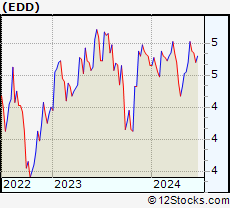 | EDD Morgan Stanley Emerging Markets Domestic Debt Fund, Inc. |
| Sector: Financials | |
| SubSector: Closed-End Fund - Debt | |
| MarketCap: 317.807 Millions | |
| Recent Price: 4.68 Smart Investing & Trading Score: 40 | |
| Day Percent Change: -0.43% Day Change: -0.02 | |
| Week Change: 1.3% Year-to-date Change: 0.4% | |
| EDD Links: Profile News Message Board | |
| Charts:- Daily , Weekly | |
| Add EDD to Watchlist: View: Get Complete EDD Trend Analysis ➞ | |
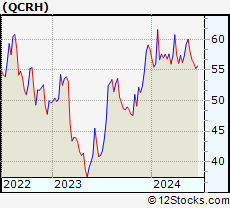 | QCRH QCR Holdings, Inc. |
| Sector: Financials | |
| SubSector: Regional - Southwest Banks | |
| MarketCap: 465.765 Millions | |
| Recent Price: 59.98 Smart Investing & Trading Score: 95 | |
| Day Percent Change: -0.12% Day Change: -0.07 | |
| Week Change: 1.3% Year-to-date Change: 2.7% | |
| QCRH Links: Profile News Message Board | |
| Charts:- Daily , Weekly | |
| Add QCRH to Watchlist: View: Get Complete QCRH Trend Analysis ➞ | |
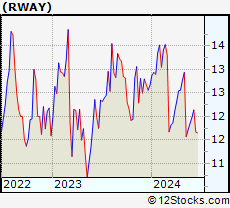 | RWAY Runway Growth Finance Corp. |
| Sector: Financials | |
| SubSector: Credit Services | |
| MarketCap: 497 Millions | |
| Recent Price: 11.72 Smart Investing & Trading Score: 17 | |
| Day Percent Change: -0.09% Day Change: -0.01 | |
| Week Change: 1.3% Year-to-date Change: -7.5% | |
| RWAY Links: Profile News Message Board | |
| Charts:- Daily , Weekly | |
| Add RWAY to Watchlist: View: Get Complete RWAY Trend Analysis ➞ | |
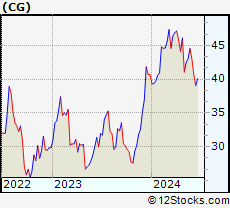 | CG The Carlyle Group Inc. |
| Sector: Financials | |
| SubSector: Asset Management | |
| MarketCap: 7269.33 Millions | |
| Recent Price: 43.05 Smart Investing & Trading Score: 32 | |
| Day Percent Change: -0.81% Day Change: -0.35 | |
| Week Change: 1.29% Year-to-date Change: 5.8% | |
| CG Links: Profile News Message Board | |
| Charts:- Daily , Weekly | |
| Add CG to Watchlist: View: Get Complete CG Trend Analysis ➞ | |
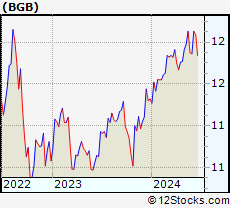 | BGB Blackstone/GSO Strategic Credit Fund |
| Sector: Financials | |
| SubSector: Closed-End Fund - Debt | |
| MarketCap: 435.907 Millions | |
| Recent Price: 12.13 Smart Investing & Trading Score: 93 | |
| Day Percent Change: 0.29% Day Change: 0.04 | |
| Week Change: 1.29% Year-to-date Change: 7.2% | |
| BGB Links: Profile News Message Board | |
| Charts:- Daily , Weekly | |
| Add BGB to Watchlist: View: Get Complete BGB Trend Analysis ➞ | |
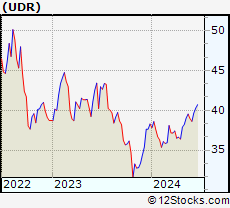 | UDR UDR, Inc. |
| Sector: Financials | |
| SubSector: REIT - Residential | |
| MarketCap: 10180.1 Millions | |
| Recent Price: 39.54 Smart Investing & Trading Score: 76 | |
| Day Percent Change: 0.30% Day Change: 0.12 | |
| Week Change: 1.28% Year-to-date Change: 3.3% | |
| UDR Links: Profile News Message Board | |
| Charts:- Daily , Weekly | |
| Add UDR to Watchlist: View: Get Complete UDR Trend Analysis ➞ | |
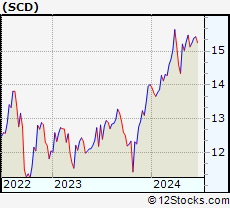 | SCD LMP Capital and Income Fund Inc. |
| Sector: Financials | |
| SubSector: Closed-End Fund - Equity | |
| MarketCap: 124.747 Millions | |
| Recent Price: 15.48 Smart Investing & Trading Score: 81 | |
| Day Percent Change: 0.29% Day Change: 0.04 | |
| Week Change: 1.28% Year-to-date Change: 10.5% | |
| SCD Links: Profile News Message Board | |
| Charts:- Daily , Weekly | |
| Add SCD to Watchlist: View: Get Complete SCD Trend Analysis ➞ | |
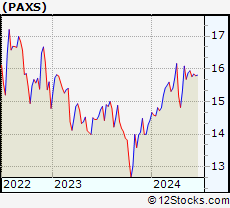 | PAXS PIMCO Access Income Fund |
| Sector: Financials | |
| SubSector: Closed-End Fund - Debt | |
| MarketCap: 649 Millions | |
| Recent Price: 15.88 Smart Investing & Trading Score: 83 | |
| Day Percent Change: 0.19% Day Change: 0.03 | |
| Week Change: 1.28% Year-to-date Change: 10.1% | |
| PAXS Links: Profile News Message Board | |
| Charts:- Daily , Weekly | |
| Add PAXS to Watchlist: View: Get Complete PAXS Trend Analysis ➞ | |
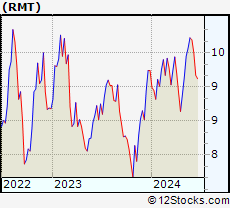 | RMT Royce Micro-Cap Trust, Inc. |
| Sector: Financials | |
| SubSector: Closed-End Fund - Equity | |
| MarketCap: 195.647 Millions | |
| Recent Price: 9.57 Smart Investing & Trading Score: 76 | |
| Day Percent Change: -0.10% Day Change: -0.01 | |
| Week Change: 1.27% Year-to-date Change: 3.6% | |
| RMT Links: Profile News Message Board | |
| Charts:- Daily , Weekly | |
| Add RMT to Watchlist: View: Get Complete RMT Trend Analysis ➞ | |
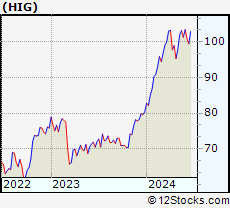 | HIG The Hartford Financial Services Group, Inc. |
| Sector: Financials | |
| SubSector: Property & Casualty Insurance | |
| MarketCap: 12582.8 Millions | |
| Recent Price: 103.17 Smart Investing & Trading Score: 100 | |
| Day Percent Change: 0.98% Day Change: 1.00 | |
| Week Change: 1.26% Year-to-date Change: 28.4% | |
| HIG Links: Profile News Message Board | |
| Charts:- Daily , Weekly | |
| Add HIG to Watchlist: View: Get Complete HIG Trend Analysis ➞ | |
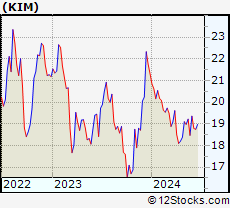 | KIM Kimco Realty Corporation |
| Sector: Financials | |
| SubSector: REIT - Retail | |
| MarketCap: 5358.64 Millions | |
| Recent Price: 19.22 Smart Investing & Trading Score: 42 | |
| Day Percent Change: 0.63% Day Change: 0.12 | |
| Week Change: 1.26% Year-to-date Change: -9.8% | |
| KIM Links: Profile News Message Board | |
| Charts:- Daily , Weekly | |
| Add KIM to Watchlist: View: Get Complete KIM Trend Analysis ➞ | |
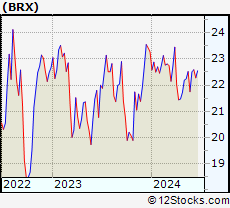 | BRX Brixmor Property Group Inc. |
| Sector: Financials | |
| SubSector: REIT - Retail | |
| MarketCap: 3561.54 Millions | |
| Recent Price: 22.52 Smart Investing & Trading Score: 70 | |
| Day Percent Change: 1.08% Day Change: 0.24 | |
| Week Change: 1.26% Year-to-date Change: -3.2% | |
| BRX Links: Profile News Message Board | |
| Charts:- Daily , Weekly | |
| Add BRX to Watchlist: View: Get Complete BRX Trend Analysis ➞ | |
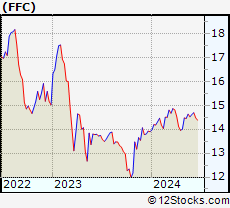 | FFC Flaherty & Crumrine Preferred Securities Income Fund Inc. |
| Sector: Financials | |
| SubSector: Closed-End Fund - Debt | |
| MarketCap: 635.107 Millions | |
| Recent Price: 14.63 Smart Investing & Trading Score: 77 | |
| Day Percent Change: -0.41% Day Change: -0.06 | |
| Week Change: 1.25% Year-to-date Change: 5.3% | |
| FFC Links: Profile News Message Board | |
| Charts:- Daily , Weekly | |
| Add FFC to Watchlist: View: Get Complete FFC Trend Analysis ➞ | |
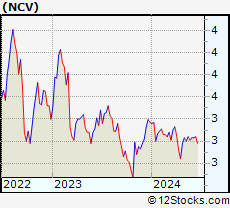 | NCV AllianzGI Convertible & Income Fund |
| Sector: Financials | |
| SubSector: Closed-End Fund - Debt | |
| MarketCap: 303.307 Millions | |
| Recent Price: 3.24 Smart Investing & Trading Score: 50 | |
| Day Percent Change: -0.31% Day Change: -0.01 | |
| Week Change: 1.25% Year-to-date Change: -3.9% | |
| NCV Links: Profile News Message Board | |
| Charts:- Daily , Weekly | |
| Add NCV to Watchlist: View: Get Complete NCV Trend Analysis ➞ | |
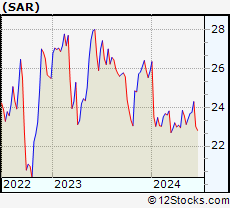 | SAR Saratoga Investment Corp. |
| Sector: Financials | |
| SubSector: Diversified Investments | |
| MarketCap: 132.67 Millions | |
| Recent Price: 23.41 Smart Investing & Trading Score: 30 | |
| Day Percent Change: 0.17% Day Change: 0.04 | |
| Week Change: 1.25% Year-to-date Change: -9.5% | |
| SAR Links: Profile News Message Board | |
| Charts:- Daily , Weekly | |
| Add SAR to Watchlist: View: Get Complete SAR Trend Analysis ➞ | |
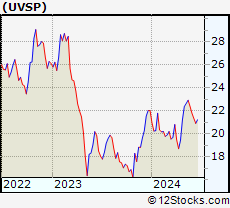 | UVSP Univest Financial Corporation |
| Sector: Financials | |
| SubSector: Regional - Northeast Banks | |
| MarketCap: 467.999 Millions | |
| Recent Price: 22.93 Smart Investing & Trading Score: 90 | |
| Day Percent Change: 0.57% Day Change: 0.13 | |
| Week Change: 1.24% Year-to-date Change: 4.1% | |
| UVSP Links: Profile News Message Board | |
| Charts:- Daily , Weekly | |
| Add UVSP to Watchlist: View: Get Complete UVSP Trend Analysis ➞ | |
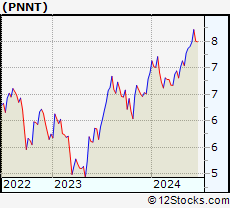 | PNNT PennantPark Investment Corporation |
| Sector: Financials | |
| SubSector: Asset Management | |
| MarketCap: 157.503 Millions | |
| Recent Price: 7.37 Smart Investing & Trading Score: 75 | |
| Day Percent Change: 0.96% Day Change: 0.07 | |
| Week Change: 1.24% Year-to-date Change: 6.7% | |
| PNNT Links: Profile News Message Board | |
| Charts:- Daily , Weekly | |
| Add PNNT to Watchlist: View: Get Complete PNNT Trend Analysis ➞ | |
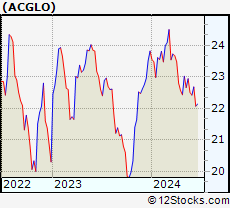 | ACGLO Arch Capital Group Ltd. |
| Sector: Financials | |
| SubSector: Insurance Brokers | |
| MarketCap: 7204.57 Millions | |
| Recent Price: 22.94 Smart Investing & Trading Score: 50 | |
| Day Percent Change: -0.13% Day Change: -0.03 | |
| Week Change: 1.24% Year-to-date Change: -3.7% | |
| ACGLO Links: Profile News Message Board | |
| Charts:- Daily , Weekly | |
| Add ACGLO to Watchlist: View: Get Complete ACGLO Trend Analysis ➞ | |
| For tabular summary view of above stock list: Summary View ➞ 0 - 25 , 25 - 50 , 50 - 75 , 75 - 100 , 100 - 125 , 125 - 150 , 150 - 175 , 175 - 200 , 200 - 225 , 225 - 250 , 250 - 275 , 275 - 300 , 300 - 325 , 325 - 350 , 350 - 375 , 375 - 400 , 400 - 425 , 425 - 450 , 450 - 475 , 475 - 500 , 500 - 525 , 525 - 550 , 550 - 575 , 575 - 600 , 600 - 625 , 625 - 650 , 650 - 675 , 675 - 700 , 700 - 725 , 725 - 750 , 750 - 775 , 775 - 800 , 800 - 825 , 825 - 850 , 850 - 875 , 875 - 900 , 900 - 925 , 925 - 950 , 950 - 975 , 975 - 1000 , 1000 - 1025 , 1025 - 1050 , 1050 - 1075 , 1075 - 1100 , 1100 - 1125 , 1125 - 1150 , 1150 - 1175 , 1175 - 1200 , 1200 - 1225 | ||
| Click To Change The Sort Order: By Market Cap or Company Size Performance: Year-to-date, Week and Day | |
| Select Chart Type: | ||
|
Best Stocks Today 12Stocks.com |
© 2024 12Stocks.com Terms & Conditions Privacy Contact Us
All Information Provided Only For Education And Not To Be Used For Investing or Trading. See Terms & Conditions


One More Thing ... Get Best Stocks Delivered Daily!
Never Ever Miss A Move With Our Top Ten Stocks Lists
Find Best Stocks In Any Market - Bull or Bear Market
Take A Peek At Our Top Ten Stocks Lists: Daily, Weekly, Year-to-Date & Top Trends
Find Best Stocks In Any Market - Bull or Bear Market
Take A Peek At Our Top Ten Stocks Lists: Daily, Weekly, Year-to-Date & Top Trends
Financial Stocks With Best Up Trends [0-bearish to 100-bullish]: Fangdd Network[100], Xinyuan Real[100], MicroSectors Gold[100], Sprott Physical[100], Citizens & Northern[100], Sumitomo Mitsui[100], First Community[100], Chubb [100], Angel Oak[100], Sprott Physical[100], Iris Energy[100]
Best Financial Stocks Year-to-Date:
Root [526.36%], Fangdd Network[149.63%], Banco Macro[126.41%], Grupo Financiero[112.4%], Banco BBVA[110.66%], SelectQuote [110.22%], Gladstone Capital[106.92%], EverQuote [98.2%], Hippo [92.54%], Grupo Supervielle[86.95%], Vista Oil[60.93%] Best Financial Stocks This Week:
Fangdd Network[360.27%], Xinyuan Real[53.28%], Iris Energy[25.68%], Fathom [25.35%], Huize Holding[21.83%], First Foundation[18.98%], Trupanion [17.21%], Bridge [16.67%], MicroSectors Gold[15.19%], KE [13.86%], Douglas Elliman[13.56%] Best Financial Stocks Daily:
Fangdd Network[321.26%], Xinyuan Real[39.49%], MicroSectors Gold[12.02%], Fathom [9.88%], Citizens [8.53%], Hywin [8.28%], Root [6.10%], First Foundation[6.09%], Sprott Physical[6.09%], Freedom Holding[5.02%], NexGen Energy[4.99%]