
 Login Sign Up


| |||||
 |  | ||||

| 12Stocks.com Market Intelligence |
Best Financial Stocks
| In a hurry? Financial Stocks Lists: Performance Trends Table, Stock Charts
Sort Financial stocks: Daily, Weekly, Year-to-Date, Market Cap & Trends. Filter Financial stocks list by size:All Financial Large Mid-Range Small & MicroCap |
| 12Stocks.com Financial Stocks Performances & Trends Daily | |||||||||
|
|  The overall Smart Investing & Trading Score is 95 (0-bearish to 100-bullish) which puts Financial sector in short term bullish trend. The Smart Investing & Trading Score from previous trading session is 100 and a deterioration of trend continues.
| ||||||||
Here are the Smart Investing & Trading Scores of the most requested Financial stocks at 12Stocks.com (click stock name for detailed review):
|


| 12Stocks.com: Investing in Financial sector with Stocks | |
|
The following table helps investors and traders sort through current performance and trends (as measured by Smart Investing & Trading Score) of various
stocks in the Financial sector. Quick View: Move mouse or cursor over stock symbol (ticker) to view short-term Technical chart and over stock name to view long term chart. Click on  to add stock symbol to your watchlist and to add stock symbol to your watchlist and  to view watchlist. Click on any ticker or stock name for detailed market intelligence report for that stock. to view watchlist. Click on any ticker or stock name for detailed market intelligence report for that stock. |
12Stocks.com Performance of Stocks in Financial Sector
| Ticker | Stock Name | Watchlist | Category | Recent Price | Smart Investing & Trading Score | Change % | Weekly Change% |
| TWN | Taiwan Fund |   | Closed-End Fund - Foreign | 39.99 | 83 | 0.69% | 1.96% |
| BHK | BlackRock Core | | Closed-End Fund - Debt | 10.64 | 100 | 0.28% | 1.96% |
| TWO | Two Harbors | | Mortgage | 13.03 | 88 | 0.39% | 1.96% |
| USCB | USCB | | Banks - Regional | 12.49 | 88 | 1.88% | 1.96% |
| BLK | BlackRock | | Asset Mgmt | 812.22 | 70 | 0.56% | 1.95% |
| NYMT | New York | | Mortgage | 6.27 | 42 | -0.95% | 1.95% |
| TPVG | TriplePoint Venture | | Closed-End Fund - Equity | 9.40 | 59 | 2.62% | 1.95% |
| AMH | American Homes | | REIT | 36.77 | 87 | 0.88% | 1.94% |
| WTBA | West Ban | | Regional - Southwest Banks | 17.87 | 90 | -0.72% | 1.94% |
| NBXG | Neuberger Berman | | Closed-End Fund - Equity | 12.11 | 78 | 0.25% | 1.94% |
| LKFN | Lakeland | | Regional Banks | 63.24 | 82 | 0.68% | 1.93% |
| PRI | Primerica | | Life Insurance | 228.08 | 59 | 1.67% | 1.93% |
| INVH | Invitation Homes | | Real Estatet | 35.45 | 88 | 0.68% | 1.93% |
| AIF | Apollo Tactical | | Asset Mgmt | 14.78 | 57 | 0.48% | 1.93% |
| RPAR | RPAR Risk | | Exchange Traded Fund | 19.54 | 88 | 0.27% | 1.93% |
| CET | Central Securities | | Asset Mgmt | 42.51 | 100 | 0.21% | 1.92% |
| SPUS | SP Funds | | Exchange Traded Fund | 38.38 | 78 | -0.05% | 1.91% |
| OZ | Belpointe PREP | | Financials - Development | 60.00 | 45 | 1.66% | 1.91% |
| NLY | Annaly Capital | | Mortgage | 20.35 | 83 | 0.15% | 1.90% |
| WAL | Western Alliance | | Regional Banks | 64.96 | 83 | 0.79% | 1.90% |
| SFBS | ServisFirst Bancshares | | Foreign Banks | 66.00 | 83 | 1.16% | 1.90% |
| FAM | First Trust/Aberdeen | | Closed-End Fund - Debt | 6.47 | 83 | 0.31% | 1.89% |
| GAM | General American | | Closed-End Fund - Equity | 48.55 | 100 | 0.79% | 1.89% |
| JCE | Nuveen Core | | Closed-End Fund - Equity | 14.32 | 88 | 0.28% | 1.89% |
| ADX | Adams Diversified | | Closed-End Fund - Equity | 20.06 | 88 | 0.05% | 1.88% |
| For chart view version of above stock list: Chart View ➞ 0 - 25 , 25 - 50 , 50 - 75 , 75 - 100 , 100 - 125 , 125 - 150 , 150 - 175 , 175 - 200 , 200 - 225 , 225 - 250 , 250 - 275 , 275 - 300 , 300 - 325 , 325 - 350 , 350 - 375 , 375 - 400 , 400 - 425 , 425 - 450 , 450 - 475 , 475 - 500 , 500 - 525 , 525 - 550 , 550 - 575 , 575 - 600 , 600 - 625 , 625 - 650 , 650 - 675 , 675 - 700 , 700 - 725 , 725 - 750 , 750 - 775 , 775 - 800 , 800 - 825 , 825 - 850 , 850 - 875 , 875 - 900 , 900 - 925 , 925 - 950 , 950 - 975 , 975 - 1000 , 1000 - 1025 , 1025 - 1050 , 1050 - 1075 , 1075 - 1100 , 1100 - 1125 , 1125 - 1150 , 1150 - 1175 , 1175 - 1200 , 1200 - 1225 | ||
 | Click To Change The Sort Order: By Market Cap or Company Size Performance: Year-to-date, Week and Day |  |
|
Get the most comprehensive stock market coverage daily at 12Stocks.com ➞ Best Stocks Today ➞ Best Stocks Weekly ➞ Best Stocks Year-to-Date ➞ Best Stocks Trends ➞  Best Stocks Today 12Stocks.com Best Nasdaq Stocks ➞ Best S&P 500 Stocks ➞ Best Tech Stocks ➞ Best Biotech Stocks ➞ |
| Detailed Overview of Financial Stocks |
| Financial Technical Overview, Leaders & Laggards, Top Financial ETF Funds & Detailed Financial Stocks List, Charts, Trends & More |
| Financial Sector: Technical Analysis, Trends & YTD Performance | |
| Financial sector is composed of stocks
from banks, brokers, insurance, REITs
and services subsectors. Financial sector, as represented by XLF, an exchange-traded fund [ETF] that holds basket of Financial stocks (e.g, Bank of America, Goldman Sachs) is up by 13.01% and is currently outperforming the overall market by 2.44% year-to-date. Below is a quick view of Technical charts and trends: |
|
 XLF Weekly Chart |
|
| Long Term Trend: Very Good | |
| Medium Term Trend: Very Good | |
 XLF Daily Chart |
|
| Short Term Trend: Very Good | |
| Overall Trend Score: 95 | |
| YTD Performance: 13.01% | |
| **Trend Scores & Views Are Only For Educational Purposes And Not For Investing | |
| 12Stocks.com: Top Performing Financial Sector Stocks | ||||||||||||||||||||||||||||||||||||||||||||||||
 The top performing Financial sector stocks year to date are
Now, more recently, over last week, the top performing Financial sector stocks on the move are


|
||||||||||||||||||||||||||||||||||||||||||||||||
| 12Stocks.com: Investing in Financial Sector using Exchange Traded Funds | |
|
The following table shows list of key exchange traded funds (ETF) that
help investors track Financial Index. For detailed view, check out our ETF Funds section of our website. Quick View: Move mouse or cursor over ETF symbol (ticker) to view short-term Technical chart and over ETF name to view long term chart. Click on ticker or stock name for detailed view. Click on to add stock symbol to your watchlist and to view watchlist. |
12Stocks.com List of ETFs that track Financial Index
| Ticker | ETF Name | Watchlist | Recent Price | Smart Investing & Trading Score | Change % | Week % | Year-to-date % |
| XLF | Financial | | 42.49 | 95 | 0.73 | 1.58 | 13.01% |
| IAI | Broker-Dealers & Secs | | 119.47 | 100 | 1.08 | 2.59 | 10.08% |
| IYF | Financials | | 96.85 | 95 | 0.43 | 1.73 | 13.39% |
| IYG | Financial Services | | 67.11 | 95 | 0.15 | 1.56 | 12.34% |
| KRE | Regional Banking | | 51.19 | 83 | 0.23 | 1.67 | -2.37% |
| IXG | Global Financials | | 88.72 | 88 | 0.21 | 1.41 | 12.91% |
| VFH | Financials | | 103.00 | 95 | 0.18 | 1.45 | 11.64% |
| KBE | Bank | | 47.93 | 83 | 0.44 | 1.25 | 4.15% |
| FAS | Financial Bull 3X | | 112.32 | 95 | 1.81 | 4.06 | 35.9% |
| FAZ | Financial Bear 3X | | 9.75 | 10 | -1.71 | -3.75 | -28.68% |
| UYG | Financials | | 68.54 | 100 | 1.23 | 2.77 | 24.17% |
| IAT | Regional Banks | | 43.42 | 76 | -0.26 | 1.02 | 3.78% |
| KIE | Insurance | | 51.83 | 100 | 0.88 | 1.09 | 14.62% |
| PSCF | SmallCap Financials | | 49.03 | 95 | 0.28 | 1.44 | -0.31% |
| EUFN | Europe Financials | | 24.13 | 95 | 0.67 | 2.51 | 15.12% |
| PGF | Financial Preferred | | 14.81 | 52 | -0.10 | 0.68 | 1.58% |
| 12Stocks.com: Charts, Trends, Fundamental Data and Performances of Financial Stocks | |
|
We now take in-depth look at all Financial stocks including charts, multi-period performances and overall trends (as measured by Smart Investing & Trading Score). One can sort Financial stocks (click link to choose) by Daily, Weekly and by Year-to-Date performances. Also, one can sort by size of the company or by market capitalization. |
| Select Your Default Chart Type: | |||||
| |||||
| Click on stock symbol or name for detailed view. Click on to add stock symbol to your watchlist and to view watchlist. Quick View: Move mouse or cursor over "Daily" to quickly view daily Technical stock chart and over "Weekly" to view weekly Technical stock chart. | |||||

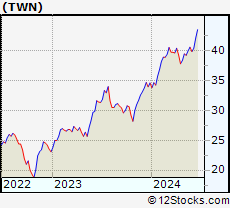 | TWN The Taiwan Fund, Inc. |
| Sector: Financials | |
| SubSector: Closed-End Fund - Foreign | |
| MarketCap: 110.547 Millions | |
| Recent Price: 39.99 Smart Investing & Trading Score: 83 | |
| Day Percent Change: 0.69% Day Change: 0.27 | |
| Week Change: 1.96% Year-to-date Change: 15.6% | |
| TWN Links: Profile News Message Board | |
| Charts:- Daily , Weekly | |
| Add TWN to Watchlist: View: Get Complete TWN Trend Analysis ➞ | |
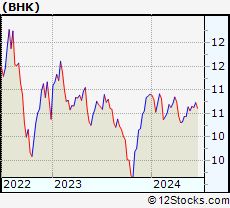 | BHK BlackRock Core Bond Trust |
| Sector: Financials | |
| SubSector: Closed-End Fund - Debt | |
| MarketCap: 646.607 Millions | |
| Recent Price: 10.64 Smart Investing & Trading Score: 100 | |
| Day Percent Change: 0.28% Day Change: 0.03 | |
| Week Change: 1.96% Year-to-date Change: -2.5% | |
| BHK Links: Profile News Message Board | |
| Charts:- Daily , Weekly | |
| Add BHK to Watchlist: View: Get Complete BHK Trend Analysis ➞ | |
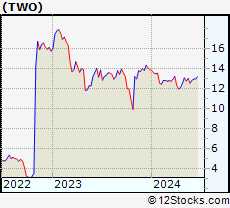 | TWO Two Harbors Investment Corp. |
| Sector: Financials | |
| SubSector: Mortgage Investment | |
| MarketCap: 1979.59 Millions | |
| Recent Price: 13.03 Smart Investing & Trading Score: 88 | |
| Day Percent Change: 0.39% Day Change: 0.05 | |
| Week Change: 1.96% Year-to-date Change: -6.5% | |
| TWO Links: Profile News Message Board | |
| Charts:- Daily , Weekly | |
| Add TWO to Watchlist: View: Get Complete TWO Trend Analysis ➞ | |
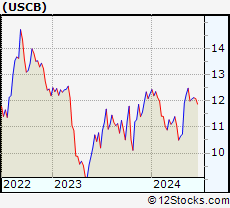 | USCB USCB Financial Holdings, Inc. |
| Sector: Financials | |
| SubSector: Banks - Regional | |
| MarketCap: 198 Millions | |
| Recent Price: 12.49 Smart Investing & Trading Score: 88 | |
| Day Percent Change: 1.88% Day Change: 0.23 | |
| Week Change: 1.96% Year-to-date Change: 1.7% | |
| USCB Links: Profile News Message Board | |
| Charts:- Daily , Weekly | |
| Add USCB to Watchlist: View: Get Complete USCB Trend Analysis ➞ | |
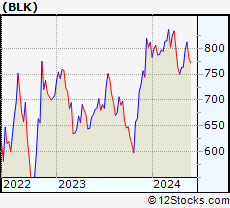 | BLK BlackRock, Inc. |
| Sector: Financials | |
| SubSector: Asset Management | |
| MarketCap: 61284.9 Millions | |
| Recent Price: 812.22 Smart Investing & Trading Score: 70 | |
| Day Percent Change: 0.56% Day Change: 4.51 | |
| Week Change: 1.95% Year-to-date Change: 0.1% | |
| BLK Links: Profile News Message Board | |
| Charts:- Daily , Weekly | |
| Add BLK to Watchlist: View: Get Complete BLK Trend Analysis ➞ | |
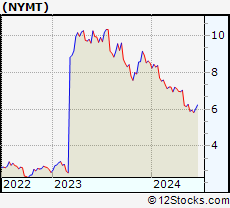 | NYMT New York Mortgage Trust, Inc. |
| Sector: Financials | |
| SubSector: Mortgage Investment | |
| MarketCap: 1038.39 Millions | |
| Recent Price: 6.27 Smart Investing & Trading Score: 42 | |
| Day Percent Change: -0.95% Day Change: -0.06 | |
| Week Change: 1.95% Year-to-date Change: -26.5% | |
| NYMT Links: Profile News Message Board | |
| Charts:- Daily , Weekly | |
| Add NYMT to Watchlist: View: Get Complete NYMT Trend Analysis ➞ | |
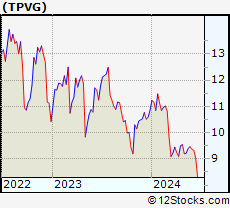 | TPVG TriplePoint Venture Growth BDC Corp. |
| Sector: Financials | |
| SubSector: Closed-End Fund - Equity | |
| MarketCap: 158.147 Millions | |
| Recent Price: 9.40 Smart Investing & Trading Score: 59 | |
| Day Percent Change: 2.62% Day Change: 0.24 | |
| Week Change: 1.95% Year-to-date Change: -13.4% | |
| TPVG Links: Profile News Message Board | |
| Charts:- Daily , Weekly | |
| Add TPVG to Watchlist: View: Get Complete TPVG Trend Analysis ➞ | |
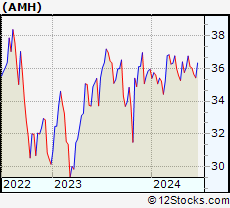 | AMH American Homes 4 Rent |
| Sector: Financials | |
| SubSector: REIT - Residential | |
| MarketCap: 6135.31 Millions | |
| Recent Price: 36.77 Smart Investing & Trading Score: 87 | |
| Day Percent Change: 0.88% Day Change: 0.32 | |
| Week Change: 1.94% Year-to-date Change: 2.3% | |
| AMH Links: Profile News Message Board | |
| Charts:- Daily , Weekly | |
| Add AMH to Watchlist: View: Get Complete AMH Trend Analysis ➞ | |
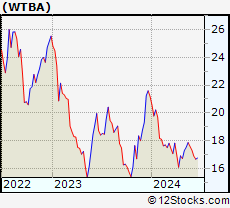 | WTBA West Bancorporation, Inc. |
| Sector: Financials | |
| SubSector: Regional - Southwest Banks | |
| MarketCap: 272.965 Millions | |
| Recent Price: 17.87 Smart Investing & Trading Score: 90 | |
| Day Percent Change: -0.72% Day Change: -0.13 | |
| Week Change: 1.94% Year-to-date Change: -15.7% | |
| WTBA Links: Profile News Message Board | |
| Charts:- Daily , Weekly | |
| Add WTBA to Watchlist: View: Get Complete WTBA Trend Analysis ➞ | |
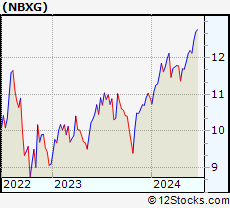 | NBXG Neuberger Berman Next Generation Connectivity Fund Inc. |
| Sector: Financials | |
| SubSector: Closed-End Fund - Equity | |
| MarketCap: 859 Millions | |
| Recent Price: 12.11 Smart Investing & Trading Score: 78 | |
| Day Percent Change: 0.25% Day Change: 0.03 | |
| Week Change: 1.94% Year-to-date Change: 11.0% | |
| NBXG Links: Profile News Message Board | |
| Charts:- Daily , Weekly | |
| Add NBXG to Watchlist: View: Get Complete NBXG Trend Analysis ➞ | |
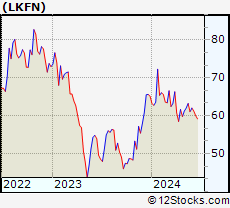 | LKFN Lakeland Financial Corporation |
| Sector: Financials | |
| SubSector: Regional - Midwest Banks | |
| MarketCap: 903.27 Millions | |
| Recent Price: 63.24 Smart Investing & Trading Score: 82 | |
| Day Percent Change: 0.68% Day Change: 0.43 | |
| Week Change: 1.93% Year-to-date Change: -3.0% | |
| LKFN Links: Profile News Message Board | |
| Charts:- Daily , Weekly | |
| Add LKFN to Watchlist: View: Get Complete LKFN Trend Analysis ➞ | |
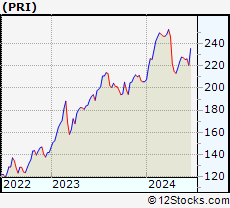 | PRI Primerica, Inc. |
| Sector: Financials | |
| SubSector: Life Insurance | |
| MarketCap: 2782.06 Millions | |
| Recent Price: 228.08 Smart Investing & Trading Score: 59 | |
| Day Percent Change: 1.67% Day Change: 3.75 | |
| Week Change: 1.93% Year-to-date Change: 10.9% | |
| PRI Links: Profile News Message Board | |
| Charts:- Daily , Weekly | |
| Add PRI to Watchlist: View: Get Complete PRI Trend Analysis ➞ | |
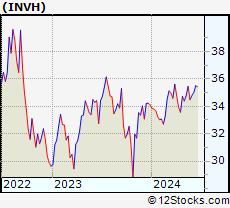 | INVH Invitation Homes Inc. |
| Sector: Financials | |
| SubSector: Real Estate Development | |
| MarketCap: 9782.89 Millions | |
| Recent Price: 35.45 Smart Investing & Trading Score: 88 | |
| Day Percent Change: 0.68% Day Change: 0.24 | |
| Week Change: 1.93% Year-to-date Change: 3.9% | |
| INVH Links: Profile News Message Board | |
| Charts:- Daily , Weekly | |
| Add INVH to Watchlist: View: Get Complete INVH Trend Analysis ➞ | |
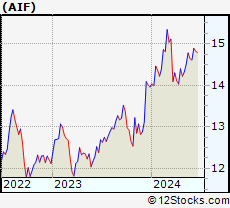 | AIF Apollo Tactical Income Fund Inc. |
| Sector: Financials | |
| SubSector: Asset Management | |
| MarketCap: 146.803 Millions | |
| Recent Price: 14.78 Smart Investing & Trading Score: 57 | |
| Day Percent Change: 0.48% Day Change: 0.07 | |
| Week Change: 1.93% Year-to-date Change: 5.9% | |
| AIF Links: Profile News Message Board | |
| Charts:- Daily , Weekly | |
| Add AIF to Watchlist: View: Get Complete AIF Trend Analysis ➞ | |
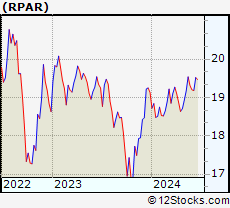 | RPAR RPAR Risk Parity ETF |
| Sector: Financials | |
| SubSector: Exchange Traded Fund | |
| MarketCap: 60157 Millions | |
| Recent Price: 19.54 Smart Investing & Trading Score: 88 | |
| Day Percent Change: 0.27% Day Change: 0.05 | |
| Week Change: 1.93% Year-to-date Change: 2.1% | |
| RPAR Links: Profile News Message Board | |
| Charts:- Daily , Weekly | |
| Add RPAR to Watchlist: View: Get Complete RPAR Trend Analysis ➞ | |
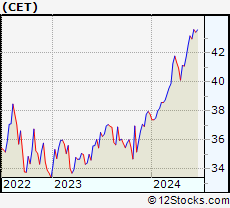 | CET Central Securities Corp. |
| Sector: Financials | |
| SubSector: Asset Management | |
| MarketCap: 574.703 Millions | |
| Recent Price: 42.51 Smart Investing & Trading Score: 100 | |
| Day Percent Change: 0.21% Day Change: 0.09 | |
| Week Change: 1.92% Year-to-date Change: 12.6% | |
| CET Links: Profile News Message Board | |
| Charts:- Daily , Weekly | |
| Add CET to Watchlist: View: Get Complete CET Trend Analysis ➞ | |
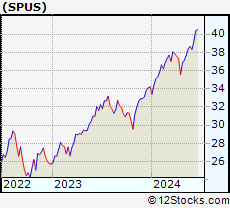 | SPUS SP Funds S&P 500 Sharia Industry Exclusions ETF |
| Sector: Financials | |
| SubSector: Exchange Traded Fund | |
| MarketCap: 60157 Millions | |
| Recent Price: 38.38 Smart Investing & Trading Score: 78 | |
| Day Percent Change: -0.05% Day Change: -0.02 | |
| Week Change: 1.91% Year-to-date Change: 12.2% | |
| SPUS Links: Profile News Message Board | |
| Charts:- Daily , Weekly | |
| Add SPUS to Watchlist: View: Get Complete SPUS Trend Analysis ➞ | |
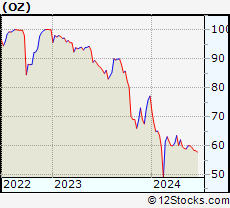 | OZ Belpointe PREP, LLC |
| Sector: Financials | |
| SubSector: Financials - Development | |
| MarketCap: 315 Millions | |
| Recent Price: 60.00 Smart Investing & Trading Score: 45 | |
| Day Percent Change: 1.66% Day Change: 0.98 | |
| Week Change: 1.91% Year-to-date Change: -22.2% | |
| OZ Links: Profile News Message Board | |
| Charts:- Daily , Weekly | |
| Add OZ to Watchlist: View: Get Complete OZ Trend Analysis ➞ | |
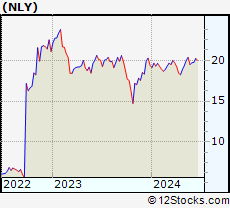 | NLY Annaly Capital Management, Inc. |
| Sector: Financials | |
| SubSector: Mortgage Investment | |
| MarketCap: 9127.79 Millions | |
| Recent Price: 20.35 Smart Investing & Trading Score: 83 | |
| Day Percent Change: 0.15% Day Change: 0.03 | |
| Week Change: 1.9% Year-to-date Change: 5.1% | |
| NLY Links: Profile News Message Board | |
| Charts:- Daily , Weekly | |
| Add NLY to Watchlist: View: Get Complete NLY Trend Analysis ➞ | |
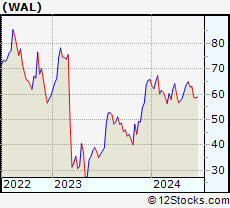 | WAL Western Alliance Bancorporation |
| Sector: Financials | |
| SubSector: Regional - Pacific Banks | |
| MarketCap: 2980.09 Millions | |
| Recent Price: 64.96 Smart Investing & Trading Score: 83 | |
| Day Percent Change: 0.79% Day Change: 0.51 | |
| Week Change: 1.9% Year-to-date Change: -1.3% | |
| WAL Links: Profile News Message Board | |
| Charts:- Daily , Weekly | |
| Add WAL to Watchlist: View: Get Complete WAL Trend Analysis ➞ | |
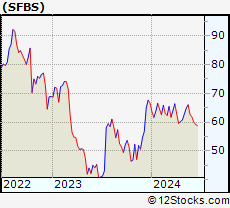 | SFBS ServisFirst Bancshares, Inc. |
| Sector: Financials | |
| SubSector: Foreign Money Center Banks | |
| MarketCap: 1596.71 Millions | |
| Recent Price: 66.00 Smart Investing & Trading Score: 83 | |
| Day Percent Change: 1.16% Day Change: 0.76 | |
| Week Change: 1.9% Year-to-date Change: -1.0% | |
| SFBS Links: Profile News Message Board | |
| Charts:- Daily , Weekly | |
| Add SFBS to Watchlist: View: Get Complete SFBS Trend Analysis ➞ | |
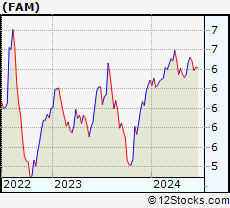 | FAM First Trust/Aberdeen Global Opportunity Income Fund |
| Sector: Financials | |
| SubSector: Closed-End Fund - Debt | |
| MarketCap: 103.307 Millions | |
| Recent Price: 6.47 Smart Investing & Trading Score: 83 | |
| Day Percent Change: 0.31% Day Change: 0.02 | |
| Week Change: 1.89% Year-to-date Change: 2.9% | |
| FAM Links: Profile News Message Board | |
| Charts:- Daily , Weekly | |
| Add FAM to Watchlist: View: Get Complete FAM Trend Analysis ➞ | |
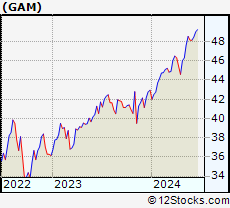 | GAM General American Investors Company, Inc. |
| Sector: Financials | |
| SubSector: Closed-End Fund - Equity | |
| MarketCap: 611.747 Millions | |
| Recent Price: 48.55 Smart Investing & Trading Score: 100 | |
| Day Percent Change: 0.79% Day Change: 0.38 | |
| Week Change: 1.89% Year-to-date Change: 13.0% | |
| GAM Links: Profile News Message Board | |
| Charts:- Daily , Weekly | |
| Add GAM to Watchlist: View: Get Complete GAM Trend Analysis ➞ | |
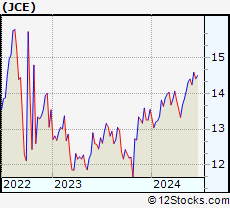 | JCE Nuveen Core Equity Alpha Fund |
| Sector: Financials | |
| SubSector: Closed-End Fund - Equity | |
| MarketCap: 144.747 Millions | |
| Recent Price: 14.32 Smart Investing & Trading Score: 88 | |
| Day Percent Change: 0.28% Day Change: 0.04 | |
| Week Change: 1.89% Year-to-date Change: 5.7% | |
| JCE Links: Profile News Message Board | |
| Charts:- Daily , Weekly | |
| Add JCE to Watchlist: View: Get Complete JCE Trend Analysis ➞ | |
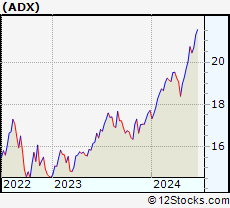 | ADX Adams Diversified Equity Fund, Inc. |
| Sector: Financials | |
| SubSector: Closed-End Fund - Equity | |
| MarketCap: 1172.77 Millions | |
| Recent Price: 20.06 Smart Investing & Trading Score: 88 | |
| Day Percent Change: 0.05% Day Change: 0.01 | |
| Week Change: 1.88% Year-to-date Change: 13.3% | |
| ADX Links: Profile News Message Board | |
| Charts:- Daily , Weekly | |
| Add ADX to Watchlist: View: Get Complete ADX Trend Analysis ➞ | |
| For tabular summary view of above stock list: Summary View ➞ 0 - 25 , 25 - 50 , 50 - 75 , 75 - 100 , 100 - 125 , 125 - 150 , 150 - 175 , 175 - 200 , 200 - 225 , 225 - 250 , 250 - 275 , 275 - 300 , 300 - 325 , 325 - 350 , 350 - 375 , 375 - 400 , 400 - 425 , 425 - 450 , 450 - 475 , 475 - 500 , 500 - 525 , 525 - 550 , 550 - 575 , 575 - 600 , 600 - 625 , 625 - 650 , 650 - 675 , 675 - 700 , 700 - 725 , 725 - 750 , 750 - 775 , 775 - 800 , 800 - 825 , 825 - 850 , 850 - 875 , 875 - 900 , 900 - 925 , 925 - 950 , 950 - 975 , 975 - 1000 , 1000 - 1025 , 1025 - 1050 , 1050 - 1075 , 1075 - 1100 , 1100 - 1125 , 1125 - 1150 , 1150 - 1175 , 1175 - 1200 , 1200 - 1225 | ||
| Click To Change The Sort Order: By Market Cap or Company Size Performance: Year-to-date, Week and Day | |
| Select Chart Type: | ||
|
Best Stocks Today 12Stocks.com |
© 2024 12Stocks.com Terms & Conditions Privacy Contact Us
All Information Provided Only For Education And Not To Be Used For Investing or Trading. See Terms & Conditions


One More Thing ... Get Best Stocks Delivered Daily!
Never Ever Miss A Move With Our Top Ten Stocks Lists
Find Best Stocks In Any Market - Bull or Bear Market
Take A Peek At Our Top Ten Stocks Lists: Daily, Weekly, Year-to-Date & Top Trends
Find Best Stocks In Any Market - Bull or Bear Market
Take A Peek At Our Top Ten Stocks Lists: Daily, Weekly, Year-to-Date & Top Trends
Financial Stocks With Best Up Trends [0-bearish to 100-bullish]: Fangdd Network[100], Xinyuan Real[100], MicroSectors Gold[100], Sprott Physical[100], Citizens & Northern[100], Sumitomo Mitsui[100], First Community[100], Chubb [100], Angel Oak[100], Sprott Physical[100], Iris Energy[100]
Best Financial Stocks Year-to-Date:
Root [526.36%], Fangdd Network[149.63%], Banco Macro[126.41%], Grupo Financiero[112.4%], Banco BBVA[110.66%], SelectQuote [110.22%], Gladstone Capital[106.92%], EverQuote [98.2%], Hippo [92.54%], Grupo Supervielle[86.95%], Vista Oil[60.93%] Best Financial Stocks This Week:
Fangdd Network[360.27%], Xinyuan Real[53.28%], Iris Energy[25.68%], Fathom [25.35%], Huize Holding[21.83%], First Foundation[18.98%], Trupanion [17.21%], Bridge [16.67%], MicroSectors Gold[15.19%], KE [13.86%], Douglas Elliman[13.56%] Best Financial Stocks Daily:
Fangdd Network[321.26%], Xinyuan Real[39.49%], MicroSectors Gold[12.02%], Fathom [9.88%], Citizens [8.53%], Hywin [8.28%], Root [6.10%], First Foundation[6.09%], Sprott Physical[6.09%], Freedom Holding[5.02%], NexGen Energy[4.99%]