
 Login Sign Up


| |||||
 |  | ||||

| 12Stocks.com Market Intelligence |
Best Financial Stocks
| In a hurry? Financial Stocks Lists: Performance Trends Table, Stock Charts
Sort Financial stocks: Daily, Weekly, Year-to-Date, Market Cap & Trends. Filter Financial stocks list by size:All Financial Large Mid-Range Small & MicroCap |
| 12Stocks.com Financial Stocks Performances & Trends Daily | |||||||||
|
|  The overall Smart Investing & Trading Score is 95 (0-bearish to 100-bullish) which puts Financial sector in short term bullish trend. The Smart Investing & Trading Score from previous trading session is 100 and a deterioration of trend continues.
| ||||||||
Here are the Smart Investing & Trading Scores of the most requested Financial stocks at 12Stocks.com (click stock name for detailed review):
|


| 12Stocks.com: Investing in Financial sector with Stocks | |
|
The following table helps investors and traders sort through current performance and trends (as measured by Smart Investing & Trading Score) of various
stocks in the Financial sector. Quick View: Move mouse or cursor over stock symbol (ticker) to view short-term Technical chart and over stock name to view long term chart. Click on  to add stock symbol to your watchlist and to add stock symbol to your watchlist and  to view watchlist. Click on any ticker or stock name for detailed market intelligence report for that stock. to view watchlist. Click on any ticker or stock name for detailed market intelligence report for that stock. |
12Stocks.com Performance of Stocks in Financial Sector
| Ticker | Stock Name | Watchlist | Category | Recent Price | Smart Investing & Trading Score | Change % | Weekly Change% |
| LDEM | iShares ESG |   | Exchange Traded Fund | 47.34 | 95 | 0.38% | 3.70% |
| EVR | Evercore | | Asset Mgmt | 203.48 | 100 | 2.11% | 3.68% |
| CNS | Cohen & Steers | | Asset Mgmt | 73.31 | 70 | -0.61% | 3.66% |
| ARI | Apollo Commercial | | Mortgage | 10.48 | 49 | 2.24% | 3.66% |
| FNWB | First Northwest | | S&L | 11.12 | 37 | -1.16% | 3.63% |
| NSA | National Storage | | REIT - Industrial | 38.09 | 100 | 0.66% | 3.62% |
| FFNW | First | | Regional Banks | 21.51 | 95 | 0.19% | 3.61% |
| NFBK | Northfield Bancorp | | Regional Banks | 9.75 | 69 | 1.56% | 3.61% |
| HTBI | HomeTrust Bancshares | | Regional Banks | 28.95 | 95 | 1.72% | 3.61% |
| NYMTZ | New York | | REIT - Mortgage | 19.01 | 100 | 1.39% | 3.60% |
| WASH | Washington Trust | | Regional Banks | 27.77 | 100 | 0.84% | 3.58% |
| FNLC | First Bancorp | | Regional Banks | 24.32 | 100 | 1.42% | 3.58% |
| RWT | Redwood Trust | | Mortgage | 6.68 | 95 | 0.75% | 3.57% |
| EXR | Extra Space | | REIT - Industrial | 151.89 | 83 | 0.36% | 3.56% |
| SMBC | Southern Missouri | | S&L | 43.60 | 100 | 0.81% | 3.56% |
| NWFL | Norwood | | Regional Banks | 24.47 | 18 | -0.37% | 3.55% |
| SCHW | Charles Schwab | | Brokerage | 78.78 | 100 | 0.95% | 3.51% |
| FCAP | First Capital | | S&L | 29.03 | 85 | -4.03% | 3.49% |
| CIFR | Cipher Mining | | Capital Markets | 3.85 | 41 | -5.41% | 3.49% |
| PSEC | Prospect Capital | | Asset Mgmt | 5.66 | 83 | 0.89% | 3.47% |
| RY | Royal Bank | | Banks | 106.79 | 95 | 0.75% | 3.47% |
| NDAQ | Nasdaq | | Investments | 62.76 | 100 | 0.85% | 3.46% |
| KREF | KKR Real | | Mortgage | 9.88 | 100 | 0.41% | 3.46% |
| HFRO | Highland Funds | | Asset Mgmt | 6.66 | 100 | 1.68% | 3.42% |
| WAFDP | Washington Federal | | Banks - Regional | 16.62 | 100 | 1.28% | 3.42% |
| For chart view version of above stock list: Chart View ➞ 0 - 25 , 25 - 50 , 50 - 75 , 75 - 100 , 100 - 125 , 125 - 150 , 150 - 175 , 175 - 200 , 200 - 225 , 225 - 250 , 250 - 275 , 275 - 300 , 300 - 325 , 325 - 350 , 350 - 375 , 375 - 400 , 400 - 425 , 425 - 450 , 450 - 475 , 475 - 500 , 500 - 525 , 525 - 550 , 550 - 575 , 575 - 600 , 600 - 625 , 625 - 650 , 650 - 675 , 675 - 700 , 700 - 725 , 725 - 750 , 750 - 775 , 775 - 800 , 800 - 825 , 825 - 850 , 850 - 875 , 875 - 900 , 900 - 925 , 925 - 950 , 950 - 975 , 975 - 1000 , 1000 - 1025 , 1025 - 1050 , 1050 - 1075 , 1075 - 1100 , 1100 - 1125 , 1125 - 1150 , 1150 - 1175 , 1175 - 1200 , 1200 - 1225 | ||
 | Click To Change The Sort Order: By Market Cap or Company Size Performance: Year-to-date, Week and Day |  |
|
Get the most comprehensive stock market coverage daily at 12Stocks.com ➞ Best Stocks Today ➞ Best Stocks Weekly ➞ Best Stocks Year-to-Date ➞ Best Stocks Trends ➞  Best Stocks Today 12Stocks.com Best Nasdaq Stocks ➞ Best S&P 500 Stocks ➞ Best Tech Stocks ➞ Best Biotech Stocks ➞ |
| Detailed Overview of Financial Stocks |
| Financial Technical Overview, Leaders & Laggards, Top Financial ETF Funds & Detailed Financial Stocks List, Charts, Trends & More |
| Financial Sector: Technical Analysis, Trends & YTD Performance | |
| Financial sector is composed of stocks
from banks, brokers, insurance, REITs
and services subsectors. Financial sector, as represented by XLF, an exchange-traded fund [ETF] that holds basket of Financial stocks (e.g, Bank of America, Goldman Sachs) is up by 13.01% and is currently outperforming the overall market by 2.44% year-to-date. Below is a quick view of Technical charts and trends: |
|
 XLF Weekly Chart |
|
| Long Term Trend: Very Good | |
| Medium Term Trend: Very Good | |
 XLF Daily Chart |
|
| Short Term Trend: Very Good | |
| Overall Trend Score: 95 | |
| YTD Performance: 13.01% | |
| **Trend Scores & Views Are Only For Educational Purposes And Not For Investing | |
| 12Stocks.com: Top Performing Financial Sector Stocks | ||||||||||||||||||||||||||||||||||||||||||||||||
 The top performing Financial sector stocks year to date are
Now, more recently, over last week, the top performing Financial sector stocks on the move are


|
||||||||||||||||||||||||||||||||||||||||||||||||
| 12Stocks.com: Investing in Financial Sector using Exchange Traded Funds | |
|
The following table shows list of key exchange traded funds (ETF) that
help investors track Financial Index. For detailed view, check out our ETF Funds section of our website. Quick View: Move mouse or cursor over ETF symbol (ticker) to view short-term Technical chart and over ETF name to view long term chart. Click on ticker or stock name for detailed view. Click on to add stock symbol to your watchlist and to view watchlist. |
12Stocks.com List of ETFs that track Financial Index
| Ticker | ETF Name | Watchlist | Recent Price | Smart Investing & Trading Score | Change % | Week % | Year-to-date % |
| XLF | Financial | | 42.49 | 95 | 0.73 | 1.58 | 13.01% |
| IAI | Broker-Dealers & Secs | | 119.47 | 100 | 1.08 | 2.59 | 10.08% |
| IYF | Financials | | 96.85 | 95 | 0.43 | 1.73 | 13.39% |
| IYG | Financial Services | | 67.11 | 95 | 0.15 | 1.56 | 12.34% |
| KRE | Regional Banking | | 51.19 | 83 | 0.23 | 1.67 | -2.37% |
| IXG | Global Financials | | 88.72 | 88 | 0.21 | 1.41 | 12.91% |
| VFH | Financials | | 103.00 | 95 | 0.18 | 1.45 | 11.64% |
| KBE | Bank | | 47.93 | 83 | 0.44 | 1.25 | 4.15% |
| FAS | Financial Bull 3X | | 112.32 | 95 | 1.81 | 4.06 | 35.9% |
| FAZ | Financial Bear 3X | | 9.75 | 10 | -1.71 | -3.75 | -28.68% |
| UYG | Financials | | 68.54 | 100 | 1.23 | 2.77 | 24.17% |
| IAT | Regional Banks | | 43.42 | 76 | -0.26 | 1.02 | 3.78% |
| KIE | Insurance | | 51.83 | 100 | 0.88 | 1.09 | 14.62% |
| PSCF | SmallCap Financials | | 49.03 | 95 | 0.28 | 1.44 | -0.31% |
| EUFN | Europe Financials | | 24.13 | 95 | 0.67 | 2.51 | 15.12% |
| PGF | Financial Preferred | | 14.81 | 52 | -0.10 | 0.68 | 1.58% |
| 12Stocks.com: Charts, Trends, Fundamental Data and Performances of Financial Stocks | |
|
We now take in-depth look at all Financial stocks including charts, multi-period performances and overall trends (as measured by Smart Investing & Trading Score). One can sort Financial stocks (click link to choose) by Daily, Weekly and by Year-to-Date performances. Also, one can sort by size of the company or by market capitalization. |
| Select Your Default Chart Type: | |||||
| |||||
| Click on stock symbol or name for detailed view. Click on to add stock symbol to your watchlist and to view watchlist. Quick View: Move mouse or cursor over "Daily" to quickly view daily Technical stock chart and over "Weekly" to view weekly Technical stock chart. | |||||

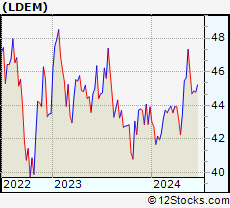 | LDEM iShares ESG MSCI EM Leaders ETF |
| Sector: Financials | |
| SubSector: Exchange Traded Fund | |
| MarketCap: 60157 Millions | |
| Recent Price: 47.34 Smart Investing & Trading Score: 95 | |
| Day Percent Change: 0.38% Day Change: 0.18 | |
| Week Change: 3.7% Year-to-date Change: 7.8% | |
| LDEM Links: Profile News Message Board | |
| Charts:- Daily , Weekly | |
| Add LDEM to Watchlist: View: Get Complete LDEM Trend Analysis ➞ | |
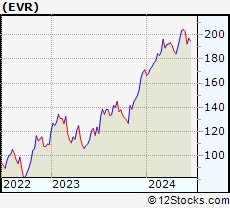 | EVR Evercore Inc. |
| Sector: Financials | |
| SubSector: Asset Management | |
| MarketCap: 1989.83 Millions | |
| Recent Price: 203.48 Smart Investing & Trading Score: 100 | |
| Day Percent Change: 2.11% Day Change: 4.21 | |
| Week Change: 3.68% Year-to-date Change: 19.0% | |
| EVR Links: Profile News Message Board | |
| Charts:- Daily , Weekly | |
| Add EVR to Watchlist: View: Get Complete EVR Trend Analysis ➞ | |
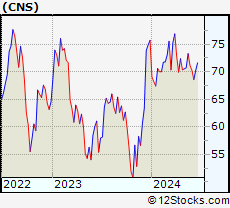 | CNS Cohen & Steers, Inc. |
| Sector: Financials | |
| SubSector: Asset Management | |
| MarketCap: 2082.43 Millions | |
| Recent Price: 73.31 Smart Investing & Trading Score: 70 | |
| Day Percent Change: -0.61% Day Change: -0.45 | |
| Week Change: 3.66% Year-to-date Change: -3.2% | |
| CNS Links: Profile News Message Board | |
| Charts:- Daily , Weekly | |
| Add CNS to Watchlist: View: Get Complete CNS Trend Analysis ➞ | |
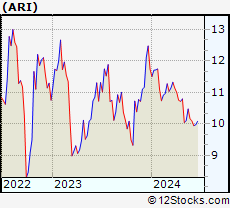 | ARI Apollo Commercial Real Estate Finance, Inc. |
| Sector: Financials | |
| SubSector: Mortgage Investment | |
| MarketCap: 1302.19 Millions | |
| Recent Price: 10.48 Smart Investing & Trading Score: 49 | |
| Day Percent Change: 2.24% Day Change: 0.23 | |
| Week Change: 3.66% Year-to-date Change: -10.7% | |
| ARI Links: Profile News Message Board | |
| Charts:- Daily , Weekly | |
| Add ARI to Watchlist: View: Get Complete ARI Trend Analysis ➞ | |
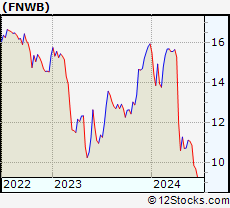 | FNWB First Northwest Bancorp |
| Sector: Financials | |
| SubSector: Savings & Loans | |
| MarketCap: 126.83 Millions | |
| Recent Price: 11.12 Smart Investing & Trading Score: 37 | |
| Day Percent Change: -1.16% Day Change: -0.13 | |
| Week Change: 3.63% Year-to-date Change: -30.2% | |
| FNWB Links: Profile News Message Board | |
| Charts:- Daily , Weekly | |
| Add FNWB to Watchlist: View: Get Complete FNWB Trend Analysis ➞ | |
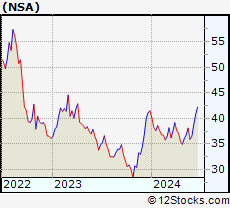 | NSA National Storage Affiliates Trust |
| Sector: Financials | |
| SubSector: REIT - Industrial | |
| MarketCap: 1623.99 Millions | |
| Recent Price: 38.09 Smart Investing & Trading Score: 100 | |
| Day Percent Change: 0.66% Day Change: 0.25 | |
| Week Change: 3.62% Year-to-date Change: -8.2% | |
| NSA Links: Profile News Message Board | |
| Charts:- Daily , Weekly | |
| Add NSA to Watchlist: View: Get Complete NSA Trend Analysis ➞ | |
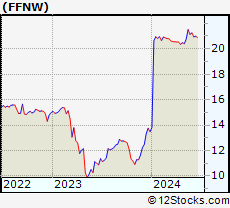 | FFNW First Financial Northwest, Inc. |
| Sector: Financials | |
| SubSector: Regional - Pacific Banks | |
| MarketCap: 102.829 Millions | |
| Recent Price: 21.51 Smart Investing & Trading Score: 95 | |
| Day Percent Change: 0.19% Day Change: 0.04 | |
| Week Change: 3.61% Year-to-date Change: 59.6% | |
| FFNW Links: Profile News Message Board | |
| Charts:- Daily , Weekly | |
| Add FFNW to Watchlist: View: Get Complete FFNW Trend Analysis ➞ | |
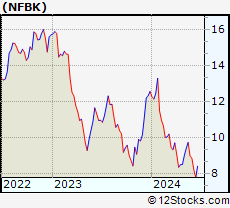 | NFBK Northfield Bancorp, Inc. (Staten Island, NY) |
| Sector: Financials | |
| SubSector: Regional - Northeast Banks | |
| MarketCap: 540.699 Millions | |
| Recent Price: 9.75 Smart Investing & Trading Score: 69 | |
| Day Percent Change: 1.56% Day Change: 0.15 | |
| Week Change: 3.61% Year-to-date Change: -22.5% | |
| NFBK Links: Profile News Message Board | |
| Charts:- Daily , Weekly | |
| Add NFBK to Watchlist: View: Get Complete NFBK Trend Analysis ➞ | |
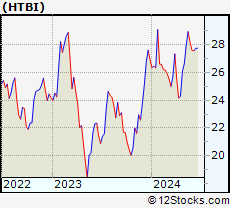 | HTBI HomeTrust Bancshares, Inc. |
| Sector: Financials | |
| SubSector: Regional - Northeast Banks | |
| MarketCap: 238.899 Millions | |
| Recent Price: 28.95 Smart Investing & Trading Score: 95 | |
| Day Percent Change: 1.72% Day Change: 0.49 | |
| Week Change: 3.61% Year-to-date Change: 7.5% | |
| HTBI Links: Profile News Message Board | |
| Charts:- Daily , Weekly | |
| Add HTBI to Watchlist: View: Get Complete HTBI Trend Analysis ➞ | |
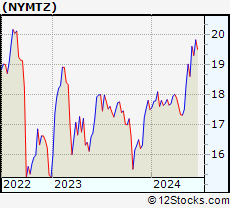 | NYMTZ New York Mortgage Trust, Inc. |
| Sector: Financials | |
| SubSector: REIT - Mortgage | |
| MarketCap: 905 Millions | |
| Recent Price: 19.01 Smart Investing & Trading Score: 100 | |
| Day Percent Change: 1.39% Day Change: 0.26 | |
| Week Change: 3.6% Year-to-date Change: 8.6% | |
| NYMTZ Links: Profile News Message Board | |
| Charts:- Daily , Weekly | |
| Add NYMTZ to Watchlist: View: Get Complete NYMTZ Trend Analysis ➞ | |
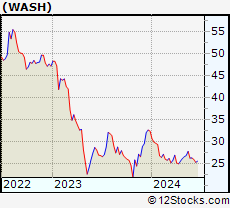 | WASH Washington Trust Bancorp, Inc. |
| Sector: Financials | |
| SubSector: Regional - Northeast Banks | |
| MarketCap: 590.099 Millions | |
| Recent Price: 27.77 Smart Investing & Trading Score: 100 | |
| Day Percent Change: 0.84% Day Change: 0.23 | |
| Week Change: 3.58% Year-to-date Change: -14.2% | |
| WASH Links: Profile News Message Board | |
| Charts:- Daily , Weekly | |
| Add WASH to Watchlist: View: Get Complete WASH Trend Analysis ➞ | |
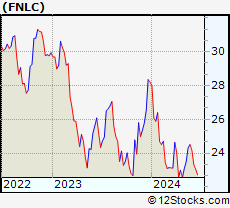 | FNLC The First Bancorp, Inc. |
| Sector: Financials | |
| SubSector: Regional - Northeast Banks | |
| MarketCap: 264.799 Millions | |
| Recent Price: 24.32 Smart Investing & Trading Score: 100 | |
| Day Percent Change: 1.42% Day Change: 0.34 | |
| Week Change: 3.58% Year-to-date Change: -13.8% | |
| FNLC Links: Profile News Message Board | |
| Charts:- Daily , Weekly | |
| Add FNLC to Watchlist: View: Get Complete FNLC Trend Analysis ➞ | |
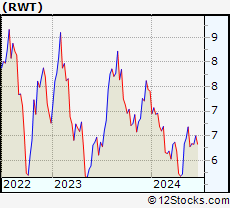 | RWT Redwood Trust, Inc. |
| Sector: Financials | |
| SubSector: Mortgage Investment | |
| MarketCap: 674.739 Millions | |
| Recent Price: 6.68 Smart Investing & Trading Score: 95 | |
| Day Percent Change: 0.75% Day Change: 0.05 | |
| Week Change: 3.57% Year-to-date Change: -9.9% | |
| RWT Links: Profile News Message Board | |
| Charts:- Daily , Weekly | |
| Add RWT to Watchlist: View: Get Complete RWT Trend Analysis ➞ | |
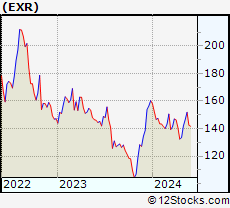 | EXR Extra Space Storage Inc. |
| Sector: Financials | |
| SubSector: REIT - Industrial | |
| MarketCap: 11203.9 Millions | |
| Recent Price: 151.89 Smart Investing & Trading Score: 83 | |
| Day Percent Change: 0.36% Day Change: 0.54 | |
| Week Change: 3.56% Year-to-date Change: -5.3% | |
| EXR Links: Profile News Message Board | |
| Charts:- Daily , Weekly | |
| Add EXR to Watchlist: View: Get Complete EXR Trend Analysis ➞ | |
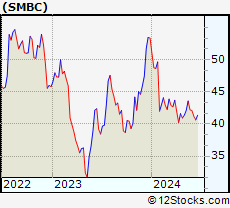 | SMBC Southern Missouri Bancorp, Inc. |
| Sector: Financials | |
| SubSector: Savings & Loans | |
| MarketCap: 272.53 Millions | |
| Recent Price: 43.60 Smart Investing & Trading Score: 100 | |
| Day Percent Change: 0.81% Day Change: 0.35 | |
| Week Change: 3.56% Year-to-date Change: -18.3% | |
| SMBC Links: Profile News Message Board | |
| Charts:- Daily , Weekly | |
| Add SMBC to Watchlist: View: Get Complete SMBC Trend Analysis ➞ | |
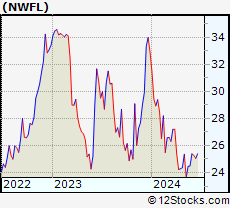 | NWFL Norwood Financial Corp. |
| Sector: Financials | |
| SubSector: Regional - Northeast Banks | |
| MarketCap: 201.899 Millions | |
| Recent Price: 24.47 Smart Investing & Trading Score: 18 | |
| Day Percent Change: -0.37% Day Change: -0.09 | |
| Week Change: 3.55% Year-to-date Change: -25.7% | |
| NWFL Links: Profile News Message Board | |
| Charts:- Daily , Weekly | |
| Add NWFL to Watchlist: View: Get Complete NWFL Trend Analysis ➞ | |
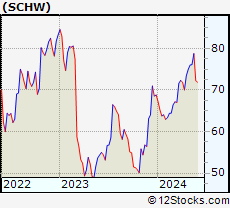 | SCHW The Charles Schwab Corporation |
| Sector: Financials | |
| SubSector: Investment Brokerage - National | |
| MarketCap: 45115.8 Millions | |
| Recent Price: 78.78 Smart Investing & Trading Score: 100 | |
| Day Percent Change: 0.95% Day Change: 0.74 | |
| Week Change: 3.51% Year-to-date Change: 14.5% | |
| SCHW Links: Profile News Message Board | |
| Charts:- Daily , Weekly | |
| Add SCHW to Watchlist: View: Get Complete SCHW Trend Analysis ➞ | |
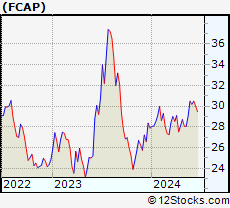 | FCAP First Capital, Inc. |
| Sector: Financials | |
| SubSector: Savings & Loans | |
| MarketCap: 171.03 Millions | |
| Recent Price: 29.03 Smart Investing & Trading Score: 85 | |
| Day Percent Change: -4.03% Day Change: -1.22 | |
| Week Change: 3.49% Year-to-date Change: 4.1% | |
| FCAP Links: Profile News Message Board | |
| Charts:- Daily , Weekly | |
| Add FCAP to Watchlist: View: Get Complete FCAP Trend Analysis ➞ | |
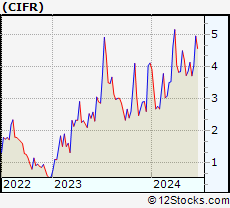 | CIFR Cipher Mining Inc. |
| Sector: Financials | |
| SubSector: Capital Markets | |
| MarketCap: 712 Millions | |
| Recent Price: 3.85 Smart Investing & Trading Score: 41 | |
| Day Percent Change: -5.41% Day Change: -0.22 | |
| Week Change: 3.49% Year-to-date Change: -6.3% | |
| CIFR Links: Profile News Message Board | |
| Charts:- Daily , Weekly | |
| Add CIFR to Watchlist: View: Get Complete CIFR Trend Analysis ➞ | |
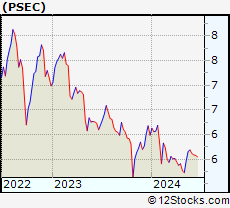 | PSEC Prospect Capital Corporation |
| Sector: Financials | |
| SubSector: Asset Management | |
| MarketCap: 1764.73 Millions | |
| Recent Price: 5.66 Smart Investing & Trading Score: 83 | |
| Day Percent Change: 0.89% Day Change: 0.05 | |
| Week Change: 3.47% Year-to-date Change: -5.5% | |
| PSEC Links: Profile News Message Board | |
| Charts:- Daily , Weekly | |
| Add PSEC to Watchlist: View: Get Complete PSEC Trend Analysis ➞ | |
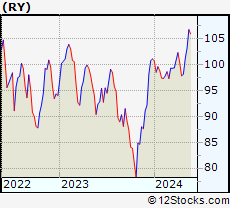 | RY Royal Bank of Canada |
| Sector: Financials | |
| SubSector: Money Center Banks | |
| MarketCap: 87565.4 Millions | |
| Recent Price: 106.79 Smart Investing & Trading Score: 95 | |
| Day Percent Change: 0.75% Day Change: 0.80 | |
| Week Change: 3.47% Year-to-date Change: 5.6% | |
| RY Links: Profile News Message Board | |
| Charts:- Daily , Weekly | |
| Add RY to Watchlist: View: Get Complete RY Trend Analysis ➞ | |
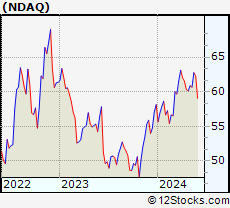 | NDAQ Nasdaq, Inc. |
| Sector: Financials | |
| SubSector: Diversified Investments | |
| MarketCap: 14885.2 Millions | |
| Recent Price: 62.76 Smart Investing & Trading Score: 100 | |
| Day Percent Change: 0.85% Day Change: 0.53 | |
| Week Change: 3.46% Year-to-date Change: 8.0% | |
| NDAQ Links: Profile News Message Board | |
| Charts:- Daily , Weekly | |
| Add NDAQ to Watchlist: View: Get Complete NDAQ Trend Analysis ➞ | |
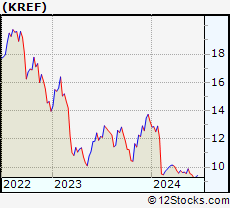 | KREF KKR Real Estate Finance Trust Inc. |
| Sector: Financials | |
| SubSector: Mortgage Investment | |
| MarketCap: 645.939 Millions | |
| Recent Price: 9.88 Smart Investing & Trading Score: 100 | |
| Day Percent Change: 0.41% Day Change: 0.04 | |
| Week Change: 3.46% Year-to-date Change: -25.3% | |
| KREF Links: Profile News Message Board | |
| Charts:- Daily , Weekly | |
| Add KREF to Watchlist: View: Get Complete KREF Trend Analysis ➞ | |
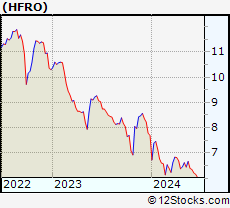 | HFRO Highland Funds I - Highland Income Fund |
| Sector: Financials | |
| SubSector: Asset Management | |
| MarketCap: 647.503 Millions | |
| Recent Price: 6.66 Smart Investing & Trading Score: 100 | |
| Day Percent Change: 1.68% Day Change: 0.11 | |
| Week Change: 3.42% Year-to-date Change: -13.4% | |
| HFRO Links: Profile News Message Board | |
| Charts:- Daily , Weekly | |
| Add HFRO to Watchlist: View: Get Complete HFRO Trend Analysis ➞ | |
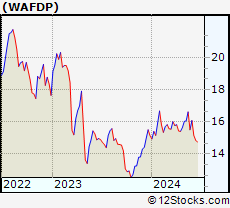 | WAFDP Washington Federal, Inc. |
| Sector: Financials | |
| SubSector: Banks - Regional | |
| MarketCap: 1740 Millions | |
| Recent Price: 16.62 Smart Investing & Trading Score: 100 | |
| Day Percent Change: 1.28% Day Change: 0.21 | |
| Week Change: 3.42% Year-to-date Change: 9.8% | |
| WAFDP Links: Profile News Message Board | |
| Charts:- Daily , Weekly | |
| Add WAFDP to Watchlist: View: Get Complete WAFDP Trend Analysis ➞ | |
| For tabular summary view of above stock list: Summary View ➞ 0 - 25 , 25 - 50 , 50 - 75 , 75 - 100 , 100 - 125 , 125 - 150 , 150 - 175 , 175 - 200 , 200 - 225 , 225 - 250 , 250 - 275 , 275 - 300 , 300 - 325 , 325 - 350 , 350 - 375 , 375 - 400 , 400 - 425 , 425 - 450 , 450 - 475 , 475 - 500 , 500 - 525 , 525 - 550 , 550 - 575 , 575 - 600 , 600 - 625 , 625 - 650 , 650 - 675 , 675 - 700 , 700 - 725 , 725 - 750 , 750 - 775 , 775 - 800 , 800 - 825 , 825 - 850 , 850 - 875 , 875 - 900 , 900 - 925 , 925 - 950 , 950 - 975 , 975 - 1000 , 1000 - 1025 , 1025 - 1050 , 1050 - 1075 , 1075 - 1100 , 1100 - 1125 , 1125 - 1150 , 1150 - 1175 , 1175 - 1200 , 1200 - 1225 | ||
| Click To Change The Sort Order: By Market Cap or Company Size Performance: Year-to-date, Week and Day | |
| Select Chart Type: | ||
|
Best Stocks Today 12Stocks.com |
© 2024 12Stocks.com Terms & Conditions Privacy Contact Us
All Information Provided Only For Education And Not To Be Used For Investing or Trading. See Terms & Conditions


One More Thing ... Get Best Stocks Delivered Daily!
Never Ever Miss A Move With Our Top Ten Stocks Lists
Find Best Stocks In Any Market - Bull or Bear Market
Take A Peek At Our Top Ten Stocks Lists: Daily, Weekly, Year-to-Date & Top Trends
Find Best Stocks In Any Market - Bull or Bear Market
Take A Peek At Our Top Ten Stocks Lists: Daily, Weekly, Year-to-Date & Top Trends
Financial Stocks With Best Up Trends [0-bearish to 100-bullish]: Fangdd Network[100], Xinyuan Real[100], MicroSectors Gold[100], Sprott Physical[100], Citizens & Northern[100], Sumitomo Mitsui[100], First Community[100], Chubb [100], Angel Oak[100], Sprott Physical[100], Iris Energy[100]
Best Financial Stocks Year-to-Date:
Root [526.36%], Fangdd Network[149.63%], Banco Macro[126.41%], Grupo Financiero[112.4%], Banco BBVA[110.66%], SelectQuote [110.22%], Gladstone Capital[106.92%], EverQuote [98.2%], Hippo [92.54%], Grupo Supervielle[86.95%], Vista Oil[60.93%] Best Financial Stocks This Week:
Fangdd Network[360.27%], Xinyuan Real[53.28%], Iris Energy[25.68%], Fathom [25.35%], Huize Holding[21.83%], First Foundation[18.98%], Trupanion [17.21%], Bridge [16.67%], MicroSectors Gold[15.19%], KE [13.86%], Douglas Elliman[13.56%] Best Financial Stocks Daily:
Fangdd Network[321.26%], Xinyuan Real[39.49%], MicroSectors Gold[12.02%], Fathom [9.88%], Citizens [8.53%], Hywin [8.28%], Root [6.10%], First Foundation[6.09%], Sprott Physical[6.09%], Freedom Holding[5.02%], NexGen Energy[4.99%]