
 Login Sign Up


| |||||
 |  | ||||

| 12Stocks.com Market Intelligence |
Best Financial Stocks
| In a hurry? Financial Stocks Lists: Performance Trends Table, Stock Charts
Sort Financial stocks: Daily, Weekly, Year-to-Date, Market Cap & Trends. Filter Financial stocks list by size:All Financial Large Mid-Range Small & MicroCap |
| 12Stocks.com Financial Stocks Performances & Trends Daily | |||||||||
|
|  The overall Smart Investing & Trading Score is 95 (0-bearish to 100-bullish) which puts Financial sector in short term bullish trend. The Smart Investing & Trading Score from previous trading session is 100 and a deterioration of trend continues.
| ||||||||
Here are the Smart Investing & Trading Scores of the most requested Financial stocks at 12Stocks.com (click stock name for detailed review):
|


| 12Stocks.com: Investing in Financial sector with Stocks | |
|
The following table helps investors and traders sort through current performance and trends (as measured by Smart Investing & Trading Score) of various
stocks in the Financial sector. Quick View: Move mouse or cursor over stock symbol (ticker) to view short-term Technical chart and over stock name to view long term chart. Click on  to add stock symbol to your watchlist and to add stock symbol to your watchlist and  to view watchlist. Click on any ticker or stock name for detailed market intelligence report for that stock. to view watchlist. Click on any ticker or stock name for detailed market intelligence report for that stock. |
12Stocks.com Performance of Stocks in Financial Sector
| Ticker | Stock Name | Watchlist | Category | Recent Price | Smart Investing & Trading Score | Change % | Weekly Change% |
| NKX | Nuveen California |   | Asset Mgmt | 11.77 | 54 | -0.42% | -1.34% |
| NTRS | Northern Trust | | Asset Mgmt | 85.51 | 58 | -0.14% | -1.37% |
| BRT | BRT Apartments | | Mortgage | 17.82 | 76 | -0.11% | -1.38% |
| SBRA | Sabra Health | | REIT | 14.33 | 58 | -1.04% | -1.38% |
| FCFS | FirstCash | | Credit Services | 117.53 | 73 | 0.25% | -1.41% |
| OMF | OneMain | | Credit Services | 49.98 | 41 | 0.18% | -1.42% |
| CRF | Cornerstone Total | | Asset Mgmt | 7.56 | 83 | 1.20% | -1.43% |
| JGH | Nuveen Global | | Asset Mgmt | 12.64 | 36 | -0.24% | -1.48% |
| AHT | Ashford Hospitality | | REIT | 1.30 | 42 | -1.52% | -1.52% |
| APLE | Apple Hospitality | | REIT | 14.61 | 17 | -0.75% | -1.55% |
| ALX | Alexander s | | REIT - Retail | 219.67 | 58 | 0.70% | -1.56% |
| ARL | American Realty | | Property Mgmt | 13.92 | 42 | 0.72% | -1.56% |
| HGTY | Hagerty | | Insurance - Property & Casualty | 8.70 | 39 | 1.52% | -1.58% |
| GL | Globe Life | | Life Insurance | 86.07 | 25 | 2.54% | -1.61% |
| ONL | Orion Office | | REIT - Office | 3.66 | 68 | -1.61% | -1.61% |
| BCSF | Bain Capital | | Asset Mgmt | 16.43 | 39 | 0.74% | -1.62% |
| ENVA | Enova | | Credit Services | 62.16 | 37 | 1.49% | -1.65% |
| ESGRO | Enstar | | Insurance | 24.30 | 33 | -1.01% | -1.66% |
| HWBK | Hawthorn Bancshares | | Regional Banks | 19.38 | 32 | -0.72% | -1.67% |
| BBDO | Banco Bradesco | | Foreign Banks | 2.34 | 10 | 1.25% | -1.68% |
| CCAP | Crescent Capital | | Asset Mgmt | 17.88 | 61 | 0.39% | -1.70% |
| STEP | StepStone | | Asset Mgmt | 37.32 | 46 | -0.32% | -1.71% |
| FBIZ | First Business | | Regional Banks | 34.25 | 25 | -0.72% | -1.75% |
| FRPH | FRP | | Property Mgmt | 30.08 | 23 | 0.20% | -1.76% |
| BSBR | Banco Santander | | Foreign Banks | 5.45 | 25 | 0.00% | -1.80% |
| For chart view version of above stock list: Chart View ➞ 0 - 25 , 25 - 50 , 50 - 75 , 75 - 100 , 100 - 125 , 125 - 150 , 150 - 175 , 175 - 200 , 200 - 225 , 225 - 250 , 250 - 275 , 275 - 300 , 300 - 325 , 325 - 350 , 350 - 375 , 375 - 400 , 400 - 425 , 425 - 450 , 450 - 475 , 475 - 500 , 500 - 525 , 525 - 550 , 550 - 575 , 575 - 600 , 600 - 625 , 625 - 650 , 650 - 675 , 675 - 700 , 700 - 725 , 725 - 750 , 750 - 775 , 775 - 800 , 800 - 825 , 825 - 850 , 850 - 875 , 875 - 900 , 900 - 925 , 925 - 950 , 950 - 975 , 975 - 1000 , 1000 - 1025 , 1025 - 1050 , 1050 - 1075 , 1075 - 1100 , 1100 - 1125 , 1125 - 1150 , 1150 - 1175 , 1175 - 1200 , 1200 - 1225 | ||
 | Click To Change The Sort Order: By Market Cap or Company Size Performance: Year-to-date, Week and Day |  |
|
Get the most comprehensive stock market coverage daily at 12Stocks.com ➞ Best Stocks Today ➞ Best Stocks Weekly ➞ Best Stocks Year-to-Date ➞ Best Stocks Trends ➞  Best Stocks Today 12Stocks.com Best Nasdaq Stocks ➞ Best S&P 500 Stocks ➞ Best Tech Stocks ➞ Best Biotech Stocks ➞ |
| Detailed Overview of Financial Stocks |
| Financial Technical Overview, Leaders & Laggards, Top Financial ETF Funds & Detailed Financial Stocks List, Charts, Trends & More |
| Financial Sector: Technical Analysis, Trends & YTD Performance | |
| Financial sector is composed of stocks
from banks, brokers, insurance, REITs
and services subsectors. Financial sector, as represented by XLF, an exchange-traded fund [ETF] that holds basket of Financial stocks (e.g, Bank of America, Goldman Sachs) is up by 13.01% and is currently outperforming the overall market by 2.44% year-to-date. Below is a quick view of Technical charts and trends: |
|
 XLF Weekly Chart |
|
| Long Term Trend: Very Good | |
| Medium Term Trend: Very Good | |
 XLF Daily Chart |
|
| Short Term Trend: Very Good | |
| Overall Trend Score: 95 | |
| YTD Performance: 13.01% | |
| **Trend Scores & Views Are Only For Educational Purposes And Not For Investing | |
| 12Stocks.com: Top Performing Financial Sector Stocks | ||||||||||||||||||||||||||||||||||||||||||||||||
 The top performing Financial sector stocks year to date are
Now, more recently, over last week, the top performing Financial sector stocks on the move are


|
||||||||||||||||||||||||||||||||||||||||||||||||
| 12Stocks.com: Investing in Financial Sector using Exchange Traded Funds | |
|
The following table shows list of key exchange traded funds (ETF) that
help investors track Financial Index. For detailed view, check out our ETF Funds section of our website. Quick View: Move mouse or cursor over ETF symbol (ticker) to view short-term Technical chart and over ETF name to view long term chart. Click on ticker or stock name for detailed view. Click on to add stock symbol to your watchlist and to view watchlist. |
12Stocks.com List of ETFs that track Financial Index
| Ticker | ETF Name | Watchlist | Recent Price | Smart Investing & Trading Score | Change % | Week % | Year-to-date % |
| XLF | Financial | | 42.49 | 95 | 0.73 | 1.58 | 13.01% |
| IAI | Broker-Dealers & Secs | | 119.47 | 100 | 1.08 | 2.59 | 10.08% |
| IYF | Financials | | 96.85 | 95 | 0.43 | 1.73 | 13.39% |
| IYG | Financial Services | | 67.11 | 95 | 0.15 | 1.56 | 12.34% |
| KRE | Regional Banking | | 51.19 | 83 | 0.23 | 1.67 | -2.37% |
| IXG | Global Financials | | 88.72 | 88 | 0.21 | 1.41 | 12.91% |
| VFH | Financials | | 103.00 | 95 | 0.18 | 1.45 | 11.64% |
| KBE | Bank | | 47.93 | 83 | 0.44 | 1.25 | 4.15% |
| FAS | Financial Bull 3X | | 112.32 | 95 | 1.81 | 4.06 | 35.9% |
| FAZ | Financial Bear 3X | | 9.75 | 10 | -1.71 | -3.75 | -28.68% |
| UYG | Financials | | 68.54 | 100 | 1.23 | 2.77 | 24.17% |
| IAT | Regional Banks | | 43.42 | 76 | -0.26 | 1.02 | 3.78% |
| KIE | Insurance | | 51.83 | 100 | 0.88 | 1.09 | 14.62% |
| PSCF | SmallCap Financials | | 49.03 | 95 | 0.28 | 1.44 | -0.31% |
| EUFN | Europe Financials | | 24.13 | 95 | 0.67 | 2.51 | 15.12% |
| PGF | Financial Preferred | | 14.81 | 52 | -0.10 | 0.68 | 1.58% |
| 12Stocks.com: Charts, Trends, Fundamental Data and Performances of Financial Stocks | |
|
We now take in-depth look at all Financial stocks including charts, multi-period performances and overall trends (as measured by Smart Investing & Trading Score). One can sort Financial stocks (click link to choose) by Daily, Weekly and by Year-to-Date performances. Also, one can sort by size of the company or by market capitalization. |
| Select Your Default Chart Type: | |||||
| |||||
| Click on stock symbol or name for detailed view. Click on to add stock symbol to your watchlist and to view watchlist. Quick View: Move mouse or cursor over "Daily" to quickly view daily Technical stock chart and over "Weekly" to view weekly Technical stock chart. | |||||

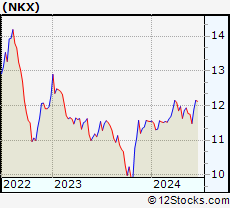 | NKX Nuveen California AMT-Free Quality Municipal Income Fund |
| Sector: Financials | |
| SubSector: Asset Management | |
| MarketCap: 595.403 Millions | |
| Recent Price: 11.77 Smart Investing & Trading Score: 54 | |
| Day Percent Change: -0.42% Day Change: -0.05 | |
| Week Change: -1.34% Year-to-date Change: 2.0% | |
| NKX Links: Profile News Message Board | |
| Charts:- Daily , Weekly | |
| Add NKX to Watchlist: View: Get Complete NKX Trend Analysis ➞ | |
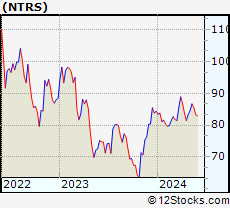 | NTRS Northern Trust Corporation |
| Sector: Financials | |
| SubSector: Asset Management | |
| MarketCap: 15316.8 Millions | |
| Recent Price: 85.51 Smart Investing & Trading Score: 58 | |
| Day Percent Change: -0.14% Day Change: -0.12 | |
| Week Change: -1.37% Year-to-date Change: 1.3% | |
| NTRS Links: Profile News Message Board | |
| Charts:- Daily , Weekly | |
| Add NTRS to Watchlist: View: Get Complete NTRS Trend Analysis ➞ | |
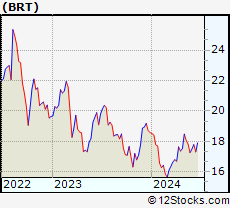 | BRT BRT Apartments Corp. |
| Sector: Financials | |
| SubSector: Mortgage Investment | |
| MarketCap: 163.239 Millions | |
| Recent Price: 17.82 Smart Investing & Trading Score: 76 | |
| Day Percent Change: -0.11% Day Change: -0.02 | |
| Week Change: -1.38% Year-to-date Change: -4.1% | |
| BRT Links: Profile News Message Board | |
| Charts:- Daily , Weekly | |
| Add BRT to Watchlist: View: Get Complete BRT Trend Analysis ➞ | |
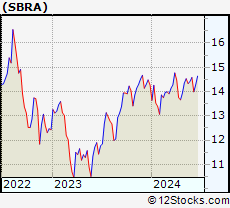 | SBRA Sabra Health Care REIT, Inc. |
| Sector: Financials | |
| SubSector: REIT - Healthcare Facilities | |
| MarketCap: 2576.54 Millions | |
| Recent Price: 14.33 Smart Investing & Trading Score: 58 | |
| Day Percent Change: -1.04% Day Change: -0.15 | |
| Week Change: -1.38% Year-to-date Change: 0.4% | |
| SBRA Links: Profile News Message Board | |
| Charts:- Daily , Weekly | |
| Add SBRA to Watchlist: View: Get Complete SBRA Trend Analysis ➞ | |
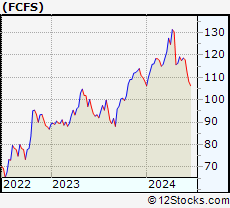 | FCFS FirstCash, Inc. |
| Sector: Financials | |
| SubSector: Credit Services | |
| MarketCap: 2795.48 Millions | |
| Recent Price: 117.53 Smart Investing & Trading Score: 73 | |
| Day Percent Change: 0.25% Day Change: 0.29 | |
| Week Change: -1.41% Year-to-date Change: 8.4% | |
| FCFS Links: Profile News Message Board | |
| Charts:- Daily , Weekly | |
| Add FCFS to Watchlist: View: Get Complete FCFS Trend Analysis ➞ | |
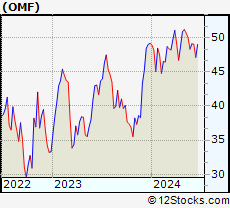 | OMF OneMain Holdings, Inc. |
| Sector: Financials | |
| SubSector: Credit Services | |
| MarketCap: 2753.38 Millions | |
| Recent Price: 49.98 Smart Investing & Trading Score: 41 | |
| Day Percent Change: 0.18% Day Change: 0.09 | |
| Week Change: -1.42% Year-to-date Change: 1.6% | |
| OMF Links: Profile News Message Board | |
| Charts:- Daily , Weekly | |
| Add OMF to Watchlist: View: Get Complete OMF Trend Analysis ➞ | |
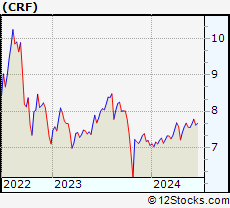 | CRF Cornerstone Total Return Fund, Inc. |
| Sector: Financials | |
| SubSector: Asset Management | |
| MarketCap: 262.903 Millions | |
| Recent Price: 7.56 Smart Investing & Trading Score: 83 | |
| Day Percent Change: 1.20% Day Change: 0.09 | |
| Week Change: -1.43% Year-to-date Change: 7.1% | |
| CRF Links: Profile News Message Board | |
| Charts:- Daily , Weekly | |
| Add CRF to Watchlist: View: Get Complete CRF Trend Analysis ➞ | |
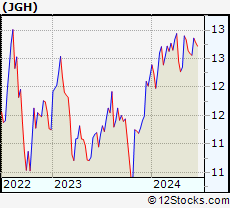 | JGH Nuveen Global High Income Fund |
| Sector: Financials | |
| SubSector: Asset Management | |
| MarketCap: 244.503 Millions | |
| Recent Price: 12.64 Smart Investing & Trading Score: 36 | |
| Day Percent Change: -0.24% Day Change: -0.03 | |
| Week Change: -1.48% Year-to-date Change: 3.6% | |
| JGH Links: Profile News Message Board | |
| Charts:- Daily , Weekly | |
| Add JGH to Watchlist: View: Get Complete JGH Trend Analysis ➞ | |
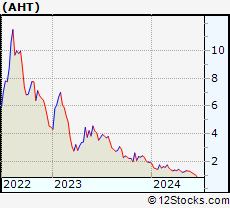 | AHT Ashford Hospitality Trust, Inc. |
| Sector: Financials | |
| SubSector: REIT - Hotel/Motel | |
| MarketCap: 171.034 Millions | |
| Recent Price: 1.30 Smart Investing & Trading Score: 42 | |
| Day Percent Change: -1.52% Day Change: -0.02 | |
| Week Change: -1.52% Year-to-date Change: -33.0% | |
| AHT Links: Profile News Message Board | |
| Charts:- Daily , Weekly | |
| Add AHT to Watchlist: View: Get Complete AHT Trend Analysis ➞ | |
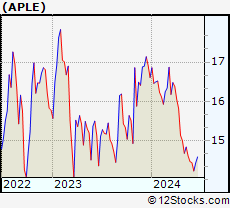 | APLE Apple Hospitality REIT, Inc. |
| Sector: Financials | |
| SubSector: REIT - Hotel/Motel | |
| MarketCap: 1515.74 Millions | |
| Recent Price: 14.61 Smart Investing & Trading Score: 17 | |
| Day Percent Change: -0.75% Day Change: -0.11 | |
| Week Change: -1.55% Year-to-date Change: -12.0% | |
| APLE Links: Profile News Message Board | |
| Charts:- Daily , Weekly | |
| Add APLE to Watchlist: View: Get Complete APLE Trend Analysis ➞ | |
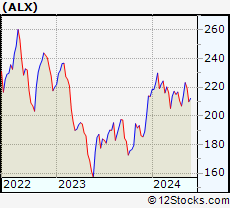 | ALX Alexander s, Inc. |
| Sector: Financials | |
| SubSector: REIT - Retail | |
| MarketCap: 1251.54 Millions | |
| Recent Price: 219.67 Smart Investing & Trading Score: 58 | |
| Day Percent Change: 0.70% Day Change: 1.53 | |
| Week Change: -1.56% Year-to-date Change: 2.9% | |
| ALX Links: Profile News Message Board | |
| Charts:- Daily , Weekly | |
| Add ALX to Watchlist: View: Get Complete ALX Trend Analysis ➞ | |
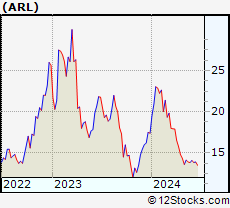 | ARL American Realty Investors, Inc. |
| Sector: Financials | |
| SubSector: Property Management | |
| MarketCap: 132.242 Millions | |
| Recent Price: 13.92 Smart Investing & Trading Score: 42 | |
| Day Percent Change: 0.72% Day Change: 0.10 | |
| Week Change: -1.56% Year-to-date Change: -20.1% | |
| ARL Links: Profile News Message Board | |
| Charts:- Daily , Weekly | |
| Add ARL to Watchlist: View: Get Complete ARL Trend Analysis ➞ | |
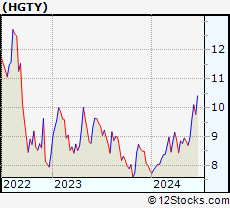 | HGTY Hagerty, Inc. |
| Sector: Financials | |
| SubSector: Insurance - Property & Casualty | |
| MarketCap: 3110 Millions | |
| Recent Price: 8.70 Smart Investing & Trading Score: 39 | |
| Day Percent Change: 1.52% Day Change: 0.13 | |
| Week Change: -1.58% Year-to-date Change: 11.3% | |
| HGTY Links: Profile News Message Board | |
| Charts:- Daily , Weekly | |
| Add HGTY to Watchlist: View: Get Complete HGTY Trend Analysis ➞ | |
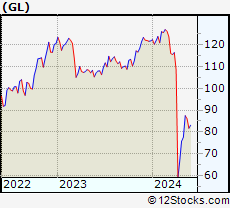 | GL Globe Life Inc. |
| Sector: Financials | |
| SubSector: Life Insurance | |
| MarketCap: 7596.46 Millions | |
| Recent Price: 86.07 Smart Investing & Trading Score: 25 | |
| Day Percent Change: 2.54% Day Change: 2.13 | |
| Week Change: -1.61% Year-to-date Change: -29.3% | |
| GL Links: Profile News Message Board | |
| Charts:- Daily , Weekly | |
| Add GL to Watchlist: View: Get Complete GL Trend Analysis ➞ | |
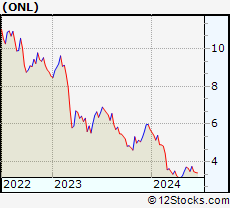 | ONL Orion Office REIT Inc. |
| Sector: Financials | |
| SubSector: REIT - Office | |
| MarketCap: 375 Millions | |
| Recent Price: 3.66 Smart Investing & Trading Score: 68 | |
| Day Percent Change: -1.61% Day Change: -0.06 | |
| Week Change: -1.61% Year-to-date Change: -36.0% | |
| ONL Links: Profile News Message Board | |
| Charts:- Daily , Weekly | |
| Add ONL to Watchlist: View: Get Complete ONL Trend Analysis ➞ | |
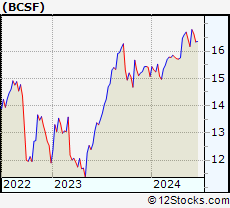 | BCSF Bain Capital Specialty Finance, Inc. |
| Sector: Financials | |
| SubSector: Asset Management | |
| MarketCap: 562.203 Millions | |
| Recent Price: 16.43 Smart Investing & Trading Score: 39 | |
| Day Percent Change: 0.74% Day Change: 0.12 | |
| Week Change: -1.62% Year-to-date Change: 9.0% | |
| BCSF Links: Profile News Message Board | |
| Charts:- Daily , Weekly | |
| Add BCSF to Watchlist: View: Get Complete BCSF Trend Analysis ➞ | |
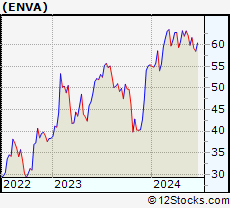 | ENVA Enova International, Inc. |
| Sector: Financials | |
| SubSector: Credit Services | |
| MarketCap: 345.508 Millions | |
| Recent Price: 62.16 Smart Investing & Trading Score: 37 | |
| Day Percent Change: 1.49% Day Change: 0.91 | |
| Week Change: -1.65% Year-to-date Change: 12.3% | |
| ENVA Links: Profile News Message Board | |
| Charts:- Daily , Weekly | |
| Add ENVA to Watchlist: View: Get Complete ENVA Trend Analysis ➞ | |
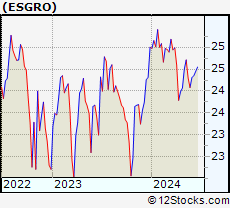 | ESGRO Enstar Group Limited |
| Sector: Financials | |
| SubSector: Insurance Brokers | |
| MarketCap: 438.867 Millions | |
| Recent Price: 24.30 Smart Investing & Trading Score: 33 | |
| Day Percent Change: -1.01% Day Change: -0.25 | |
| Week Change: -1.66% Year-to-date Change: -2.8% | |
| ESGRO Links: Profile News Message Board | |
| Charts:- Daily , Weekly | |
| Add ESGRO to Watchlist: View: Get Complete ESGRO Trend Analysis ➞ | |
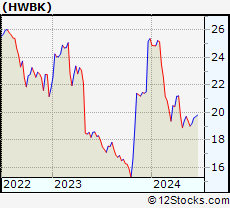 | HWBK Hawthorn Bancshares, Inc. |
| Sector: Financials | |
| SubSector: Regional - Northeast Banks | |
| MarketCap: 129.099 Millions | |
| Recent Price: 19.38 Smart Investing & Trading Score: 32 | |
| Day Percent Change: -0.72% Day Change: -0.14 | |
| Week Change: -1.67% Year-to-date Change: -23.6% | |
| HWBK Links: Profile News Message Board | |
| Charts:- Daily , Weekly | |
| Add HWBK to Watchlist: View: Get Complete HWBK Trend Analysis ➞ | |
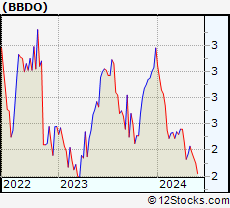 | BBDO Banco Bradesco S.A. |
| Sector: Financials | |
| SubSector: Foreign Regional Banks | |
| MarketCap: 27711.4 Millions | |
| Recent Price: 2.34 Smart Investing & Trading Score: 10 | |
| Day Percent Change: 1.25% Day Change: 0.03 | |
| Week Change: -1.68% Year-to-date Change: -26.4% | |
| BBDO Links: Profile News Message Board | |
| Charts:- Daily , Weekly | |
| Add BBDO to Watchlist: View: Get Complete BBDO Trend Analysis ➞ | |
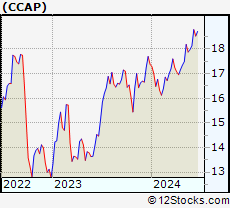 | CCAP Crescent Capital BDC, Inc. |
| Sector: Financials | |
| SubSector: Asset Management | |
| MarketCap: 41157 Millions | |
| Recent Price: 17.88 Smart Investing & Trading Score: 61 | |
| Day Percent Change: 0.39% Day Change: 0.07 | |
| Week Change: -1.7% Year-to-date Change: 2.9% | |
| CCAP Links: Profile News Message Board | |
| Charts:- Daily , Weekly | |
| Add CCAP to Watchlist: View: Get Complete CCAP Trend Analysis ➞ | |
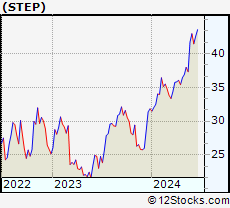 | STEP StepStone Group Inc. |
| Sector: Financials | |
| SubSector: Asset Management | |
| MarketCap: 30757 Millions | |
| Recent Price: 37.32 Smart Investing & Trading Score: 46 | |
| Day Percent Change: -0.32% Day Change: -0.12 | |
| Week Change: -1.71% Year-to-date Change: 17.2% | |
| STEP Links: Profile News Message Board | |
| Charts:- Daily , Weekly | |
| Add STEP to Watchlist: View: Get Complete STEP Trend Analysis ➞ | |
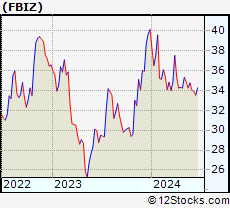 | FBIZ First Business Financial Services, Inc. |
| Sector: Financials | |
| SubSector: Regional - Midwest Banks | |
| MarketCap: 144.97 Millions | |
| Recent Price: 34.25 Smart Investing & Trading Score: 25 | |
| Day Percent Change: -0.72% Day Change: -0.25 | |
| Week Change: -1.75% Year-to-date Change: -14.6% | |
| FBIZ Links: Profile News Message Board | |
| Charts:- Daily , Weekly | |
| Add FBIZ to Watchlist: View: Get Complete FBIZ Trend Analysis ➞ | |
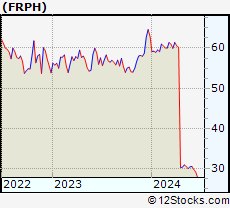 | FRPH FRP Holdings, Inc. |
| Sector: Financials | |
| SubSector: Property Management | |
| MarketCap: 374.442 Millions | |
| Recent Price: 30.08 Smart Investing & Trading Score: 23 | |
| Day Percent Change: 0.20% Day Change: 0.06 | |
| Week Change: -1.76% Year-to-date Change: -52.2% | |
| FRPH Links: Profile News Message Board | |
| Charts:- Daily , Weekly | |
| Add FRPH to Watchlist: View: Get Complete FRPH Trend Analysis ➞ | |
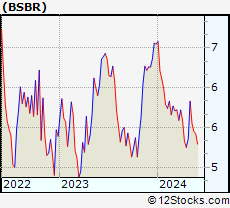 | BSBR Banco Santander (Brasil) S.A. |
| Sector: Financials | |
| SubSector: Foreign Regional Banks | |
| MarketCap: 21961.4 Millions | |
| Recent Price: 5.45 Smart Investing & Trading Score: 25 | |
| Day Percent Change: 0.00% Day Change: 0.00 | |
| Week Change: -1.8% Year-to-date Change: -16.8% | |
| BSBR Links: Profile News Message Board | |
| Charts:- Daily , Weekly | |
| Add BSBR to Watchlist: View: Get Complete BSBR Trend Analysis ➞ | |
| For tabular summary view of above stock list: Summary View ➞ 0 - 25 , 25 - 50 , 50 - 75 , 75 - 100 , 100 - 125 , 125 - 150 , 150 - 175 , 175 - 200 , 200 - 225 , 225 - 250 , 250 - 275 , 275 - 300 , 300 - 325 , 325 - 350 , 350 - 375 , 375 - 400 , 400 - 425 , 425 - 450 , 450 - 475 , 475 - 500 , 500 - 525 , 525 - 550 , 550 - 575 , 575 - 600 , 600 - 625 , 625 - 650 , 650 - 675 , 675 - 700 , 700 - 725 , 725 - 750 , 750 - 775 , 775 - 800 , 800 - 825 , 825 - 850 , 850 - 875 , 875 - 900 , 900 - 925 , 925 - 950 , 950 - 975 , 975 - 1000 , 1000 - 1025 , 1025 - 1050 , 1050 - 1075 , 1075 - 1100 , 1100 - 1125 , 1125 - 1150 , 1150 - 1175 , 1175 - 1200 , 1200 - 1225 | ||
| Click To Change The Sort Order: By Market Cap or Company Size Performance: Year-to-date, Week and Day | |
| Select Chart Type: | ||
|
Best Stocks Today 12Stocks.com |
© 2024 12Stocks.com Terms & Conditions Privacy Contact Us
All Information Provided Only For Education And Not To Be Used For Investing or Trading. See Terms & Conditions


One More Thing ... Get Best Stocks Delivered Daily!
Never Ever Miss A Move With Our Top Ten Stocks Lists
Find Best Stocks In Any Market - Bull or Bear Market
Take A Peek At Our Top Ten Stocks Lists: Daily, Weekly, Year-to-Date & Top Trends
Find Best Stocks In Any Market - Bull or Bear Market
Take A Peek At Our Top Ten Stocks Lists: Daily, Weekly, Year-to-Date & Top Trends
Financial Stocks With Best Up Trends [0-bearish to 100-bullish]: Fangdd Network[100], Xinyuan Real[100], MicroSectors Gold[100], Sprott Physical[100], Citizens & Northern[100], Sumitomo Mitsui[100], First Community[100], Chubb [100], Angel Oak[100], Sprott Physical[100], Iris Energy[100]
Best Financial Stocks Year-to-Date:
Root [526.36%], Fangdd Network[149.63%], Banco Macro[126.41%], Grupo Financiero[112.4%], Banco BBVA[110.66%], SelectQuote [110.22%], Gladstone Capital[106.92%], EverQuote [98.2%], Hippo [92.54%], Grupo Supervielle[86.95%], Vista Oil[60.93%] Best Financial Stocks This Week:
Fangdd Network[360.27%], Xinyuan Real[53.28%], Iris Energy[25.68%], Fathom [25.35%], Huize Holding[21.83%], First Foundation[18.98%], Trupanion [17.21%], Bridge [16.67%], MicroSectors Gold[15.19%], KE [13.86%], Douglas Elliman[13.56%] Best Financial Stocks Daily:
Fangdd Network[321.26%], Xinyuan Real[39.49%], MicroSectors Gold[12.02%], Fathom [9.88%], Citizens [8.53%], Hywin [8.28%], Root [6.10%], First Foundation[6.09%], Sprott Physical[6.09%], Freedom Holding[5.02%], NexGen Energy[4.99%]