
 Login Sign Up


| |||||
 |  | ||||

| 12Stocks.com Market Intelligence |
Best Financial Stocks
| In a hurry? Financial Stocks Lists: Performance Trends Table, Stock Charts
Sort Financial stocks: Daily, Weekly, Year-to-Date, Market Cap & Trends. Filter Financial stocks list by size:All Financial Large Mid-Range Small & MicroCap |
| 12Stocks.com Financial Stocks Performances & Trends Daily | |||||||||
|
|  The overall Smart Investing & Trading Score is 95 (0-bearish to 100-bullish) which puts Financial sector in short term bullish trend. The Smart Investing & Trading Score from previous trading session is 100 and a deterioration of trend continues.
| ||||||||
Here are the Smart Investing & Trading Scores of the most requested Financial stocks at 12Stocks.com (click stock name for detailed review):
|


| 12Stocks.com: Investing in Financial sector with Stocks | |
|
The following table helps investors and traders sort through current performance and trends (as measured by Smart Investing & Trading Score) of various
stocks in the Financial sector. Quick View: Move mouse or cursor over stock symbol (ticker) to view short-term Technical chart and over stock name to view long term chart. Click on  to add stock symbol to your watchlist and to add stock symbol to your watchlist and  to view watchlist. Click on any ticker or stock name for detailed market intelligence report for that stock. to view watchlist. Click on any ticker or stock name for detailed market intelligence report for that stock. |
12Stocks.com Performance of Stocks in Financial Sector
| Ticker | Stock Name | Watchlist | Category | Recent Price | Smart Investing & Trading Score | Change % | Weekly Change% |
| USB | U.S. Bancorp |   | Regional Banks | 41.43 | 30 | -0.53% | -1.00% |
| CIK | Credit Suisse | | Asset Mgmt | 2.88 | 10 | -0.69% | -1.03% |
| GOF | Guggenheim Strategic | | Closed-End Fund - Debt | 14.41 | 44 | -0.14% | -1.03% |
| SCM | Stellus Capital | | Asset Mgmt | 14.15 | 51 | -0.49% | -1.05% |
| CLM | Cornerstone Strategic | | Asset Mgmt | 7.53 | 81 | 0.80% | -1.05% |
| PHT | Pioneer High | | Closed-End Fund - Debt | 7.44 | 15 | -0.27% | -1.06% |
| AMSF | Amerisafe | | Insurance | 46.37 | 23 | -0.13% | -1.07% |
| FSV | FirstService | | Property Mgmt | 148.62 | 18 | -0.37% | -1.11% |
| CGBD | TCG BDC | | Asset Mgmt | 17.63 | 63 | 0.40% | -1.12% |
| FHI | Federated Hermes | | Asset Mgmt | 32.79 | 18 | -0.79% | -1.15% |
| FDUS | Fidus | | Asset Mgmt | 19.79 | 51 | 0.00% | -1.15% |
| BFAC | Battery Future | | SPAC | 11.01 | 28 | 0.00% | -1.17% |
| MSBI | Midland States | | Regional Banks | 23.41 | 32 | -0.17% | -1.18% |
| OXLCO | Oxford Lane | | Asset Mgmt | 22.10 | 35 | 0.09% | -1.18% |
| WU | Western Union | | Credit Services | 13.14 | 5 | -0.38% | -1.20% |
| XHR | Xenia Hotels | | REIT | 14.69 | 40 | -1.01% | -1.21% |
| CHCO | City Holding | | Regional Banks | 104.62 | 76 | 0.53% | -1.24% |
| JQC | Nuveen Credit | | Closed-End Fund - Debt | 5.59 | 54 | 0.18% | -1.27% |
| ESGRP | Enstar | | Insurance | 25.13 | 8 | -0.29% | -1.27% |
| HPP | Hudson Pacific | | REIT - Office | 5.36 | 17 | -4.63% | -1.29% |
| ACRE | Ares Commercial | | Mortgage | 6.82 | 25 | -0.15% | -1.30% |
| WFC | Wells Fargo | | Banks | 61.08 | 58 | 0.03% | -1.31% |
| BCAT | BlackRock Capital | | Closed-End Fund - Equity | 15.79 | 54 | -0.25% | -1.31% |
| HYT | BlackRock Corporate | | Closed-End Fund - Debt | 9.72 | 8 | -0.21% | -1.32% |
| MAIN | Main Street | | Investments | 48.75 | 39 | 0.21% | -1.32% |
| For chart view version of above stock list: Chart View ➞ 0 - 25 , 25 - 50 , 50 - 75 , 75 - 100 , 100 - 125 , 125 - 150 , 150 - 175 , 175 - 200 , 200 - 225 , 225 - 250 , 250 - 275 , 275 - 300 , 300 - 325 , 325 - 350 , 350 - 375 , 375 - 400 , 400 - 425 , 425 - 450 , 450 - 475 , 475 - 500 , 500 - 525 , 525 - 550 , 550 - 575 , 575 - 600 , 600 - 625 , 625 - 650 , 650 - 675 , 675 - 700 , 700 - 725 , 725 - 750 , 750 - 775 , 775 - 800 , 800 - 825 , 825 - 850 , 850 - 875 , 875 - 900 , 900 - 925 , 925 - 950 , 950 - 975 , 975 - 1000 , 1000 - 1025 , 1025 - 1050 , 1050 - 1075 , 1075 - 1100 , 1100 - 1125 , 1125 - 1150 , 1150 - 1175 , 1175 - 1200 , 1200 - 1225 | ||
 | Click To Change The Sort Order: By Market Cap or Company Size Performance: Year-to-date, Week and Day |  |
|
Get the most comprehensive stock market coverage daily at 12Stocks.com ➞ Best Stocks Today ➞ Best Stocks Weekly ➞ Best Stocks Year-to-Date ➞ Best Stocks Trends ➞  Best Stocks Today 12Stocks.com Best Nasdaq Stocks ➞ Best S&P 500 Stocks ➞ Best Tech Stocks ➞ Best Biotech Stocks ➞ |
| Detailed Overview of Financial Stocks |
| Financial Technical Overview, Leaders & Laggards, Top Financial ETF Funds & Detailed Financial Stocks List, Charts, Trends & More |
| Financial Sector: Technical Analysis, Trends & YTD Performance | |
| Financial sector is composed of stocks
from banks, brokers, insurance, REITs
and services subsectors. Financial sector, as represented by XLF, an exchange-traded fund [ETF] that holds basket of Financial stocks (e.g, Bank of America, Goldman Sachs) is up by 13.01% and is currently outperforming the overall market by 2.44% year-to-date. Below is a quick view of Technical charts and trends: |
|
 XLF Weekly Chart |
|
| Long Term Trend: Very Good | |
| Medium Term Trend: Very Good | |
 XLF Daily Chart |
|
| Short Term Trend: Very Good | |
| Overall Trend Score: 95 | |
| YTD Performance: 13.01% | |
| **Trend Scores & Views Are Only For Educational Purposes And Not For Investing | |
| 12Stocks.com: Top Performing Financial Sector Stocks | ||||||||||||||||||||||||||||||||||||||||||||||||
 The top performing Financial sector stocks year to date are
Now, more recently, over last week, the top performing Financial sector stocks on the move are


|
||||||||||||||||||||||||||||||||||||||||||||||||
| 12Stocks.com: Investing in Financial Sector using Exchange Traded Funds | |
|
The following table shows list of key exchange traded funds (ETF) that
help investors track Financial Index. For detailed view, check out our ETF Funds section of our website. Quick View: Move mouse or cursor over ETF symbol (ticker) to view short-term Technical chart and over ETF name to view long term chart. Click on ticker or stock name for detailed view. Click on to add stock symbol to your watchlist and to view watchlist. |
12Stocks.com List of ETFs that track Financial Index
| Ticker | ETF Name | Watchlist | Recent Price | Smart Investing & Trading Score | Change % | Week % | Year-to-date % |
| XLF | Financial | | 42.49 | 95 | 0.73 | 1.58 | 13.01% |
| IAI | Broker-Dealers & Secs | | 119.47 | 100 | 1.08 | 2.59 | 10.08% |
| IYF | Financials | | 96.85 | 95 | 0.43 | 1.73 | 13.39% |
| IYG | Financial Services | | 67.11 | 95 | 0.15 | 1.56 | 12.34% |
| KRE | Regional Banking | | 51.19 | 83 | 0.23 | 1.67 | -2.37% |
| IXG | Global Financials | | 88.72 | 88 | 0.21 | 1.41 | 12.91% |
| VFH | Financials | | 103.00 | 95 | 0.18 | 1.45 | 11.64% |
| KBE | Bank | | 47.93 | 83 | 0.44 | 1.25 | 4.15% |
| FAS | Financial Bull 3X | | 112.32 | 95 | 1.81 | 4.06 | 35.9% |
| FAZ | Financial Bear 3X | | 9.75 | 10 | -1.71 | -3.75 | -28.68% |
| UYG | Financials | | 68.54 | 100 | 1.23 | 2.77 | 24.17% |
| IAT | Regional Banks | | 43.42 | 76 | -0.26 | 1.02 | 3.78% |
| KIE | Insurance | | 51.83 | 100 | 0.88 | 1.09 | 14.62% |
| PSCF | SmallCap Financials | | 49.03 | 95 | 0.28 | 1.44 | -0.31% |
| EUFN | Europe Financials | | 24.13 | 95 | 0.67 | 2.51 | 15.12% |
| PGF | Financial Preferred | | 14.81 | 52 | -0.10 | 0.68 | 1.58% |
| 12Stocks.com: Charts, Trends, Fundamental Data and Performances of Financial Stocks | |
|
We now take in-depth look at all Financial stocks including charts, multi-period performances and overall trends (as measured by Smart Investing & Trading Score). One can sort Financial stocks (click link to choose) by Daily, Weekly and by Year-to-Date performances. Also, one can sort by size of the company or by market capitalization. |
| Select Your Default Chart Type: | |||||
| |||||
| Click on stock symbol or name for detailed view. Click on to add stock symbol to your watchlist and to view watchlist. Quick View: Move mouse or cursor over "Daily" to quickly view daily Technical stock chart and over "Weekly" to view weekly Technical stock chart. | |||||

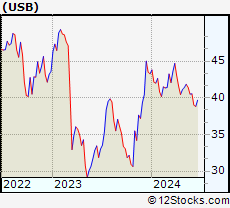 | USB U.S. Bancorp |
| Sector: Financials | |
| SubSector: Regional - Midwest Banks | |
| MarketCap: 56757.8 Millions | |
| Recent Price: 41.43 Smart Investing & Trading Score: 30 | |
| Day Percent Change: -0.53% Day Change: -0.22 | |
| Week Change: -1% Year-to-date Change: -4.3% | |
| USB Links: Profile News Message Board | |
| Charts:- Daily , Weekly | |
| Add USB to Watchlist: View: Get Complete USB Trend Analysis ➞ | |
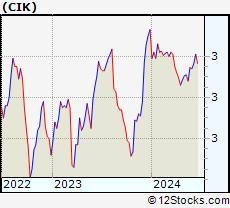 | CIK Credit Suisse Asset Management Income Fund, Inc. |
| Sector: Financials | |
| SubSector: Asset Management | |
| MarketCap: 114.503 Millions | |
| Recent Price: 2.88 Smart Investing & Trading Score: 10 | |
| Day Percent Change: -0.69% Day Change: -0.02 | |
| Week Change: -1.03% Year-to-date Change: -8.0% | |
| CIK Links: Profile News Message Board | |
| Charts:- Daily , Weekly | |
| Add CIK to Watchlist: View: Get Complete CIK Trend Analysis ➞ | |
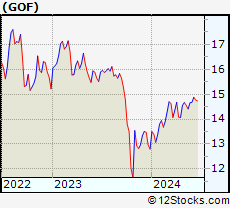 | GOF Guggenheim Strategic Opportunities Fund |
| Sector: Financials | |
| SubSector: Closed-End Fund - Debt | |
| MarketCap: 609.107 Millions | |
| Recent Price: 14.41 Smart Investing & Trading Score: 44 | |
| Day Percent Change: -0.14% Day Change: -0.02 | |
| Week Change: -1.03% Year-to-date Change: 12.6% | |
| GOF Links: Profile News Message Board | |
| Charts:- Daily , Weekly | |
| Add GOF to Watchlist: View: Get Complete GOF Trend Analysis ➞ | |
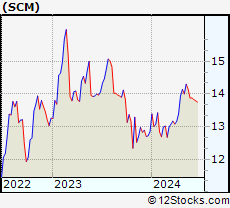 | SCM Stellus Capital Investment Corporation |
| Sector: Financials | |
| SubSector: Asset Management | |
| MarketCap: 127.403 Millions | |
| Recent Price: 14.15 Smart Investing & Trading Score: 51 | |
| Day Percent Change: -0.49% Day Change: -0.07 | |
| Week Change: -1.05% Year-to-date Change: 10.1% | |
| SCM Links: Profile News Message Board | |
| Charts:- Daily , Weekly | |
| Add SCM to Watchlist: View: Get Complete SCM Trend Analysis ➞ | |
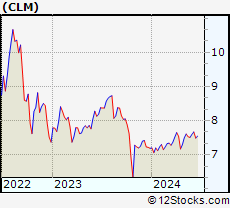 | CLM Cornerstone Strategic Value Fund, Inc. |
| Sector: Financials | |
| SubSector: Asset Management | |
| MarketCap: 512.703 Millions | |
| Recent Price: 7.53 Smart Investing & Trading Score: 81 | |
| Day Percent Change: 0.80% Day Change: 0.06 | |
| Week Change: -1.05% Year-to-date Change: 4.7% | |
| CLM Links: Profile News Message Board | |
| Charts:- Daily , Weekly | |
| Add CLM to Watchlist: View: Get Complete CLM Trend Analysis ➞ | |
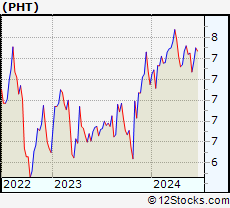 | PHT Pioneer High Income Trust |
| Sector: Financials | |
| SubSector: Closed-End Fund - Debt | |
| MarketCap: 168.007 Millions | |
| Recent Price: 7.44 Smart Investing & Trading Score: 15 | |
| Day Percent Change: -0.27% Day Change: -0.02 | |
| Week Change: -1.06% Year-to-date Change: 4.1% | |
| PHT Links: Profile News Message Board | |
| Charts:- Daily , Weekly | |
| Add PHT to Watchlist: View: Get Complete PHT Trend Analysis ➞ | |
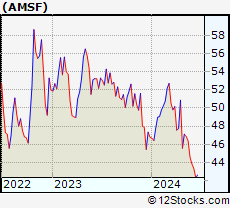 | AMSF Amerisafe, Inc. |
| Sector: Financials | |
| SubSector: Property & Casualty Insurance | |
| MarketCap: 1159.32 Millions | |
| Recent Price: 46.37 Smart Investing & Trading Score: 23 | |
| Day Percent Change: -0.13% Day Change: -0.06 | |
| Week Change: -1.07% Year-to-date Change: -0.9% | |
| AMSF Links: Profile News Message Board | |
| Charts:- Daily , Weekly | |
| Add AMSF to Watchlist: View: Get Complete AMSF Trend Analysis ➞ | |
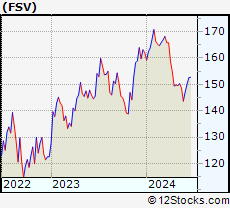 | FSV FirstService Corporation |
| Sector: Financials | |
| SubSector: Property Management | |
| MarketCap: 2793.92 Millions | |
| Recent Price: 148.62 Smart Investing & Trading Score: 18 | |
| Day Percent Change: -0.37% Day Change: -0.55 | |
| Week Change: -1.11% Year-to-date Change: -8.3% | |
| FSV Links: Profile News Message Board | |
| Charts:- Daily , Weekly | |
| Add FSV to Watchlist: View: Get Complete FSV Trend Analysis ➞ | |
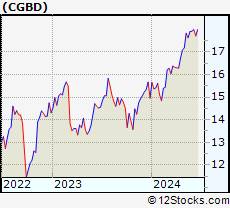 | CGBD TCG BDC, Inc. |
| Sector: Financials | |
| SubSector: Asset Management | |
| MarketCap: 379.003 Millions | |
| Recent Price: 17.63 Smart Investing & Trading Score: 63 | |
| Day Percent Change: 0.40% Day Change: 0.07 | |
| Week Change: -1.12% Year-to-date Change: 17.9% | |
| CGBD Links: Profile News Message Board | |
| Charts:- Daily , Weekly | |
| Add CGBD to Watchlist: View: Get Complete CGBD Trend Analysis ➞ | |
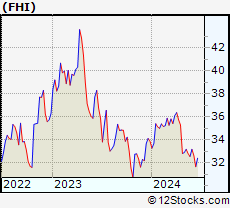 | FHI Federated Hermes, Inc. |
| Sector: Financials | |
| SubSector: Asset Management | |
| MarketCap: 1883.03 Millions | |
| Recent Price: 32.79 Smart Investing & Trading Score: 18 | |
| Day Percent Change: -0.79% Day Change: -0.26 | |
| Week Change: -1.15% Year-to-date Change: -3.2% | |
| FHI Links: Profile News Message Board | |
| Charts:- Daily , Weekly | |
| Add FHI to Watchlist: View: Get Complete FHI Trend Analysis ➞ | |
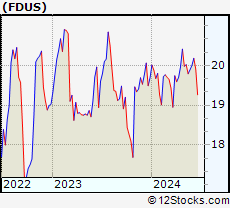 | FDUS Fidus Investment Corporation |
| Sector: Financials | |
| SubSector: Asset Management | |
| MarketCap: 161.003 Millions | |
| Recent Price: 19.79 Smart Investing & Trading Score: 51 | |
| Day Percent Change: 0.00% Day Change: 0.00 | |
| Week Change: -1.15% Year-to-date Change: 0.5% | |
| FDUS Links: Profile News Message Board | |
| Charts:- Daily , Weekly | |
| Add FDUS to Watchlist: View: Get Complete FDUS Trend Analysis ➞ | |
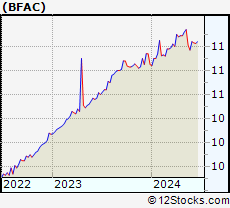 | BFAC Battery Future Acquisition Corp. |
| Sector: Financials | |
| SubSector: SPAC | |
| MarketCap: 213 Millions | |
| Recent Price: 11.01 Smart Investing & Trading Score: 28 | |
| Day Percent Change: 0.00% Day Change: 0.00 | |
| Week Change: -1.17% Year-to-date Change: 1.5% | |
| BFAC Links: Profile News Message Board | |
| Charts:- Daily , Weekly | |
| Add BFAC to Watchlist: View: Get Complete BFAC Trend Analysis ➞ | |
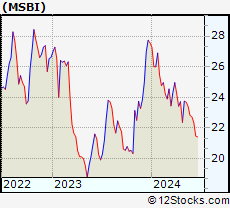 | MSBI Midland States Bancorp, Inc. |
| Sector: Financials | |
| SubSector: Regional - Midwest Banks | |
| MarketCap: 400.27 Millions | |
| Recent Price: 23.41 Smart Investing & Trading Score: 32 | |
| Day Percent Change: -0.17% Day Change: -0.04 | |
| Week Change: -1.18% Year-to-date Change: -15.1% | |
| MSBI Links: Profile News Message Board | |
| Charts:- Daily , Weekly | |
| Add MSBI to Watchlist: View: Get Complete MSBI Trend Analysis ➞ | |
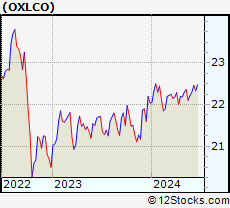 | OXLCO Oxford Lane Capital Corp. |
| Sector: Financials | |
| SubSector: Asset Management | |
| MarketCap: 718.003 Millions | |
| Recent Price: 22.10 Smart Investing & Trading Score: 35 | |
| Day Percent Change: 0.09% Day Change: 0.02 | |
| Week Change: -1.18% Year-to-date Change: 0.3% | |
| OXLCO Links: Profile News Message Board | |
| Charts:- Daily , Weekly | |
| Add OXLCO to Watchlist: View: Get Complete OXLCO Trend Analysis ➞ | |
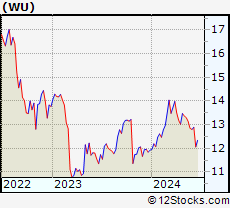 | WU The Western Union Company |
| Sector: Financials | |
| SubSector: Credit Services | |
| MarketCap: 7974.48 Millions | |
| Recent Price: 13.14 Smart Investing & Trading Score: 5 | |
| Day Percent Change: -0.38% Day Change: -0.05 | |
| Week Change: -1.2% Year-to-date Change: 10.2% | |
| WU Links: Profile News Message Board | |
| Charts:- Daily , Weekly | |
| Add WU to Watchlist: View: Get Complete WU Trend Analysis ➞ | |
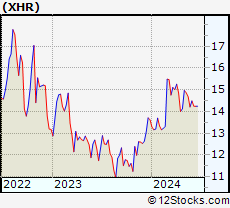 | XHR Xenia Hotels & Resorts, Inc. |
| Sector: Financials | |
| SubSector: REIT - Hotel/Motel | |
| MarketCap: 1058.24 Millions | |
| Recent Price: 14.69 Smart Investing & Trading Score: 40 | |
| Day Percent Change: -1.01% Day Change: -0.15 | |
| Week Change: -1.21% Year-to-date Change: 7.9% | |
| XHR Links: Profile News Message Board | |
| Charts:- Daily , Weekly | |
| Add XHR to Watchlist: View: Get Complete XHR Trend Analysis ➞ | |
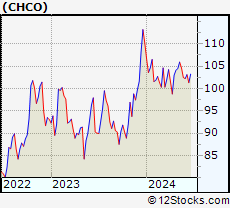 | CHCO City Holding Company |
| Sector: Financials | |
| SubSector: Regional - Mid-Atlantic Banks | |
| MarketCap: 1059.59 Millions | |
| Recent Price: 104.62 Smart Investing & Trading Score: 76 | |
| Day Percent Change: 0.53% Day Change: 0.55 | |
| Week Change: -1.24% Year-to-date Change: -5.1% | |
| CHCO Links: Profile News Message Board | |
| Charts:- Daily , Weekly | |
| Add CHCO to Watchlist: View: Get Complete CHCO Trend Analysis ➞ | |
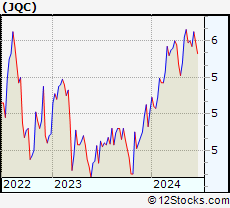 | JQC Nuveen Credit Strategies Income Fund |
| Sector: Financials | |
| SubSector: Closed-End Fund - Debt | |
| MarketCap: 638.707 Millions | |
| Recent Price: 5.59 Smart Investing & Trading Score: 54 | |
| Day Percent Change: 0.18% Day Change: 0.01 | |
| Week Change: -1.27% Year-to-date Change: 7.1% | |
| JQC Links: Profile News Message Board | |
| Charts:- Daily , Weekly | |
| Add JQC to Watchlist: View: Get Complete JQC Trend Analysis ➞ | |
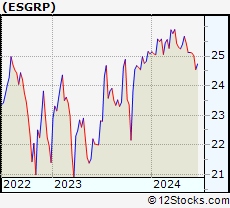 | ESGRP Enstar Group Limited |
| Sector: Financials | |
| SubSector: Insurance Brokers | |
| MarketCap: 388.867 Millions | |
| Recent Price: 25.13 Smart Investing & Trading Score: 8 | |
| Day Percent Change: -0.29% Day Change: -0.07 | |
| Week Change: -1.27% Year-to-date Change: 0.2% | |
| ESGRP Links: Profile News Message Board | |
| Charts:- Daily , Weekly | |
| Add ESGRP to Watchlist: View: Get Complete ESGRP Trend Analysis ➞ | |
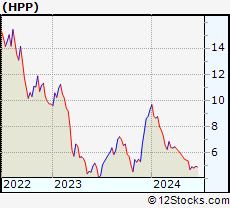 | HPP Hudson Pacific Properties, Inc. |
| Sector: Financials | |
| SubSector: REIT - Office | |
| MarketCap: 3267.16 Millions | |
| Recent Price: 5.36 Smart Investing & Trading Score: 17 | |
| Day Percent Change: -4.63% Day Change: -0.26 | |
| Week Change: -1.29% Year-to-date Change: -42.4% | |
| HPP Links: Profile News Message Board | |
| Charts:- Daily , Weekly | |
| Add HPP to Watchlist: View: Get Complete HPP Trend Analysis ➞ | |
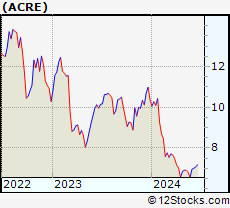 | ACRE Ares Commercial Real Estate Corporation |
| Sector: Financials | |
| SubSector: Mortgage Investment | |
| MarketCap: 242.339 Millions | |
| Recent Price: 6.82 Smart Investing & Trading Score: 25 | |
| Day Percent Change: -0.15% Day Change: -0.01 | |
| Week Change: -1.3% Year-to-date Change: -34.2% | |
| ACRE Links: Profile News Message Board | |
| Charts:- Daily , Weekly | |
| Add ACRE to Watchlist: View: Get Complete ACRE Trend Analysis ➞ | |
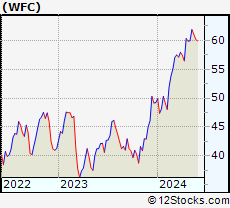 | WFC Wells Fargo & Company |
| Sector: Financials | |
| SubSector: Money Center Banks | |
| MarketCap: 129138 Millions | |
| Recent Price: 61.08 Smart Investing & Trading Score: 58 | |
| Day Percent Change: 0.03% Day Change: 0.02 | |
| Week Change: -1.31% Year-to-date Change: 24.1% | |
| WFC Links: Profile News Message Board | |
| Charts:- Daily , Weekly | |
| Add WFC to Watchlist: View: Get Complete WFC Trend Analysis ➞ | |
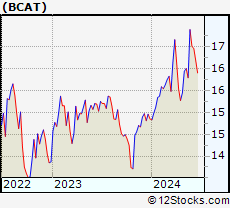 | BCAT BlackRock Capital Allocation Term Trust |
| Sector: Financials | |
| SubSector: Closed-End Fund - Equity | |
| MarketCap: 1650 Millions | |
| Recent Price: 15.79 Smart Investing & Trading Score: 54 | |
| Day Percent Change: -0.25% Day Change: -0.04 | |
| Week Change: -1.31% Year-to-date Change: 6.3% | |
| BCAT Links: Profile News Message Board | |
| Charts:- Daily , Weekly | |
| Add BCAT to Watchlist: View: Get Complete BCAT Trend Analysis ➞ | |
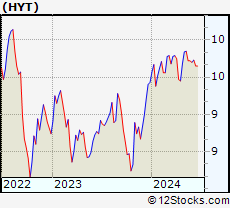 | HYT BlackRock Corporate High Yield Fund, Inc. |
| Sector: Financials | |
| SubSector: Closed-End Fund - Debt | |
| MarketCap: 902.007 Millions | |
| Recent Price: 9.72 Smart Investing & Trading Score: 8 | |
| Day Percent Change: -0.21% Day Change: -0.02 | |
| Week Change: -1.32% Year-to-date Change: 3.1% | |
| HYT Links: Profile News Message Board | |
| Charts:- Daily , Weekly | |
| Add HYT to Watchlist: View: Get Complete HYT Trend Analysis ➞ | |
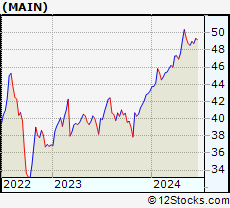 | MAIN Main Street Capital Corporation |
| Sector: Financials | |
| SubSector: Diversified Investments | |
| MarketCap: 1355.7 Millions | |
| Recent Price: 48.75 Smart Investing & Trading Score: 39 | |
| Day Percent Change: 0.21% Day Change: 0.10 | |
| Week Change: -1.32% Year-to-date Change: 12.8% | |
| MAIN Links: Profile News Message Board | |
| Charts:- Daily , Weekly | |
| Add MAIN to Watchlist: View: Get Complete MAIN Trend Analysis ➞ | |
| For tabular summary view of above stock list: Summary View ➞ 0 - 25 , 25 - 50 , 50 - 75 , 75 - 100 , 100 - 125 , 125 - 150 , 150 - 175 , 175 - 200 , 200 - 225 , 225 - 250 , 250 - 275 , 275 - 300 , 300 - 325 , 325 - 350 , 350 - 375 , 375 - 400 , 400 - 425 , 425 - 450 , 450 - 475 , 475 - 500 , 500 - 525 , 525 - 550 , 550 - 575 , 575 - 600 , 600 - 625 , 625 - 650 , 650 - 675 , 675 - 700 , 700 - 725 , 725 - 750 , 750 - 775 , 775 - 800 , 800 - 825 , 825 - 850 , 850 - 875 , 875 - 900 , 900 - 925 , 925 - 950 , 950 - 975 , 975 - 1000 , 1000 - 1025 , 1025 - 1050 , 1050 - 1075 , 1075 - 1100 , 1100 - 1125 , 1125 - 1150 , 1150 - 1175 , 1175 - 1200 , 1200 - 1225 | ||
| Click To Change The Sort Order: By Market Cap or Company Size Performance: Year-to-date, Week and Day | |
| Select Chart Type: | ||
|
Best Stocks Today 12Stocks.com |
© 2024 12Stocks.com Terms & Conditions Privacy Contact Us
All Information Provided Only For Education And Not To Be Used For Investing or Trading. See Terms & Conditions


One More Thing ... Get Best Stocks Delivered Daily!
Never Ever Miss A Move With Our Top Ten Stocks Lists
Find Best Stocks In Any Market - Bull or Bear Market
Take A Peek At Our Top Ten Stocks Lists: Daily, Weekly, Year-to-Date & Top Trends
Find Best Stocks In Any Market - Bull or Bear Market
Take A Peek At Our Top Ten Stocks Lists: Daily, Weekly, Year-to-Date & Top Trends
Financial Stocks With Best Up Trends [0-bearish to 100-bullish]: Fangdd Network[100], Xinyuan Real[100], MicroSectors Gold[100], Sprott Physical[100], Citizens & Northern[100], Sumitomo Mitsui[100], First Community[100], Chubb [100], Angel Oak[100], Sprott Physical[100], Iris Energy[100]
Best Financial Stocks Year-to-Date:
Root [526.36%], Fangdd Network[149.63%], Banco Macro[126.41%], Grupo Financiero[112.4%], Banco BBVA[110.66%], SelectQuote [110.22%], Gladstone Capital[106.92%], EverQuote [98.2%], Hippo [92.54%], Grupo Supervielle[86.95%], Vista Oil[60.93%] Best Financial Stocks This Week:
Fangdd Network[360.27%], Xinyuan Real[53.28%], Iris Energy[25.68%], Fathom [25.35%], Huize Holding[21.83%], First Foundation[18.98%], Trupanion [17.21%], Bridge [16.67%], MicroSectors Gold[15.19%], KE [13.86%], Douglas Elliman[13.56%] Best Financial Stocks Daily:
Fangdd Network[321.26%], Xinyuan Real[39.49%], MicroSectors Gold[12.02%], Fathom [9.88%], Citizens [8.53%], Hywin [8.28%], Root [6.10%], First Foundation[6.09%], Sprott Physical[6.09%], Freedom Holding[5.02%], NexGen Energy[4.99%]