
 Login Sign Up


| |||||
 |  | ||||

| 12Stocks.com Market Intelligence |
Best Financial Stocks
| In a hurry? Financial Stocks Lists: Performance Trends Table, Stock Charts
Sort Financial stocks: Daily, Weekly, Year-to-Date, Market Cap & Trends. Filter Financial stocks list by size:All Financial Large Mid-Range Small & MicroCap |
| 12Stocks.com Financial Stocks Performances & Trends Daily | |||||||||
|
|  The overall Smart Investing & Trading Score is 95 (0-bearish to 100-bullish) which puts Financial sector in short term bullish trend. The Smart Investing & Trading Score from previous trading session is 100 and a deterioration of trend continues.
| ||||||||
Here are the Smart Investing & Trading Scores of the most requested Financial stocks at 12Stocks.com (click stock name for detailed review):
|


| 12Stocks.com: Investing in Financial sector with Stocks | |
|
The following table helps investors and traders sort through current performance and trends (as measured by Smart Investing & Trading Score) of various
stocks in the Financial sector. Quick View: Move mouse or cursor over stock symbol (ticker) to view short-term Technical chart and over stock name to view long term chart. Click on  to add stock symbol to your watchlist and to add stock symbol to your watchlist and  to view watchlist. Click on any ticker or stock name for detailed market intelligence report for that stock. to view watchlist. Click on any ticker or stock name for detailed market intelligence report for that stock. |
12Stocks.com Performance of Stocks in Financial Sector
| Ticker | Stock Name | Watchlist | Category | Recent Price | Smart Investing & Trading Score | Change % | Weekly Change% |
| CNO | CNO |   | Insurance | 28.90 | 95 | 0.31% | 2.26% |
| CME | CME | | Brokerage | 213.14 | 64 | 0.19% | 2.25% |
| BGT | BlackRock Floating | | Closed-End Fund - Debt | 13.68 | 88 | 1.11% | 2.24% |
| CCNE | CNB | | Regional Banks | 20.53 | 95 | 0.39% | 2.24% |
| ACGLN | Arch Capital | | Insurance - | 19.74 | 57 | 0.56% | 2.23% |
| REG | Regency Centers | | REIT - Retail | 60.89 | 74 | 1.28% | 2.22% |
| INDB | Independent Bank | | Regional Banks | 52.95 | 85 | 0.47% | 2.22% |
| WELL | Welltower | | REIT | 101.29 | 90 | 0.34% | 2.21% |
| STC | Stewart Information | | Insurance | 64.65 | 95 | 0.40% | 2.20% |
| VICI | VICI Properties | | REIT - | 30.38 | 88 | 0.33% | 2.20% |
| QQQM | Invesco NASDAQ | | Exchange Traded Fund | 185.91 | 78 | -0.05% | 2.20% |
| FLIC | First of Long Island | | Regional Banks | 10.71 | 74 | 0.75% | 2.19% |
| BAC | Bank of America | | Banks | 39.29 | 100 | 0.18% | 2.18% |
| HSBC | HSBC | | Foreign Banks | 44.54 | 76 | 0.25% | 2.16% |
| MMC | Marsh & McLennan | | Insurance | 209.97 | 100 | 0.40% | 2.15% |
| UBS | UBS | | Foreign Banks | 30.34 | 73 | 1.07% | 2.15% |
| NXRT | NexPoint Residential | | REIT | 36.51 | 83 | 0.41% | 2.13% |
| ILPT | Industrial Logistics | | REIT - Industrial | 4.08 | 63 | -1.81% | 2.13% |
| FCNCP | First Citizens | | Banks Regional | 22.05 | 82 | -0.32% | 2.13% |
| KEY | KeyCorp | | Regional Banks | 15.40 | 95 | 0.46% | 2.12% |
| ARE | Alexandria Real | | REIT - Office | 124.17 | 63 | 0.09% | 2.12% |
| BDN | Brandywine Realty | | REIT - | 4.81 | 68 | -1.64% | 2.12% |
| MEGI | MainStay CBRE | | Closed-End Fund - Equity | 13.46 | 83 | 0.22% | 2.12% |
| VNO | Vornado Realty | | REIT - | 24.73 | 10 | -0.28% | 2.11% |
| TCBK | TriCo Bancshares | | Regional Banks | 38.74 | 90 | 0.75% | 2.11% |
| For chart view version of above stock list: Chart View ➞ 0 - 25 , 25 - 50 , 50 - 75 , 75 - 100 , 100 - 125 , 125 - 150 , 150 - 175 , 175 - 200 , 200 - 225 , 225 - 250 , 250 - 275 , 275 - 300 , 300 - 325 , 325 - 350 , 350 - 375 , 375 - 400 , 400 - 425 , 425 - 450 , 450 - 475 , 475 - 500 , 500 - 525 , 525 - 550 , 550 - 575 , 575 - 600 , 600 - 625 , 625 - 650 , 650 - 675 , 675 - 700 , 700 - 725 , 725 - 750 , 750 - 775 , 775 - 800 , 800 - 825 , 825 - 850 , 850 - 875 , 875 - 900 , 900 - 925 , 925 - 950 , 950 - 975 , 975 - 1000 , 1000 - 1025 , 1025 - 1050 , 1050 - 1075 , 1075 - 1100 , 1100 - 1125 , 1125 - 1150 , 1150 - 1175 , 1175 - 1200 , 1200 - 1225 | ||
 | Click To Change The Sort Order: By Market Cap or Company Size Performance: Year-to-date, Week and Day |  |
|
Get the most comprehensive stock market coverage daily at 12Stocks.com ➞ Best Stocks Today ➞ Best Stocks Weekly ➞ Best Stocks Year-to-Date ➞ Best Stocks Trends ➞  Best Stocks Today 12Stocks.com Best Nasdaq Stocks ➞ Best S&P 500 Stocks ➞ Best Tech Stocks ➞ Best Biotech Stocks ➞ |
| Detailed Overview of Financial Stocks |
| Financial Technical Overview, Leaders & Laggards, Top Financial ETF Funds & Detailed Financial Stocks List, Charts, Trends & More |
| Financial Sector: Technical Analysis, Trends & YTD Performance | |
| Financial sector is composed of stocks
from banks, brokers, insurance, REITs
and services subsectors. Financial sector, as represented by XLF, an exchange-traded fund [ETF] that holds basket of Financial stocks (e.g, Bank of America, Goldman Sachs) is up by 13.01% and is currently outperforming the overall market by 2.44% year-to-date. Below is a quick view of Technical charts and trends: |
|
 XLF Weekly Chart |
|
| Long Term Trend: Very Good | |
| Medium Term Trend: Very Good | |
 XLF Daily Chart |
|
| Short Term Trend: Very Good | |
| Overall Trend Score: 95 | |
| YTD Performance: 13.01% | |
| **Trend Scores & Views Are Only For Educational Purposes And Not For Investing | |
| 12Stocks.com: Top Performing Financial Sector Stocks | ||||||||||||||||||||||||||||||||||||||||||||||||
 The top performing Financial sector stocks year to date are
Now, more recently, over last week, the top performing Financial sector stocks on the move are


|
||||||||||||||||||||||||||||||||||||||||||||||||
| 12Stocks.com: Investing in Financial Sector using Exchange Traded Funds | |
|
The following table shows list of key exchange traded funds (ETF) that
help investors track Financial Index. For detailed view, check out our ETF Funds section of our website. Quick View: Move mouse or cursor over ETF symbol (ticker) to view short-term Technical chart and over ETF name to view long term chart. Click on ticker or stock name for detailed view. Click on to add stock symbol to your watchlist and to view watchlist. |
12Stocks.com List of ETFs that track Financial Index
| Ticker | ETF Name | Watchlist | Recent Price | Smart Investing & Trading Score | Change % | Week % | Year-to-date % |
| XLF | Financial | | 42.49 | 95 | 0.73 | 1.58 | 13.01% |
| IAI | Broker-Dealers & Secs | | 119.47 | 100 | 1.08 | 2.59 | 10.08% |
| IYF | Financials | | 96.85 | 95 | 0.43 | 1.73 | 13.39% |
| IYG | Financial Services | | 67.11 | 95 | 0.15 | 1.56 | 12.34% |
| KRE | Regional Banking | | 51.19 | 83 | 0.23 | 1.67 | -2.37% |
| IXG | Global Financials | | 88.72 | 88 | 0.21 | 1.41 | 12.91% |
| VFH | Financials | | 103.00 | 95 | 0.18 | 1.45 | 11.64% |
| KBE | Bank | | 47.93 | 83 | 0.44 | 1.25 | 4.15% |
| FAS | Financial Bull 3X | | 112.32 | 95 | 1.81 | 4.06 | 35.9% |
| FAZ | Financial Bear 3X | | 9.75 | 10 | -1.71 | -3.75 | -28.68% |
| UYG | Financials | | 68.54 | 100 | 1.23 | 2.77 | 24.17% |
| IAT | Regional Banks | | 43.42 | 76 | -0.26 | 1.02 | 3.78% |
| KIE | Insurance | | 51.83 | 100 | 0.88 | 1.09 | 14.62% |
| PSCF | SmallCap Financials | | 49.03 | 95 | 0.28 | 1.44 | -0.31% |
| EUFN | Europe Financials | | 24.13 | 95 | 0.67 | 2.51 | 15.12% |
| PGF | Financial Preferred | | 14.81 | 52 | -0.10 | 0.68 | 1.58% |
| 12Stocks.com: Charts, Trends, Fundamental Data and Performances of Financial Stocks | |
|
We now take in-depth look at all Financial stocks including charts, multi-period performances and overall trends (as measured by Smart Investing & Trading Score). One can sort Financial stocks (click link to choose) by Daily, Weekly and by Year-to-Date performances. Also, one can sort by size of the company or by market capitalization. |
| Select Your Default Chart Type: | |||||
| |||||
| Click on stock symbol or name for detailed view. Click on to add stock symbol to your watchlist and to view watchlist. Quick View: Move mouse or cursor over "Daily" to quickly view daily Technical stock chart and over "Weekly" to view weekly Technical stock chart. | |||||

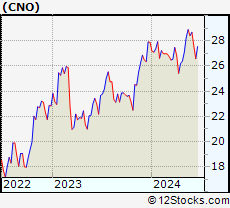 | CNO CNO Financial Group, Inc. |
| Sector: Financials | |
| SubSector: Accident & Health Insurance | |
| MarketCap: 1746.9 Millions | |
| Recent Price: 28.90 Smart Investing & Trading Score: 95 | |
| Day Percent Change: 0.31% Day Change: 0.09 | |
| Week Change: 2.26% Year-to-date Change: 3.6% | |
| CNO Links: Profile News Message Board | |
| Charts:- Daily , Weekly | |
| Add CNO to Watchlist: View: Get Complete CNO Trend Analysis ➞ | |
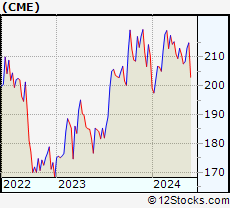 | CME CME Group Inc. |
| Sector: Financials | |
| SubSector: Investment Brokerage - National | |
| MarketCap: 64145 Millions | |
| Recent Price: 213.14 Smart Investing & Trading Score: 64 | |
| Day Percent Change: 0.19% Day Change: 0.41 | |
| Week Change: 2.25% Year-to-date Change: 1.2% | |
| CME Links: Profile News Message Board | |
| Charts:- Daily , Weekly | |
| Add CME to Watchlist: View: Get Complete CME Trend Analysis ➞ | |
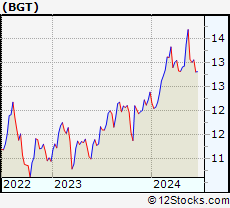 | BGT BlackRock Floating Rate Income Trust |
| Sector: Financials | |
| SubSector: Closed-End Fund - Debt | |
| MarketCap: 192.607 Millions | |
| Recent Price: 13.68 Smart Investing & Trading Score: 88 | |
| Day Percent Change: 1.11% Day Change: 0.15 | |
| Week Change: 2.24% Year-to-date Change: 10.5% | |
| BGT Links: Profile News Message Board | |
| Charts:- Daily , Weekly | |
| Add BGT to Watchlist: View: Get Complete BGT Trend Analysis ➞ | |
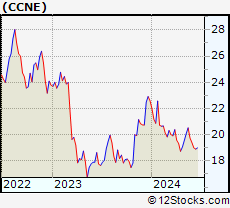 | CCNE CNB Financial Corporation |
| Sector: Financials | |
| SubSector: Regional - Northeast Banks | |
| MarketCap: 286.599 Millions | |
| Recent Price: 20.53 Smart Investing & Trading Score: 95 | |
| Day Percent Change: 0.39% Day Change: 0.08 | |
| Week Change: 2.24% Year-to-date Change: -9.1% | |
| CCNE Links: Profile News Message Board | |
| Charts:- Daily , Weekly | |
| Add CCNE to Watchlist: View: Get Complete CCNE Trend Analysis ➞ | |
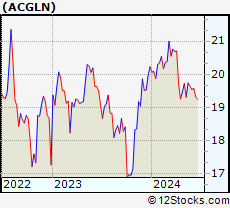 | ACGLN Arch Capital Group Ltd. |
| Sector: Financials | |
| SubSector: Insurance - Diversified | |
| MarketCap: 27880 Millions | |
| Recent Price: 19.74 Smart Investing & Trading Score: 57 | |
| Day Percent Change: 0.56% Day Change: 0.11 | |
| Week Change: 2.23% Year-to-date Change: -2.4% | |
| ACGLN Links: Profile News Message Board | |
| Charts:- Daily , Weekly | |
| Add ACGLN to Watchlist: View: Get Complete ACGLN Trend Analysis ➞ | |
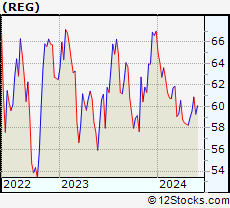 | REG Regency Centers Corporation |
| Sector: Financials | |
| SubSector: REIT - Retail | |
| MarketCap: 6345.84 Millions | |
| Recent Price: 60.89 Smart Investing & Trading Score: 74 | |
| Day Percent Change: 1.28% Day Change: 0.77 | |
| Week Change: 2.22% Year-to-date Change: -9.1% | |
| REG Links: Profile News Message Board | |
| Charts:- Daily , Weekly | |
| Add REG to Watchlist: View: Get Complete REG Trend Analysis ➞ | |
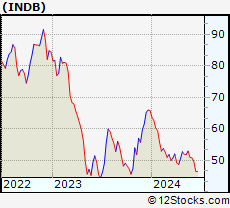 | INDB Independent Bank Corp. |
| Sector: Financials | |
| SubSector: Regional - Northeast Banks | |
| MarketCap: 2347.09 Millions | |
| Recent Price: 52.95 Smart Investing & Trading Score: 85 | |
| Day Percent Change: 0.47% Day Change: 0.25 | |
| Week Change: 2.22% Year-to-date Change: -19.5% | |
| INDB Links: Profile News Message Board | |
| Charts:- Daily , Weekly | |
| Add INDB to Watchlist: View: Get Complete INDB Trend Analysis ➞ | |
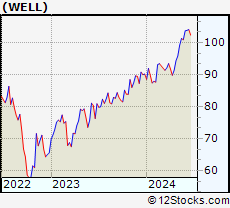 | WELL Welltower Inc. |
| Sector: Financials | |
| SubSector: REIT - Healthcare Facilities | |
| MarketCap: 21398.8 Millions | |
| Recent Price: 101.29 Smart Investing & Trading Score: 90 | |
| Day Percent Change: 0.34% Day Change: 0.34 | |
| Week Change: 2.21% Year-to-date Change: 12.3% | |
| WELL Links: Profile News Message Board | |
| Charts:- Daily , Weekly | |
| Add WELL to Watchlist: View: Get Complete WELL Trend Analysis ➞ | |
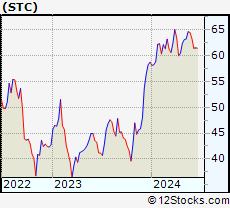 | STC Stewart Information Services Corporation |
| Sector: Financials | |
| SubSector: Property & Casualty Insurance | |
| MarketCap: 629.912 Millions | |
| Recent Price: 64.65 Smart Investing & Trading Score: 95 | |
| Day Percent Change: 0.40% Day Change: 0.26 | |
| Week Change: 2.2% Year-to-date Change: 10.0% | |
| STC Links: Profile News Message Board | |
| Charts:- Daily , Weekly | |
| Add STC to Watchlist: View: Get Complete STC Trend Analysis ➞ | |
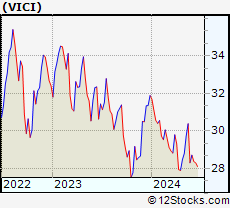 | VICI VICI Properties Inc. |
| Sector: Financials | |
| SubSector: REIT - Diversified | |
| MarketCap: 7327.03 Millions | |
| Recent Price: 30.38 Smart Investing & Trading Score: 88 | |
| Day Percent Change: 0.33% Day Change: 0.10 | |
| Week Change: 2.2% Year-to-date Change: -4.7% | |
| VICI Links: Profile News Message Board | |
| Charts:- Daily , Weekly | |
| Add VICI to Watchlist: View: Get Complete VICI Trend Analysis ➞ | |
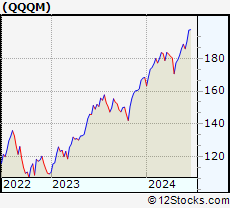 | QQQM Invesco NASDAQ 100 ETF |
| Sector: Financials | |
| SubSector: Exchange Traded Fund | |
| MarketCap: 60157 Millions | |
| Recent Price: 185.91 Smart Investing & Trading Score: 78 | |
| Day Percent Change: -0.05% Day Change: -0.09 | |
| Week Change: 2.2% Year-to-date Change: 10.4% | |
| QQQM Links: Profile News Message Board | |
| Charts:- Daily , Weekly | |
| Add QQQM to Watchlist: View: Get Complete QQQM Trend Analysis ➞ | |
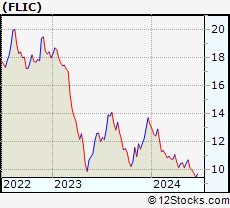 | FLIC The First of Long Island Corporation |
| Sector: Financials | |
| SubSector: Regional - Northeast Banks | |
| MarketCap: 352.899 Millions | |
| Recent Price: 10.71 Smart Investing & Trading Score: 74 | |
| Day Percent Change: 0.75% Day Change: 0.08 | |
| Week Change: 2.19% Year-to-date Change: -19.1% | |
| FLIC Links: Profile News Message Board | |
| Charts:- Daily , Weekly | |
| Add FLIC to Watchlist: View: Get Complete FLIC Trend Analysis ➞ | |
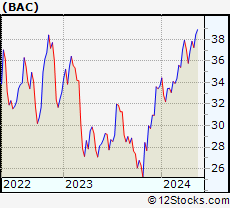 | BAC Bank of America Corporation |
| Sector: Financials | |
| SubSector: Money Center Banks | |
| MarketCap: 189690 Millions | |
| Recent Price: 39.29 Smart Investing & Trading Score: 100 | |
| Day Percent Change: 0.18% Day Change: 0.07 | |
| Week Change: 2.18% Year-to-date Change: 16.7% | |
| BAC Links: Profile News Message Board | |
| Charts:- Daily , Weekly | |
| Add BAC to Watchlist: View: Get Complete BAC Trend Analysis ➞ | |
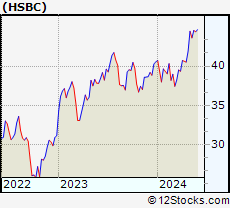 | HSBC HSBC Holdings plc |
| Sector: Financials | |
| SubSector: Foreign Money Center Banks | |
| MarketCap: 127701 Millions | |
| Recent Price: 44.54 Smart Investing & Trading Score: 76 | |
| Day Percent Change: 0.25% Day Change: 0.11 | |
| Week Change: 2.16% Year-to-date Change: 9.9% | |
| HSBC Links: Profile News Message Board | |
| Charts:- Daily , Weekly | |
| Add HSBC to Watchlist: View: Get Complete HSBC Trend Analysis ➞ | |
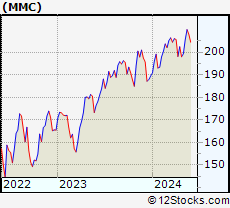 | MMC Marsh & McLennan Companies, Inc. |
| Sector: Financials | |
| SubSector: Insurance Brokers | |
| MarketCap: 42821.8 Millions | |
| Recent Price: 209.97 Smart Investing & Trading Score: 100 | |
| Day Percent Change: 0.40% Day Change: 0.83 | |
| Week Change: 2.15% Year-to-date Change: 10.8% | |
| MMC Links: Profile News Message Board | |
| Charts:- Daily , Weekly | |
| Add MMC to Watchlist: View: Get Complete MMC Trend Analysis ➞ | |
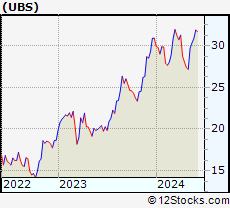 | UBS UBS Group AG |
| Sector: Financials | |
| SubSector: Foreign Money Center Banks | |
| MarketCap: 36840.4 Millions | |
| Recent Price: 30.34 Smart Investing & Trading Score: 73 | |
| Day Percent Change: 1.07% Day Change: 0.32 | |
| Week Change: 2.15% Year-to-date Change: -1.8% | |
| UBS Links: Profile News Message Board | |
| Charts:- Daily , Weekly | |
| Add UBS to Watchlist: View: Get Complete UBS Trend Analysis ➞ | |
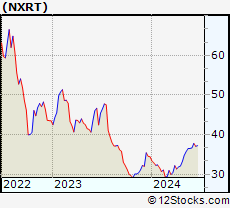 | NXRT NexPoint Residential Trust, Inc. |
| Sector: Financials | |
| SubSector: REIT - Residential | |
| MarketCap: 839.161 Millions | |
| Recent Price: 36.51 Smart Investing & Trading Score: 83 | |
| Day Percent Change: 0.41% Day Change: 0.15 | |
| Week Change: 2.13% Year-to-date Change: 6.0% | |
| NXRT Links: Profile News Message Board | |
| Charts:- Daily , Weekly | |
| Add NXRT to Watchlist: View: Get Complete NXRT Trend Analysis ➞ | |
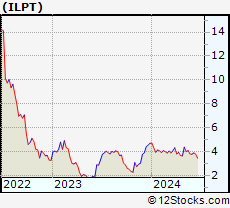 | ILPT Industrial Logistics Properties Trust |
| Sector: Financials | |
| SubSector: REIT - Industrial | |
| MarketCap: 988.549 Millions | |
| Recent Price: 4.08 Smart Investing & Trading Score: 63 | |
| Day Percent Change: -1.81% Day Change: -0.08 | |
| Week Change: 2.13% Year-to-date Change: -13.3% | |
| ILPT Links: Profile News Message Board | |
| Charts:- Daily , Weekly | |
| Add ILPT to Watchlist: View: Get Complete ILPT Trend Analysis ➞ | |
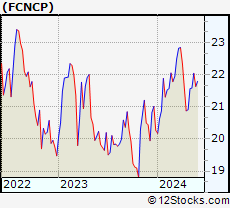 | FCNCP First Citizens BancShares, Inc. |
| Sector: Financials | |
| SubSector: Banks Regional | |
| MarketCap: 60157 Millions | |
| Recent Price: 22.05 Smart Investing & Trading Score: 82 | |
| Day Percent Change: -0.32% Day Change: -0.07 | |
| Week Change: 2.13% Year-to-date Change: 8.8% | |
| FCNCP Links: Profile News Message Board | |
| Charts:- Daily , Weekly | |
| Add FCNCP to Watchlist: View: Get Complete FCNCP Trend Analysis ➞ | |
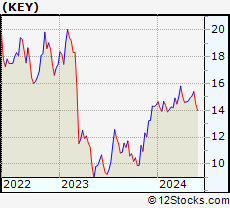 | KEY KeyCorp |
| Sector: Financials | |
| SubSector: Regional - Midwest Banks | |
| MarketCap: 10045 Millions | |
| Recent Price: 15.40 Smart Investing & Trading Score: 95 | |
| Day Percent Change: 0.46% Day Change: 0.07 | |
| Week Change: 2.12% Year-to-date Change: 6.9% | |
| KEY Links: Profile News Message Board | |
| Charts:- Daily , Weekly | |
| Add KEY to Watchlist: View: Get Complete KEY Trend Analysis ➞ | |
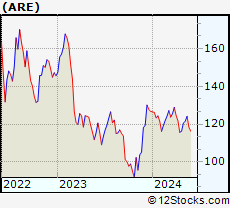 | ARE Alexandria Real Estate Equities, Inc. |
| Sector: Financials | |
| SubSector: REIT - Office | |
| MarketCap: 16793.6 Millions | |
| Recent Price: 124.17 Smart Investing & Trading Score: 63 | |
| Day Percent Change: 0.09% Day Change: 0.11 | |
| Week Change: 2.12% Year-to-date Change: -2.1% | |
| ARE Links: Profile News Message Board | |
| Charts:- Daily , Weekly | |
| Add ARE to Watchlist: View: Get Complete ARE Trend Analysis ➞ | |
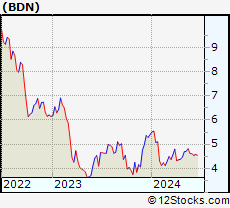 | BDN Brandywine Realty Trust |
| Sector: Financials | |
| SubSector: REIT - Diversified | |
| MarketCap: 1688.13 Millions | |
| Recent Price: 4.81 Smart Investing & Trading Score: 68 | |
| Day Percent Change: -1.64% Day Change: -0.08 | |
| Week Change: 2.12% Year-to-date Change: -10.9% | |
| BDN Links: Profile News Message Board | |
| Charts:- Daily , Weekly | |
| Add BDN to Watchlist: View: Get Complete BDN Trend Analysis ➞ | |
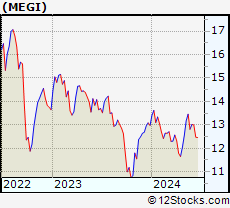 | MEGI MainStay CBRE Global Infrastructure Megatrends Fund |
| Sector: Financials | |
| SubSector: Closed-End Fund - Equity | |
| MarketCap: 713 Millions | |
| Recent Price: 13.46 Smart Investing & Trading Score: 83 | |
| Day Percent Change: 0.22% Day Change: 0.03 | |
| Week Change: 2.12% Year-to-date Change: 3.7% | |
| MEGI Links: Profile News Message Board | |
| Charts:- Daily , Weekly | |
| Add MEGI to Watchlist: View: Get Complete MEGI Trend Analysis ➞ | |
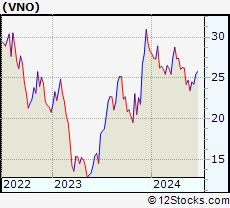 | VNO Vornado Realty Trust |
| Sector: Financials | |
| SubSector: REIT - Diversified | |
| MarketCap: 6300.63 Millions | |
| Recent Price: 24.73 Smart Investing & Trading Score: 10 | |
| Day Percent Change: -0.28% Day Change: -0.07 | |
| Week Change: 2.11% Year-to-date Change: -12.5% | |
| VNO Links: Profile News Message Board | |
| Charts:- Daily , Weekly | |
| Add VNO to Watchlist: View: Get Complete VNO Trend Analysis ➞ | |
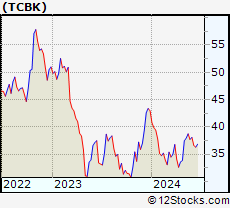 | TCBK TriCo Bancshares |
| Sector: Financials | |
| SubSector: Regional - Pacific Banks | |
| MarketCap: 875.129 Millions | |
| Recent Price: 38.74 Smart Investing & Trading Score: 90 | |
| Day Percent Change: 0.75% Day Change: 0.29 | |
| Week Change: 2.11% Year-to-date Change: -9.8% | |
| TCBK Links: Profile News Message Board | |
| Charts:- Daily , Weekly | |
| Add TCBK to Watchlist: View: Get Complete TCBK Trend Analysis ➞ | |
| For tabular summary view of above stock list: Summary View ➞ 0 - 25 , 25 - 50 , 50 - 75 , 75 - 100 , 100 - 125 , 125 - 150 , 150 - 175 , 175 - 200 , 200 - 225 , 225 - 250 , 250 - 275 , 275 - 300 , 300 - 325 , 325 - 350 , 350 - 375 , 375 - 400 , 400 - 425 , 425 - 450 , 450 - 475 , 475 - 500 , 500 - 525 , 525 - 550 , 550 - 575 , 575 - 600 , 600 - 625 , 625 - 650 , 650 - 675 , 675 - 700 , 700 - 725 , 725 - 750 , 750 - 775 , 775 - 800 , 800 - 825 , 825 - 850 , 850 - 875 , 875 - 900 , 900 - 925 , 925 - 950 , 950 - 975 , 975 - 1000 , 1000 - 1025 , 1025 - 1050 , 1050 - 1075 , 1075 - 1100 , 1100 - 1125 , 1125 - 1150 , 1150 - 1175 , 1175 - 1200 , 1200 - 1225 | ||
| Click To Change The Sort Order: By Market Cap or Company Size Performance: Year-to-date, Week and Day | |
| Select Chart Type: | ||
|
Best Stocks Today 12Stocks.com |
© 2024 12Stocks.com Terms & Conditions Privacy Contact Us
All Information Provided Only For Education And Not To Be Used For Investing or Trading. See Terms & Conditions


One More Thing ... Get Best Stocks Delivered Daily!
Never Ever Miss A Move With Our Top Ten Stocks Lists
Find Best Stocks In Any Market - Bull or Bear Market
Take A Peek At Our Top Ten Stocks Lists: Daily, Weekly, Year-to-Date & Top Trends
Find Best Stocks In Any Market - Bull or Bear Market
Take A Peek At Our Top Ten Stocks Lists: Daily, Weekly, Year-to-Date & Top Trends
Financial Stocks With Best Up Trends [0-bearish to 100-bullish]: Fangdd Network[100], Xinyuan Real[100], MicroSectors Gold[100], Sprott Physical[100], Citizens & Northern[100], Sumitomo Mitsui[100], First Community[100], Chubb [100], Angel Oak[100], Sprott Physical[100], Iris Energy[100]
Best Financial Stocks Year-to-Date:
Root [526.36%], Fangdd Network[149.63%], Banco Macro[126.41%], Grupo Financiero[112.4%], Banco BBVA[110.66%], SelectQuote [110.22%], Gladstone Capital[106.92%], EverQuote [98.2%], Hippo [92.54%], Grupo Supervielle[86.95%], Vista Oil[60.93%] Best Financial Stocks This Week:
Fangdd Network[360.27%], Xinyuan Real[53.28%], Iris Energy[25.68%], Fathom [25.35%], Huize Holding[21.83%], First Foundation[18.98%], Trupanion [17.21%], Bridge [16.67%], MicroSectors Gold[15.19%], KE [13.86%], Douglas Elliman[13.56%] Best Financial Stocks Daily:
Fangdd Network[321.26%], Xinyuan Real[39.49%], MicroSectors Gold[12.02%], Fathom [9.88%], Citizens [8.53%], Hywin [8.28%], Root [6.10%], First Foundation[6.09%], Sprott Physical[6.09%], Freedom Holding[5.02%], NexGen Energy[4.99%]