
 Login Sign Up


| |||||
 |  | ||||

| 12Stocks.com Market Intelligence |
Best Financial Stocks
| In a hurry? Financial Stocks Lists: Performance Trends Table, Stock Charts
Sort Financial stocks: Daily, Weekly, Year-to-Date, Market Cap & Trends. Filter Financial stocks list by size:All Financial Large Mid-Range Small & MicroCap |
| 12Stocks.com Financial Stocks Performances & Trends Daily | |||||||||
|
|  The overall Smart Investing & Trading Score is 95 (0-bearish to 100-bullish) which puts Financial sector in short term bullish trend. The Smart Investing & Trading Score from previous trading session is 100 and a deterioration of trend continues.
| ||||||||
Here are the Smart Investing & Trading Scores of the most requested Financial stocks at 12Stocks.com (click stock name for detailed review):
|


| 12Stocks.com: Investing in Financial sector with Stocks | |
|
The following table helps investors and traders sort through current performance and trends (as measured by Smart Investing & Trading Score) of various
stocks in the Financial sector. Quick View: Move mouse or cursor over stock symbol (ticker) to view short-term Technical chart and over stock name to view long term chart. Click on  to add stock symbol to your watchlist and to add stock symbol to your watchlist and  to view watchlist. Click on any ticker or stock name for detailed market intelligence report for that stock. to view watchlist. Click on any ticker or stock name for detailed market intelligence report for that stock. |
12Stocks.com Performance of Stocks in Financial Sector
| Ticker | Stock Name | Watchlist | Category | Recent Price | Smart Investing & Trading Score | Change % | Weekly Change% |
| MGF | MFS Government |   | Closed-End Fund - Debt | 3.10 | 26 | -0.32% | 0.65% |
| HLNE | Hamilton Lane | | Asset Mgmt | 115.60 | 46 | -1.83% | 0.65% |
| PTY | PIMCO Corporate | | Closed-End Fund - Debt | 14.18 | 38 | 0.21% | 0.64% |
| SBI | Western Asset | | Asset Mgmt | 7.87 | 69 | 0.51% | 0.64% |
| ADC | Agree Realty | | Property Mgmt | 60.53 | 83 | 0.28% | 0.63% |
| EVF | Eaton Vance | | Closed-End Fund - Debt | 6.43 | 73 | 0.16% | 0.63% |
| FMNB | Farmers National | | Regional Banks | 12.79 | 69 | 0.39% | 0.63% |
| GCOR | Goldman Sachs | | Exchange Traded Fund | 40.68 | 58 | -0.31% | 0.63% |
| THW | Tekla World | | Closed-End Fund - Equity | 12.99 | 76 | -0.15% | 0.62% |
| BOH | Bank of Hawaii | | Regional Banks | 59.82 | 52 | 0.50% | 0.61% |
| PX | P10 | | Asset Mgmt | 8.23 | 53 | -0.72% | 0.61% |
| SRCE | 1st Source | | Regional Banks | 52.72 | 90 | 0.08% | 0.61% |
| CMU | MFS High | | Closed-End Fund - Debt | 3.33 | 93 | 0.45% | 0.61% |
| SIXL | 6 Meridian | | Exchange Traded Fund | 35.09 | 83 | -0.34% | 0.61% |
| BBUC | Brookfield Business | | Asset Mgmt | 21.54 | 47 | -0.09% | 0.61% |
| FRT | Federal Realty | | REIT - Retail | 102.33 | 73 | 0.69% | 0.60% |
| NPV | Nuveen Virginia | | Investments | 10.84 | 50 | -0.14% | 0.60% |
| FCBC | First Community | | Regional Banks | 35.80 | 95 | 0.87% | 0.59% |
| KRBN | KraneShares Trust | | Exchange Traded Fund | 33.82 | 88 | -0.41% | 0.59% |
| MBNKP | Medallion Bank | | Banks Regional | 25.15 | 58 | -0.19% | 0.59% |
| FOF | Cohen & Steers Closed-End Opportunity Fund | | Closed-End Fund - Equity | 11.76 | 93 | 0.36% | 0.58% |
| CNNE | Cannae | | Asset Mgmt | 20.71 | 37 | -1.62% | 0.58% |
| RJF | Raymond James | | Brokerage | 126.42 | 66 | 0.65% | 0.57% |
| DEI | Douglas Emmett | | REIT - | 14.18 | 68 | -1.53% | 0.57% |
| ASG | Liberty All-Star | | Closed-End Fund - Equity | 5.27 | 42 | -0.75% | 0.57% |
| For chart view version of above stock list: Chart View ➞ 0 - 25 , 25 - 50 , 50 - 75 , 75 - 100 , 100 - 125 , 125 - 150 , 150 - 175 , 175 - 200 , 200 - 225 , 225 - 250 , 250 - 275 , 275 - 300 , 300 - 325 , 325 - 350 , 350 - 375 , 375 - 400 , 400 - 425 , 425 - 450 , 450 - 475 , 475 - 500 , 500 - 525 , 525 - 550 , 550 - 575 , 575 - 600 , 600 - 625 , 625 - 650 , 650 - 675 , 675 - 700 , 700 - 725 , 725 - 750 , 750 - 775 , 775 - 800 , 800 - 825 , 825 - 850 , 850 - 875 , 875 - 900 , 900 - 925 , 925 - 950 , 950 - 975 , 975 - 1000 , 1000 - 1025 , 1025 - 1050 , 1050 - 1075 , 1075 - 1100 , 1100 - 1125 , 1125 - 1150 , 1150 - 1175 , 1175 - 1200 , 1200 - 1225 | ||
 | Click To Change The Sort Order: By Market Cap or Company Size Performance: Year-to-date, Week and Day |  |
|
Get the most comprehensive stock market coverage daily at 12Stocks.com ➞ Best Stocks Today ➞ Best Stocks Weekly ➞ Best Stocks Year-to-Date ➞ Best Stocks Trends ➞  Best Stocks Today 12Stocks.com Best Nasdaq Stocks ➞ Best S&P 500 Stocks ➞ Best Tech Stocks ➞ Best Biotech Stocks ➞ |
| Detailed Overview of Financial Stocks |
| Financial Technical Overview, Leaders & Laggards, Top Financial ETF Funds & Detailed Financial Stocks List, Charts, Trends & More |
| Financial Sector: Technical Analysis, Trends & YTD Performance | |
| Financial sector is composed of stocks
from banks, brokers, insurance, REITs
and services subsectors. Financial sector, as represented by XLF, an exchange-traded fund [ETF] that holds basket of Financial stocks (e.g, Bank of America, Goldman Sachs) is up by 13.01% and is currently outperforming the overall market by 2.44% year-to-date. Below is a quick view of Technical charts and trends: |
|
 XLF Weekly Chart |
|
| Long Term Trend: Very Good | |
| Medium Term Trend: Very Good | |
 XLF Daily Chart |
|
| Short Term Trend: Very Good | |
| Overall Trend Score: 95 | |
| YTD Performance: 13.01% | |
| **Trend Scores & Views Are Only For Educational Purposes And Not For Investing | |
| 12Stocks.com: Top Performing Financial Sector Stocks | ||||||||||||||||||||||||||||||||||||||||||||||||
 The top performing Financial sector stocks year to date are
Now, more recently, over last week, the top performing Financial sector stocks on the move are


|
||||||||||||||||||||||||||||||||||||||||||||||||
| 12Stocks.com: Investing in Financial Sector using Exchange Traded Funds | |
|
The following table shows list of key exchange traded funds (ETF) that
help investors track Financial Index. For detailed view, check out our ETF Funds section of our website. Quick View: Move mouse or cursor over ETF symbol (ticker) to view short-term Technical chart and over ETF name to view long term chart. Click on ticker or stock name for detailed view. Click on to add stock symbol to your watchlist and to view watchlist. |
12Stocks.com List of ETFs that track Financial Index
| Ticker | ETF Name | Watchlist | Recent Price | Smart Investing & Trading Score | Change % | Week % | Year-to-date % |
| XLF | Financial | | 42.49 | 95 | 0.73 | 1.58 | 13.01% |
| IAI | Broker-Dealers & Secs | | 119.47 | 100 | 1.08 | 2.59 | 10.08% |
| IYF | Financials | | 96.85 | 95 | 0.43 | 1.73 | 13.39% |
| IYG | Financial Services | | 67.11 | 95 | 0.15 | 1.56 | 12.34% |
| KRE | Regional Banking | | 51.19 | 83 | 0.23 | 1.67 | -2.37% |
| IXG | Global Financials | | 88.72 | 88 | 0.21 | 1.41 | 12.91% |
| VFH | Financials | | 103.00 | 95 | 0.18 | 1.45 | 11.64% |
| KBE | Bank | | 47.93 | 83 | 0.44 | 1.25 | 4.15% |
| FAS | Financial Bull 3X | | 112.32 | 95 | 1.81 | 4.06 | 35.9% |
| FAZ | Financial Bear 3X | | 9.75 | 10 | -1.71 | -3.75 | -28.68% |
| UYG | Financials | | 68.54 | 100 | 1.23 | 2.77 | 24.17% |
| IAT | Regional Banks | | 43.42 | 76 | -0.26 | 1.02 | 3.78% |
| KIE | Insurance | | 51.83 | 100 | 0.88 | 1.09 | 14.62% |
| PSCF | SmallCap Financials | | 49.03 | 95 | 0.28 | 1.44 | -0.31% |
| EUFN | Europe Financials | | 24.13 | 95 | 0.67 | 2.51 | 15.12% |
| PGF | Financial Preferred | | 14.81 | 52 | -0.10 | 0.68 | 1.58% |
| 12Stocks.com: Charts, Trends, Fundamental Data and Performances of Financial Stocks | |
|
We now take in-depth look at all Financial stocks including charts, multi-period performances and overall trends (as measured by Smart Investing & Trading Score). One can sort Financial stocks (click link to choose) by Daily, Weekly and by Year-to-Date performances. Also, one can sort by size of the company or by market capitalization. |
| Select Your Default Chart Type: | |||||
| |||||
| Click on stock symbol or name for detailed view. Click on to add stock symbol to your watchlist and to view watchlist. Quick View: Move mouse or cursor over "Daily" to quickly view daily Technical stock chart and over "Weekly" to view weekly Technical stock chart. | |||||

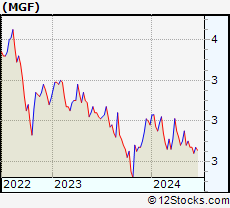 | MGF MFS Government Markets Income Trust |
| Sector: Financials | |
| SubSector: Closed-End Fund - Debt | |
| MarketCap: 141.807 Millions | |
| Recent Price: 3.10 Smart Investing & Trading Score: 26 | |
| Day Percent Change: -0.32% Day Change: -0.01 | |
| Week Change: 0.65% Year-to-date Change: -2.5% | |
| MGF Links: Profile News Message Board | |
| Charts:- Daily , Weekly | |
| Add MGF to Watchlist: View: Get Complete MGF Trend Analysis ➞ | |
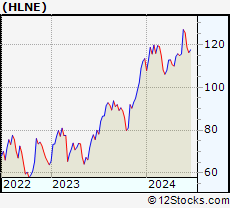 | HLNE Hamilton Lane Incorporated |
| Sector: Financials | |
| SubSector: Asset Management | |
| MarketCap: 2484.13 Millions | |
| Recent Price: 115.60 Smart Investing & Trading Score: 46 | |
| Day Percent Change: -1.83% Day Change: -2.15 | |
| Week Change: 0.65% Year-to-date Change: 1.9% | |
| HLNE Links: Profile News Message Board | |
| Charts:- Daily , Weekly | |
| Add HLNE to Watchlist: View: Get Complete HLNE Trend Analysis ➞ | |
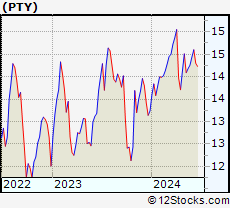 | PTY PIMCO Corporate & Income Opportunity Fund |
| Sector: Financials | |
| SubSector: Closed-End Fund - Debt | |
| MarketCap: 1085.87 Millions | |
| Recent Price: 14.18 Smart Investing & Trading Score: 38 | |
| Day Percent Change: 0.21% Day Change: 0.03 | |
| Week Change: 0.64% Year-to-date Change: 7.1% | |
| PTY Links: Profile News Message Board | |
| Charts:- Daily , Weekly | |
| Add PTY to Watchlist: View: Get Complete PTY Trend Analysis ➞ | |
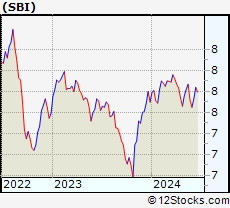 | SBI Western Asset Intermediate Muni Fund Inc. |
| Sector: Financials | |
| SubSector: Asset Management | |
| MarketCap: 109.803 Millions | |
| Recent Price: 7.87 Smart Investing & Trading Score: 69 | |
| Day Percent Change: 0.51% Day Change: 0.04 | |
| Week Change: 0.64% Year-to-date Change: 2.2% | |
| SBI Links: Profile News Message Board | |
| Charts:- Daily , Weekly | |
| Add SBI to Watchlist: View: Get Complete SBI Trend Analysis ➞ | |
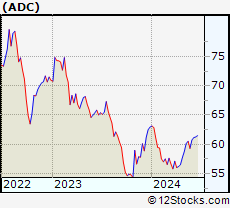 | ADC Agree Realty Corporation |
| Sector: Financials | |
| SubSector: Property Management | |
| MarketCap: 2573.82 Millions | |
| Recent Price: 60.53 Smart Investing & Trading Score: 83 | |
| Day Percent Change: 0.28% Day Change: 0.17 | |
| Week Change: 0.63% Year-to-date Change: -3.8% | |
| ADC Links: Profile News Message Board | |
| Charts:- Daily , Weekly | |
| Add ADC to Watchlist: View: Get Complete ADC Trend Analysis ➞ | |
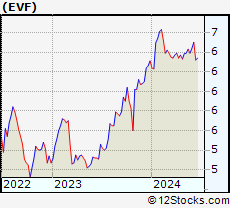 | EVF Eaton Vance Senior Income Trust |
| Sector: Financials | |
| SubSector: Closed-End Fund - Debt | |
| MarketCap: 153.707 Millions | |
| Recent Price: 6.43 Smart Investing & Trading Score: 73 | |
| Day Percent Change: 0.16% Day Change: 0.01 | |
| Week Change: 0.63% Year-to-date Change: 1.9% | |
| EVF Links: Profile News Message Board | |
| Charts:- Daily , Weekly | |
| Add EVF to Watchlist: View: Get Complete EVF Trend Analysis ➞ | |
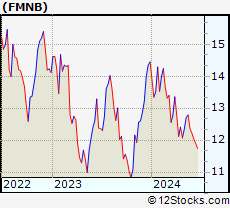 | FMNB Farmers National Banc Corp. |
| Sector: Financials | |
| SubSector: Regional - Midwest Banks | |
| MarketCap: 366.57 Millions | |
| Recent Price: 12.79 Smart Investing & Trading Score: 69 | |
| Day Percent Change: 0.39% Day Change: 0.05 | |
| Week Change: 0.63% Year-to-date Change: -11.5% | |
| FMNB Links: Profile News Message Board | |
| Charts:- Daily , Weekly | |
| Add FMNB to Watchlist: View: Get Complete FMNB Trend Analysis ➞ | |
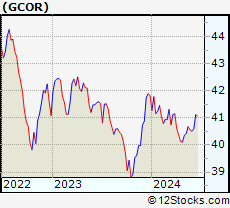 | GCOR Goldman Sachs Access U.S. Aggregate Bond ETF |
| Sector: Financials | |
| SubSector: Exchange Traded Fund | |
| MarketCap: 60157 Millions | |
| Recent Price: 40.68 Smart Investing & Trading Score: 58 | |
| Day Percent Change: -0.31% Day Change: -0.12 | |
| Week Change: 0.63% Year-to-date Change: -2.8% | |
| GCOR Links: Profile News Message Board | |
| Charts:- Daily , Weekly | |
| Add GCOR to Watchlist: View: Get Complete GCOR Trend Analysis ➞ | |
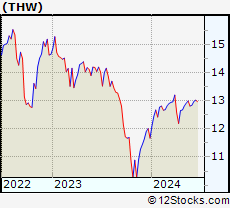 | THW Tekla World Healthcare Fund |
| Sector: Financials | |
| SubSector: Closed-End Fund - Equity | |
| MarketCap: 288.247 Millions | |
| Recent Price: 12.99 Smart Investing & Trading Score: 76 | |
| Day Percent Change: -0.15% Day Change: -0.02 | |
| Week Change: 0.62% Year-to-date Change: 11.3% | |
| THW Links: Profile News Message Board | |
| Charts:- Daily , Weekly | |
| Add THW to Watchlist: View: Get Complete THW Trend Analysis ➞ | |
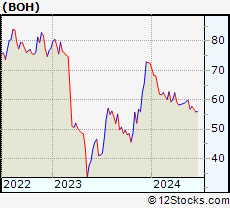 | BOH Bank of Hawaii Corporation |
| Sector: Financials | |
| SubSector: Regional - Pacific Banks | |
| MarketCap: 2305.19 Millions | |
| Recent Price: 59.82 Smart Investing & Trading Score: 52 | |
| Day Percent Change: 0.50% Day Change: 0.30 | |
| Week Change: 0.61% Year-to-date Change: -17.4% | |
| BOH Links: Profile News Message Board | |
| Charts:- Daily , Weekly | |
| Add BOH to Watchlist: View: Get Complete BOH Trend Analysis ➞ | |
 | PX P10, Inc. |
| Sector: Financials | |
| SubSector: Asset Management | |
| MarketCap: 1300 Millions | |
| Recent Price: 8.23 Smart Investing & Trading Score: 53 | |
| Day Percent Change: -0.72% Day Change: -0.06 | |
| Week Change: 0.61% Year-to-date Change: -19.5% | |
| PX Links: Profile News Message Board | |
| Charts:- Daily , Weekly | |
| Add PX to Watchlist: View: Get Complete PX Trend Analysis ➞ | |
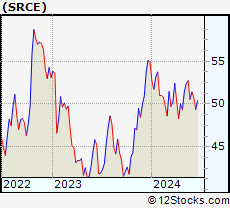 | SRCE 1st Source Corporation |
| Sector: Financials | |
| SubSector: Regional - Midwest Banks | |
| MarketCap: 784.77 Millions | |
| Recent Price: 52.72 Smart Investing & Trading Score: 90 | |
| Day Percent Change: 0.08% Day Change: 0.04 | |
| Week Change: 0.61% Year-to-date Change: -4.1% | |
| SRCE Links: Profile News Message Board | |
| Charts:- Daily , Weekly | |
| Add SRCE to Watchlist: View: Get Complete SRCE Trend Analysis ➞ | |
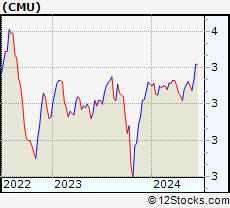 | CMU MFS High Yield Municipal Trust |
| Sector: Financials | |
| SubSector: Closed-End Fund - Debt | |
| MarketCap: 103.307 Millions | |
| Recent Price: 3.33 Smart Investing & Trading Score: 93 | |
| Day Percent Change: 0.45% Day Change: 0.02 | |
| Week Change: 0.61% Year-to-date Change: 0.5% | |
| CMU Links: Profile News Message Board | |
| Charts:- Daily , Weekly | |
| Add CMU to Watchlist: View: Get Complete CMU Trend Analysis ➞ | |
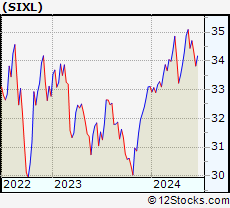 | SIXL 6 Meridian Low Beta Equity Strategy ETF |
| Sector: Financials | |
| SubSector: Exchange Traded Fund | |
| MarketCap: 60157 Millions | |
| Recent Price: 35.09 Smart Investing & Trading Score: 83 | |
| Day Percent Change: -0.34% Day Change: -0.12 | |
| Week Change: 0.61% Year-to-date Change: 6.0% | |
| SIXL Links: Profile News Message Board | |
| Charts:- Daily , Weekly | |
| Add SIXL to Watchlist: View: Get Complete SIXL Trend Analysis ➞ | |
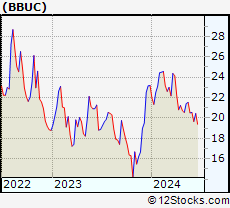 | BBUC Brookfield Business Corporation |
| Sector: Financials | |
| SubSector: Asset Management | |
| MarketCap: 1810 Millions | |
| Recent Price: 21.54 Smart Investing & Trading Score: 47 | |
| Day Percent Change: -0.09% Day Change: -0.02 | |
| Week Change: 0.61% Year-to-date Change: -7.1% | |
| BBUC Links: Profile News Message Board | |
| Charts:- Daily , Weekly | |
| Add BBUC to Watchlist: View: Get Complete BBUC Trend Analysis ➞ | |
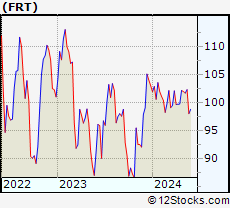 | FRT Federal Realty Investment Trust |
| Sector: Financials | |
| SubSector: REIT - Retail | |
| MarketCap: 5878.64 Millions | |
| Recent Price: 102.33 Smart Investing & Trading Score: 73 | |
| Day Percent Change: 0.69% Day Change: 0.70 | |
| Week Change: 0.6% Year-to-date Change: -0.7% | |
| FRT Links: Profile News Message Board | |
| Charts:- Daily , Weekly | |
| Add FRT to Watchlist: View: Get Complete FRT Trend Analysis ➞ | |
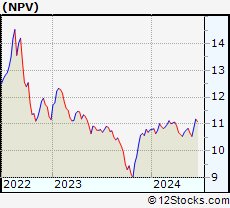 | NPV Nuveen Virginia Quality Municipal Income Fund |
| Sector: Financials | |
| SubSector: Diversified Investments | |
| MarketCap: 215.97 Millions | |
| Recent Price: 10.84 Smart Investing & Trading Score: 50 | |
| Day Percent Change: -0.14% Day Change: -0.01 | |
| Week Change: 0.6% Year-to-date Change: 0.5% | |
| NPV Links: Profile News Message Board | |
| Charts:- Daily , Weekly | |
| Add NPV to Watchlist: View: Get Complete NPV Trend Analysis ➞ | |
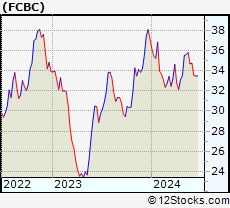 | FCBC First Community Bankshares, Inc. |
| Sector: Financials | |
| SubSector: Regional - Mid-Atlantic Banks | |
| MarketCap: 393.459 Millions | |
| Recent Price: 35.80 Smart Investing & Trading Score: 95 | |
| Day Percent Change: 0.87% Day Change: 0.31 | |
| Week Change: 0.59% Year-to-date Change: -3.5% | |
| FCBC Links: Profile News Message Board | |
| Charts:- Daily , Weekly | |
| Add FCBC to Watchlist: View: Get Complete FCBC Trend Analysis ➞ | |
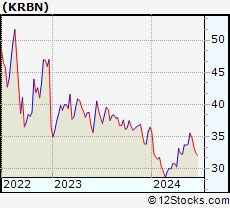 | KRBN KraneShares Trust KFA Global Carbon ETF |
| Sector: Financials | |
| SubSector: Exchange Traded Fund | |
| MarketCap: 60157 Millions | |
| Recent Price: 33.82 Smart Investing & Trading Score: 88 | |
| Day Percent Change: -0.41% Day Change: -0.14 | |
| Week Change: 0.59% Year-to-date Change: -7.2% | |
| KRBN Links: Profile News Message Board | |
| Charts:- Daily , Weekly | |
| Add KRBN to Watchlist: View: Get Complete KRBN Trend Analysis ➞ | |
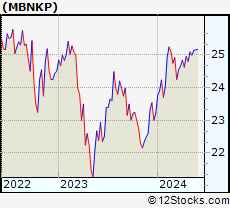 | MBNKP Medallion Bank |
| Sector: Financials | |
| SubSector: Banks Regional | |
| MarketCap: 60157 Millions | |
| Recent Price: 25.15 Smart Investing & Trading Score: 58 | |
| Day Percent Change: -0.19% Day Change: -0.05 | |
| Week Change: 0.59% Year-to-date Change: 8.3% | |
| MBNKP Links: Profile News Message Board | |
| Charts:- Daily , Weekly | |
| Add MBNKP to Watchlist: View: Get Complete MBNKP Trend Analysis ➞ | |
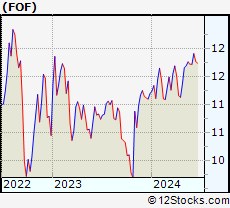 | FOF Cohen & Steers Closed-End Opportunity Fund, Inc. |
| Sector: Financials | |
| SubSector: Closed-End Fund - Equity | |
| MarketCap: 199.747 Millions | |
| Recent Price: 11.76 Smart Investing & Trading Score: 93 | |
| Day Percent Change: 0.36% Day Change: 0.04 | |
| Week Change: 0.58% Year-to-date Change: 5.0% | |
| FOF Links: Profile News Message Board | |
| Charts:- Daily , Weekly | |
| Add FOF to Watchlist: View: Get Complete FOF Trend Analysis ➞ | |
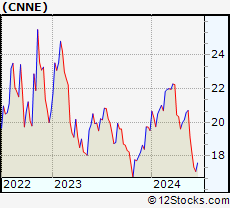 | CNNE Cannae Holdings, Inc. |
| Sector: Financials | |
| SubSector: Asset Management | |
| MarketCap: 2625.53 Millions | |
| Recent Price: 20.71 Smart Investing & Trading Score: 37 | |
| Day Percent Change: -1.62% Day Change: -0.34 | |
| Week Change: 0.58% Year-to-date Change: 6.2% | |
| CNNE Links: Profile News Message Board | |
| Charts:- Daily , Weekly | |
| Add CNNE to Watchlist: View: Get Complete CNNE Trend Analysis ➞ | |
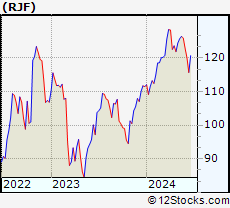 | RJF Raymond James Financial, Inc. |
| Sector: Financials | |
| SubSector: Investment Brokerage - Regional | |
| MarketCap: 9490.65 Millions | |
| Recent Price: 126.42 Smart Investing & Trading Score: 66 | |
| Day Percent Change: 0.65% Day Change: 0.82 | |
| Week Change: 0.57% Year-to-date Change: 13.4% | |
| RJF Links: Profile News Message Board | |
| Charts:- Daily , Weekly | |
| Add RJF to Watchlist: View: Get Complete RJF Trend Analysis ➞ | |
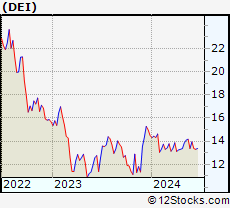 | DEI Douglas Emmett, Inc. |
| Sector: Financials | |
| SubSector: REIT - Diversified | |
| MarketCap: 4917.83 Millions | |
| Recent Price: 14.18 Smart Investing & Trading Score: 68 | |
| Day Percent Change: -1.53% Day Change: -0.22 | |
| Week Change: 0.57% Year-to-date Change: -2.2% | |
| DEI Links: Profile News Message Board | |
| Charts:- Daily , Weekly | |
| Add DEI to Watchlist: View: Get Complete DEI Trend Analysis ➞ | |
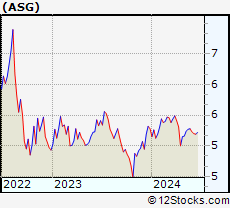 | ASG Liberty All-Star Growth Fund, Inc. |
| Sector: Financials | |
| SubSector: Closed-End Fund - Equity | |
| MarketCap: 167.747 Millions | |
| Recent Price: 5.27 Smart Investing & Trading Score: 42 | |
| Day Percent Change: -0.75% Day Change: -0.04 | |
| Week Change: 0.57% Year-to-date Change: -0.2% | |
| ASG Links: Profile News Message Board | |
| Charts:- Daily , Weekly | |
| Add ASG to Watchlist: View: Get Complete ASG Trend Analysis ➞ | |
| For tabular summary view of above stock list: Summary View ➞ 0 - 25 , 25 - 50 , 50 - 75 , 75 - 100 , 100 - 125 , 125 - 150 , 150 - 175 , 175 - 200 , 200 - 225 , 225 - 250 , 250 - 275 , 275 - 300 , 300 - 325 , 325 - 350 , 350 - 375 , 375 - 400 , 400 - 425 , 425 - 450 , 450 - 475 , 475 - 500 , 500 - 525 , 525 - 550 , 550 - 575 , 575 - 600 , 600 - 625 , 625 - 650 , 650 - 675 , 675 - 700 , 700 - 725 , 725 - 750 , 750 - 775 , 775 - 800 , 800 - 825 , 825 - 850 , 850 - 875 , 875 - 900 , 900 - 925 , 925 - 950 , 950 - 975 , 975 - 1000 , 1000 - 1025 , 1025 - 1050 , 1050 - 1075 , 1075 - 1100 , 1100 - 1125 , 1125 - 1150 , 1150 - 1175 , 1175 - 1200 , 1200 - 1225 | ||
| Click To Change The Sort Order: By Market Cap or Company Size Performance: Year-to-date, Week and Day | |
| Select Chart Type: | ||
|
Best Stocks Today 12Stocks.com |
© 2024 12Stocks.com Terms & Conditions Privacy Contact Us
All Information Provided Only For Education And Not To Be Used For Investing or Trading. See Terms & Conditions


One More Thing ... Get Best Stocks Delivered Daily!
Never Ever Miss A Move With Our Top Ten Stocks Lists
Find Best Stocks In Any Market - Bull or Bear Market
Take A Peek At Our Top Ten Stocks Lists: Daily, Weekly, Year-to-Date & Top Trends
Find Best Stocks In Any Market - Bull or Bear Market
Take A Peek At Our Top Ten Stocks Lists: Daily, Weekly, Year-to-Date & Top Trends
Financial Stocks With Best Up Trends [0-bearish to 100-bullish]: Fangdd Network[100], Xinyuan Real[100], MicroSectors Gold[100], Sprott Physical[100], Citizens & Northern[100], Sumitomo Mitsui[100], First Community[100], Chubb [100], Angel Oak[100], Sprott Physical[100], Iris Energy[100]
Best Financial Stocks Year-to-Date:
Root [526.36%], Fangdd Network[149.63%], Banco Macro[126.41%], Grupo Financiero[112.4%], Banco BBVA[110.66%], SelectQuote [110.22%], Gladstone Capital[106.92%], EverQuote [98.2%], Hippo [92.54%], Grupo Supervielle[86.95%], Vista Oil[60.93%] Best Financial Stocks This Week:
Fangdd Network[360.27%], Xinyuan Real[53.28%], Iris Energy[25.68%], Fathom [25.35%], Huize Holding[21.83%], First Foundation[18.98%], Trupanion [17.21%], Bridge [16.67%], MicroSectors Gold[15.19%], KE [13.86%], Douglas Elliman[13.56%] Best Financial Stocks Daily:
Fangdd Network[321.26%], Xinyuan Real[39.49%], MicroSectors Gold[12.02%], Fathom [9.88%], Citizens [8.53%], Hywin [8.28%], Root [6.10%], First Foundation[6.09%], Sprott Physical[6.09%], Freedom Holding[5.02%], NexGen Energy[4.99%]