
 Login Sign Up


| |||||
 |  | ||||

| 12Stocks.com Market Intelligence |
Best Financial Stocks
| In a hurry? Financial Stocks Lists: Performance Trends Table, Stock Charts
Sort Financial stocks: Daily, Weekly, Year-to-Date, Market Cap & Trends. Filter Financial stocks list by size:All Financial Large Mid-Range Small & MicroCap |
| 12Stocks.com Financial Stocks Performances & Trends Daily | |||||||||
|
|  The overall Smart Investing & Trading Score is 95 (0-bearish to 100-bullish) which puts Financial sector in short term bullish trend. The Smart Investing & Trading Score from previous trading session is 100 and a deterioration of trend continues.
| ||||||||
Here are the Smart Investing & Trading Scores of the most requested Financial stocks at 12Stocks.com (click stock name for detailed review):
|


| 12Stocks.com: Investing in Financial sector with Stocks | |
|
The following table helps investors and traders sort through current performance and trends (as measured by Smart Investing & Trading Score) of various
stocks in the Financial sector. Quick View: Move mouse or cursor over stock symbol (ticker) to view short-term Technical chart and over stock name to view long term chart. Click on  to add stock symbol to your watchlist and to add stock symbol to your watchlist and  to view watchlist. Click on any ticker or stock name for detailed market intelligence report for that stock. to view watchlist. Click on any ticker or stock name for detailed market intelligence report for that stock. |
12Stocks.com Performance of Stocks in Financial Sector
| Ticker | Stock Name | Watchlist | Category | Recent Price | Smart Investing & Trading Score | Change % | Weekly Change% |
| PNI | PIMCO New |   | Closed-End Fund - Debt | 7.37 | 30 | -0.54% | 0.34% |
| TRIN | Trinity Capital | | Asset Mgmt | 14.93 | 68 | 0.34% | 0.34% |
| ERC | Wells Fargo | | Asset Mgmt | 9.04 | 33 | 0.00% | 0.33% |
| PAI | Western Asset | | Closed-End Fund - Debt | 12.03 | 69 | -0.25% | 0.33% |
| GOODO | Gladstone Commercial | | REIT - | 20.02 | 76 | -0.07% | 0.33% |
| BCX | Blackrock Resources | | Closed-End Fund - Equity | 9.45 | 88 | 0.64% | 0.32% |
| ISD | PGIM High | | Closed-End Fund - Debt | 12.66 | 38 | -0.08% | 0.32% |
| AIRC | Apartment ome | | REIT | 38.72 | 83 | 0.16% | 0.31% |
| EOT | Eaton Vance | | Closed-End Fund - Debt | 16.58 | 43 | 0.06% | 0.30% |
| NYMTL | New York | | REIT - Mortgage | 19.94 | 56 | -0.25% | 0.30% |
| TRMK | Trustmark | | Regional Banks | 30.77 | 83 | 0.07% | 0.29% |
| BTZ | BlackRock Credit | | Closed-End Fund - Debt | 10.43 | 33 | -0.48% | 0.29% |
| MVT | BlackRock MuniVest | | Closed-End Fund - Debt | 10.78 | 65 | 0.00% | 0.28% |
| AFB | AllianceBernstein National | | Closed-End Fund - Debt | 10.88 | 50 | -0.37% | 0.28% |
| EVG | Eaton Vance | | Closed-End Fund - Debt | 10.82 | 69 | -0.18% | 0.28% |
| NMT | Nuveen Massachusetts | | Closed-End Fund - Debt | 10.72 | 83 | -0.14% | 0.28% |
| NRK | Nuveen New | | Investments | 10.90 | 63 | 0.28% | 0.28% |
| CDAQ | Compass Digital | | SPAC | 10.82 | 75 | 0.00% | 0.28% |
| EWBC | East West | | Foreign Banks | 77.41 | 71 | 0.08% | 0.27% |
| MIY | BlackRock MuniYield | | Closed-End Fund - Debt | 11.33 | 56 | 0.00% | 0.27% |
| FIHL | Fidelis Insurance | | Insurance - | 18.53 | 68 | 0.43% | 0.27% |
| HPS | John Hancock | | Closed-End Fund - Debt | 15.40 | 59 | -0.45% | 0.26% |
| OCSL | Oaktree Specialty | | Credit Services | 19.37 | 42 | -0.05% | 0.26% |
| VMCA | Valuence Merger | | SPAC | 11.47 | 48 | 0.17% | 0.26% |
| PLAO | Patria Latin | | SPAC | 11.39 | 65 | 0.09% | 0.26% |
| For chart view version of above stock list: Chart View ➞ 0 - 25 , 25 - 50 , 50 - 75 , 75 - 100 , 100 - 125 , 125 - 150 , 150 - 175 , 175 - 200 , 200 - 225 , 225 - 250 , 250 - 275 , 275 - 300 , 300 - 325 , 325 - 350 , 350 - 375 , 375 - 400 , 400 - 425 , 425 - 450 , 450 - 475 , 475 - 500 , 500 - 525 , 525 - 550 , 550 - 575 , 575 - 600 , 600 - 625 , 625 - 650 , 650 - 675 , 675 - 700 , 700 - 725 , 725 - 750 , 750 - 775 , 775 - 800 , 800 - 825 , 825 - 850 , 850 - 875 , 875 - 900 , 900 - 925 , 925 - 950 , 950 - 975 , 975 - 1000 , 1000 - 1025 , 1025 - 1050 , 1050 - 1075 , 1075 - 1100 , 1100 - 1125 , 1125 - 1150 , 1150 - 1175 , 1175 - 1200 , 1200 - 1225 | ||
 | Click To Change The Sort Order: By Market Cap or Company Size Performance: Year-to-date, Week and Day |  |
|
Get the most comprehensive stock market coverage daily at 12Stocks.com ➞ Best Stocks Today ➞ Best Stocks Weekly ➞ Best Stocks Year-to-Date ➞ Best Stocks Trends ➞  Best Stocks Today 12Stocks.com Best Nasdaq Stocks ➞ Best S&P 500 Stocks ➞ Best Tech Stocks ➞ Best Biotech Stocks ➞ |
| Detailed Overview of Financial Stocks |
| Financial Technical Overview, Leaders & Laggards, Top Financial ETF Funds & Detailed Financial Stocks List, Charts, Trends & More |
| Financial Sector: Technical Analysis, Trends & YTD Performance | |
| Financial sector is composed of stocks
from banks, brokers, insurance, REITs
and services subsectors. Financial sector, as represented by XLF, an exchange-traded fund [ETF] that holds basket of Financial stocks (e.g, Bank of America, Goldman Sachs) is up by 13.01% and is currently outperforming the overall market by 2.44% year-to-date. Below is a quick view of Technical charts and trends: |
|
 XLF Weekly Chart |
|
| Long Term Trend: Very Good | |
| Medium Term Trend: Very Good | |
 XLF Daily Chart |
|
| Short Term Trend: Very Good | |
| Overall Trend Score: 95 | |
| YTD Performance: 13.01% | |
| **Trend Scores & Views Are Only For Educational Purposes And Not For Investing | |
| 12Stocks.com: Top Performing Financial Sector Stocks | ||||||||||||||||||||||||||||||||||||||||||||||||
 The top performing Financial sector stocks year to date are
Now, more recently, over last week, the top performing Financial sector stocks on the move are


|
||||||||||||||||||||||||||||||||||||||||||||||||
| 12Stocks.com: Investing in Financial Sector using Exchange Traded Funds | |
|
The following table shows list of key exchange traded funds (ETF) that
help investors track Financial Index. For detailed view, check out our ETF Funds section of our website. Quick View: Move mouse or cursor over ETF symbol (ticker) to view short-term Technical chart and over ETF name to view long term chart. Click on ticker or stock name for detailed view. Click on to add stock symbol to your watchlist and to view watchlist. |
12Stocks.com List of ETFs that track Financial Index
| Ticker | ETF Name | Watchlist | Recent Price | Smart Investing & Trading Score | Change % | Week % | Year-to-date % |
| XLF | Financial | | 42.49 | 95 | 0.73 | 1.58 | 13.01% |
| IAI | Broker-Dealers & Secs | | 119.47 | 100 | 1.08 | 2.59 | 10.08% |
| IYF | Financials | | 96.85 | 95 | 0.43 | 1.73 | 13.39% |
| IYG | Financial Services | | 67.11 | 95 | 0.15 | 1.56 | 12.34% |
| KRE | Regional Banking | | 51.19 | 83 | 0.23 | 1.67 | -2.37% |
| IXG | Global Financials | | 88.72 | 88 | 0.21 | 1.41 | 12.91% |
| VFH | Financials | | 103.00 | 95 | 0.18 | 1.45 | 11.64% |
| KBE | Bank | | 47.93 | 83 | 0.44 | 1.25 | 4.15% |
| FAS | Financial Bull 3X | | 112.32 | 95 | 1.81 | 4.06 | 35.9% |
| FAZ | Financial Bear 3X | | 9.75 | 10 | -1.71 | -3.75 | -28.68% |
| UYG | Financials | | 68.54 | 100 | 1.23 | 2.77 | 24.17% |
| IAT | Regional Banks | | 43.42 | 76 | -0.26 | 1.02 | 3.78% |
| KIE | Insurance | | 51.83 | 100 | 0.88 | 1.09 | 14.62% |
| PSCF | SmallCap Financials | | 49.03 | 95 | 0.28 | 1.44 | -0.31% |
| EUFN | Europe Financials | | 24.13 | 95 | 0.67 | 2.51 | 15.12% |
| PGF | Financial Preferred | | 14.81 | 52 | -0.10 | 0.68 | 1.58% |
| 12Stocks.com: Charts, Trends, Fundamental Data and Performances of Financial Stocks | |
|
We now take in-depth look at all Financial stocks including charts, multi-period performances and overall trends (as measured by Smart Investing & Trading Score). One can sort Financial stocks (click link to choose) by Daily, Weekly and by Year-to-Date performances. Also, one can sort by size of the company or by market capitalization. |
| Select Your Default Chart Type: | |||||
| |||||
| Click on stock symbol or name for detailed view. Click on to add stock symbol to your watchlist and to view watchlist. Quick View: Move mouse or cursor over "Daily" to quickly view daily Technical stock chart and over "Weekly" to view weekly Technical stock chart. | |||||

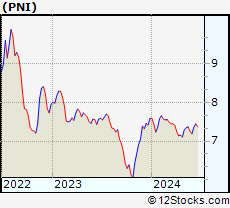 | PNI PIMCO New York Municipal Income Fund II |
| Sector: Financials | |
| SubSector: Closed-End Fund - Debt | |
| MarketCap: 100.707 Millions | |
| Recent Price: 7.37 Smart Investing & Trading Score: 30 | |
| Day Percent Change: -0.54% Day Change: -0.04 | |
| Week Change: 0.34% Year-to-date Change: -2.9% | |
| PNI Links: Profile News Message Board | |
| Charts:- Daily , Weekly | |
| Add PNI to Watchlist: View: Get Complete PNI Trend Analysis ➞ | |
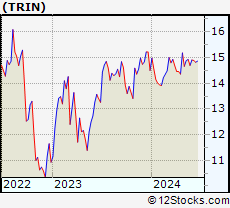 | TRIN Trinity Capital Inc. |
| Sector: Financials | |
| SubSector: Asset Management | |
| MarketCap: 491 Millions | |
| Recent Price: 14.93 Smart Investing & Trading Score: 68 | |
| Day Percent Change: 0.34% Day Change: 0.05 | |
| Week Change: 0.34% Year-to-date Change: 3.0% | |
| TRIN Links: Profile News Message Board | |
| Charts:- Daily , Weekly | |
| Add TRIN to Watchlist: View: Get Complete TRIN Trend Analysis ➞ | |
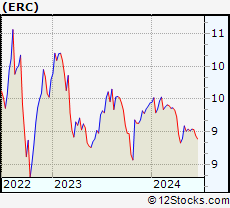 | ERC Wells Fargo Advantage Multi-Sector Income Fund |
| Sector: Financials | |
| SubSector: Asset Management | |
| MarketCap: 266.503 Millions | |
| Recent Price: 9.04 Smart Investing & Trading Score: 33 | |
| Day Percent Change: 0.00% Day Change: 0.00 | |
| Week Change: 0.33% Year-to-date Change: -4.2% | |
| ERC Links: Profile News Message Board | |
| Charts:- Daily , Weekly | |
| Add ERC to Watchlist: View: Get Complete ERC Trend Analysis ➞ | |
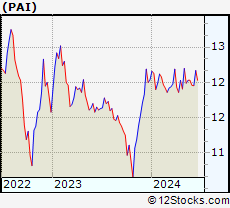 | PAI Western Asset Investment Grade Income Fund Inc. |
| Sector: Financials | |
| SubSector: Closed-End Fund - Debt | |
| MarketCap: 109.607 Millions | |
| Recent Price: 12.03 Smart Investing & Trading Score: 69 | |
| Day Percent Change: -0.25% Day Change: -0.03 | |
| Week Change: 0.33% Year-to-date Change: -0.1% | |
| PAI Links: Profile News Message Board | |
| Charts:- Daily , Weekly | |
| Add PAI to Watchlist: View: Get Complete PAI Trend Analysis ➞ | |
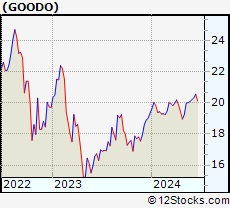 | GOODO Gladstone Commercial Corporation |
| Sector: Financials | |
| SubSector: REIT - Diversified | |
| MarketCap: 538 Millions | |
| Recent Price: 20.02 Smart Investing & Trading Score: 76 | |
| Day Percent Change: -0.07% Day Change: -0.02 | |
| Week Change: 0.33% Year-to-date Change: 3.5% | |
| GOODO Links: Profile News Message Board | |
| Charts:- Daily , Weekly | |
| Add GOODO to Watchlist: View: Get Complete GOODO Trend Analysis ➞ | |
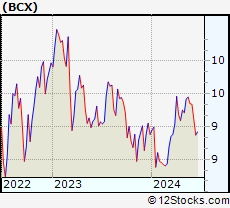 | BCX Blackrock Resources & Commodities Strategy Trust |
| Sector: Financials | |
| SubSector: Closed-End Fund - Equity | |
| MarketCap: 363.747 Millions | |
| Recent Price: 9.45 Smart Investing & Trading Score: 88 | |
| Day Percent Change: 0.64% Day Change: 0.06 | |
| Week Change: 0.32% Year-to-date Change: 6.4% | |
| BCX Links: Profile News Message Board | |
| Charts:- Daily , Weekly | |
| Add BCX to Watchlist: View: Get Complete BCX Trend Analysis ➞ | |
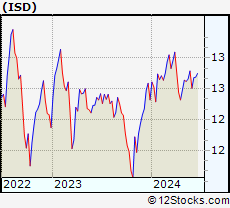 | ISD PGIM High Yield Bond Fund, Inc |
| Sector: Financials | |
| SubSector: Closed-End Fund - Debt | |
| MarketCap: 341.507 Millions | |
| Recent Price: 12.66 Smart Investing & Trading Score: 38 | |
| Day Percent Change: -0.08% Day Change: -0.01 | |
| Week Change: 0.32% Year-to-date Change: 2.8% | |
| ISD Links: Profile News Message Board | |
| Charts:- Daily , Weekly | |
| Add ISD to Watchlist: View: Get Complete ISD Trend Analysis ➞ | |
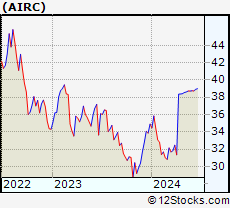 | AIRC Apartment Income REIT Corp. |
| Sector: Financials | |
| SubSector: REIT - Residential | |
| MarketCap: 5280 Millions | |
| Recent Price: 38.72 Smart Investing & Trading Score: 83 | |
| Day Percent Change: 0.16% Day Change: 0.06 | |
| Week Change: 0.31% Year-to-date Change: 10.9% | |
| AIRC Links: Profile News Message Board | |
| Charts:- Daily , Weekly | |
| Add AIRC to Watchlist: View: Get Complete AIRC Trend Analysis ➞ | |
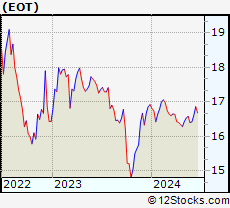 | EOT Eaton Vance National Municipal Opportunities Trust |
| Sector: Financials | |
| SubSector: Closed-End Fund - Debt | |
| MarketCap: 264.607 Millions | |
| Recent Price: 16.58 Smart Investing & Trading Score: 43 | |
| Day Percent Change: 0.06% Day Change: 0.01 | |
| Week Change: 0.3% Year-to-date Change: -2.0% | |
| EOT Links: Profile News Message Board | |
| Charts:- Daily , Weekly | |
| Add EOT to Watchlist: View: Get Complete EOT Trend Analysis ➞ | |
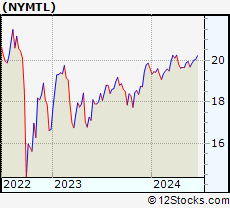 | NYMTL New York Mortgage Trust, Inc. |
| Sector: Financials | |
| SubSector: REIT - Mortgage | |
| MarketCap: 905 Millions | |
| Recent Price: 19.94 Smart Investing & Trading Score: 56 | |
| Day Percent Change: -0.25% Day Change: -0.05 | |
| Week Change: 0.3% Year-to-date Change: 1.7% | |
| NYMTL Links: Profile News Message Board | |
| Charts:- Daily , Weekly | |
| Add NYMTL to Watchlist: View: Get Complete NYMTL Trend Analysis ➞ | |
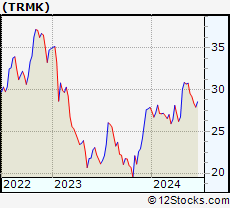 | TRMK Trustmark Corporation |
| Sector: Financials | |
| SubSector: Regional - Southeast Banks | |
| MarketCap: 1630.15 Millions | |
| Recent Price: 30.77 Smart Investing & Trading Score: 83 | |
| Day Percent Change: 0.07% Day Change: 0.02 | |
| Week Change: 0.29% Year-to-date Change: 10.4% | |
| TRMK Links: Profile News Message Board | |
| Charts:- Daily , Weekly | |
| Add TRMK to Watchlist: View: Get Complete TRMK Trend Analysis ➞ | |
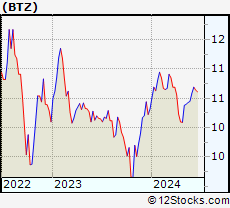 | BTZ BlackRock Credit Allocation Income Trust |
| Sector: Financials | |
| SubSector: Closed-End Fund - Debt | |
| MarketCap: 1023.07 Millions | |
| Recent Price: 10.43 Smart Investing & Trading Score: 33 | |
| Day Percent Change: -0.48% Day Change: -0.05 | |
| Week Change: 0.29% Year-to-date Change: 1.1% | |
| BTZ Links: Profile News Message Board | |
| Charts:- Daily , Weekly | |
| Add BTZ to Watchlist: View: Get Complete BTZ Trend Analysis ➞ | |
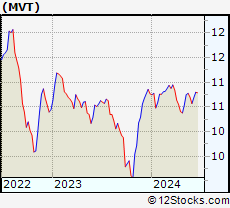 | MVT BlackRock MuniVest Fund II, Inc. |
| Sector: Financials | |
| SubSector: Closed-End Fund - Debt | |
| MarketCap: 253.707 Millions | |
| Recent Price: 10.78 Smart Investing & Trading Score: 65 | |
| Day Percent Change: 0.00% Day Change: 0.00 | |
| Week Change: 0.28% Year-to-date Change: 0.1% | |
| MVT Links: Profile News Message Board | |
| Charts:- Daily , Weekly | |
| Add MVT to Watchlist: View: Get Complete MVT Trend Analysis ➞ | |
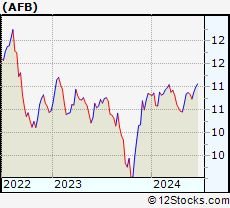 | AFB AllianceBernstein National Municipal Income Fund |
| Sector: Financials | |
| SubSector: Closed-End Fund - Debt | |
| MarketCap: 342.307 Millions | |
| Recent Price: 10.88 Smart Investing & Trading Score: 50 | |
| Day Percent Change: -0.37% Day Change: -0.04 | |
| Week Change: 0.28% Year-to-date Change: 0.4% | |
| AFB Links: Profile News Message Board | |
| Charts:- Daily , Weekly | |
| Add AFB to Watchlist: View: Get Complete AFB Trend Analysis ➞ | |
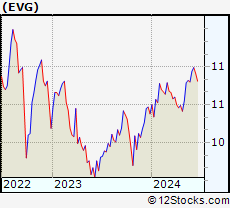 | EVG Eaton Vance Short Duration Diversified Income Fund |
| Sector: Financials | |
| SubSector: Closed-End Fund - Debt | |
| MarketCap: 183.207 Millions | |
| Recent Price: 10.82 Smart Investing & Trading Score: 69 | |
| Day Percent Change: -0.18% Day Change: -0.02 | |
| Week Change: 0.28% Year-to-date Change: 4.2% | |
| EVG Links: Profile News Message Board | |
| Charts:- Daily , Weekly | |
| Add EVG to Watchlist: View: Get Complete EVG Trend Analysis ➞ | |
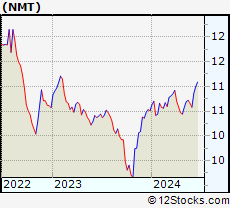 | NMT Nuveen Massachusetts Quality Municipal Income Fund |
| Sector: Financials | |
| SubSector: Closed-End Fund - Debt | |
| MarketCap: 123.407 Millions | |
| Recent Price: 10.72 Smart Investing & Trading Score: 83 | |
| Day Percent Change: -0.14% Day Change: -0.01 | |
| Week Change: 0.28% Year-to-date Change: 2.0% | |
| NMT Links: Profile News Message Board | |
| Charts:- Daily , Weekly | |
| Add NMT to Watchlist: View: Get Complete NMT Trend Analysis ➞ | |
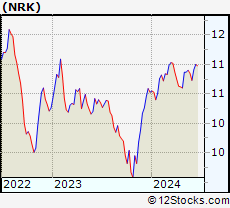 | NRK Nuveen New York AMT-Free Quality Municipal Income Fund |
| Sector: Financials | |
| SubSector: Diversified Investments | |
| MarketCap: 1006.7 Millions | |
| Recent Price: 10.90 Smart Investing & Trading Score: 63 | |
| Day Percent Change: 0.28% Day Change: 0.03 | |
| Week Change: 0.28% Year-to-date Change: 3.5% | |
| NRK Links: Profile News Message Board | |
| Charts:- Daily , Weekly | |
| Add NRK to Watchlist: View: Get Complete NRK Trend Analysis ➞ | |
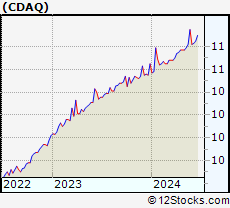 | CDAQ Compass Digital Acquisition Corp. |
| Sector: Financials | |
| SubSector: SPAC | |
| MarketCap: 275 Millions | |
| Recent Price: 10.82 Smart Investing & Trading Score: 75 | |
| Day Percent Change: 0.00% Day Change: 0.00 | |
| Week Change: 0.28% Year-to-date Change: 1.6% | |
| CDAQ Links: Profile News Message Board | |
| Charts:- Daily , Weekly | |
| Add CDAQ to Watchlist: View: Get Complete CDAQ Trend Analysis ➞ | |
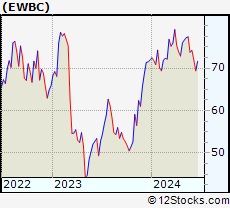 | EWBC East West Bancorp, Inc. |
| Sector: Financials | |
| SubSector: Foreign Money Center Banks | |
| MarketCap: 4618.31 Millions | |
| Recent Price: 77.41 Smart Investing & Trading Score: 71 | |
| Day Percent Change: 0.08% Day Change: 0.06 | |
| Week Change: 0.27% Year-to-date Change: 7.6% | |
| EWBC Links: Profile News Message Board | |
| Charts:- Daily , Weekly | |
| Add EWBC to Watchlist: View: Get Complete EWBC Trend Analysis ➞ | |
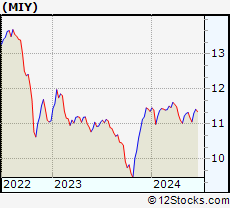 | MIY BlackRock MuniYield Michigan Quality Fund, Inc. |
| Sector: Financials | |
| SubSector: Closed-End Fund - Debt | |
| MarketCap: 352.207 Millions | |
| Recent Price: 11.33 Smart Investing & Trading Score: 56 | |
| Day Percent Change: 0.00% Day Change: 0.00 | |
| Week Change: 0.27% Year-to-date Change: -0.3% | |
| MIY Links: Profile News Message Board | |
| Charts:- Daily , Weekly | |
| Add MIY to Watchlist: View: Get Complete MIY Trend Analysis ➞ | |
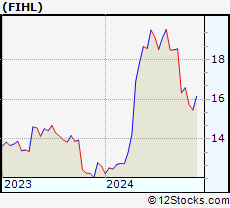 | FIHL Fidelis Insurance Holdings Limited |
| Sector: Financials | |
| SubSector: Insurance - Diversified | |
| MarketCap: 1590 Millions | |
| Recent Price: 18.53 Smart Investing & Trading Score: 68 | |
| Day Percent Change: 0.43% Day Change: 0.08 | |
| Week Change: 0.27% Year-to-date Change: 46.7% | |
| FIHL Links: Profile News Message Board | |
| Charts:- Daily , Weekly | |
| Add FIHL to Watchlist: View: Get Complete FIHL Trend Analysis ➞ | |
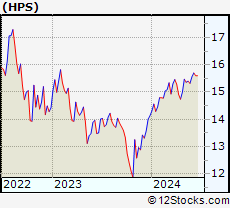 | HPS John Hancock Preferred Income Fund III |
| Sector: Financials | |
| SubSector: Closed-End Fund - Debt | |
| MarketCap: 348.107 Millions | |
| Recent Price: 15.40 Smart Investing & Trading Score: 59 | |
| Day Percent Change: -0.45% Day Change: -0.07 | |
| Week Change: 0.26% Year-to-date Change: 8.9% | |
| HPS Links: Profile News Message Board | |
| Charts:- Daily , Weekly | |
| Add HPS to Watchlist: View: Get Complete HPS Trend Analysis ➞ | |
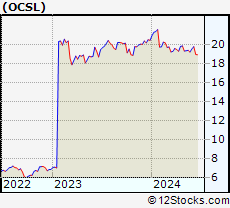 | OCSL Oaktree Specialty Lending Corporation |
| Sector: Financials | |
| SubSector: Credit Services | |
| MarketCap: 353.808 Millions | |
| Recent Price: 19.37 Smart Investing & Trading Score: 42 | |
| Day Percent Change: -0.05% Day Change: -0.01 | |
| Week Change: 0.26% Year-to-date Change: -5.1% | |
| OCSL Links: Profile News Message Board | |
| Charts:- Daily , Weekly | |
| Add OCSL to Watchlist: View: Get Complete OCSL Trend Analysis ➞ | |
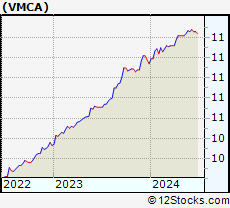 | VMCA Valuence Merger Corp. I |
| Sector: Financials | |
| SubSector: SPAC | |
| MarketCap: 295 Millions | |
| Recent Price: 11.47 Smart Investing & Trading Score: 48 | |
| Day Percent Change: 0.17% Day Change: 0.02 | |
| Week Change: 0.26% Year-to-date Change: 3.0% | |
| VMCA Links: Profile News Message Board | |
| Charts:- Daily , Weekly | |
| Add VMCA to Watchlist: View: Get Complete VMCA Trend Analysis ➞ | |
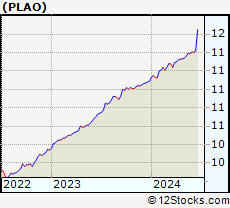 | PLAO Patria Latin American Opportunity Acquisition Corp. |
| Sector: Financials | |
| SubSector: SPAC | |
| MarketCap: 304 Millions | |
| Recent Price: 11.39 Smart Investing & Trading Score: 65 | |
| Day Percent Change: 0.09% Day Change: 0.01 | |
| Week Change: 0.26% Year-to-date Change: 2.7% | |
| PLAO Links: Profile News Message Board | |
| Charts:- Daily , Weekly | |
| Add PLAO to Watchlist: View: Get Complete PLAO Trend Analysis ➞ | |
| For tabular summary view of above stock list: Summary View ➞ 0 - 25 , 25 - 50 , 50 - 75 , 75 - 100 , 100 - 125 , 125 - 150 , 150 - 175 , 175 - 200 , 200 - 225 , 225 - 250 , 250 - 275 , 275 - 300 , 300 - 325 , 325 - 350 , 350 - 375 , 375 - 400 , 400 - 425 , 425 - 450 , 450 - 475 , 475 - 500 , 500 - 525 , 525 - 550 , 550 - 575 , 575 - 600 , 600 - 625 , 625 - 650 , 650 - 675 , 675 - 700 , 700 - 725 , 725 - 750 , 750 - 775 , 775 - 800 , 800 - 825 , 825 - 850 , 850 - 875 , 875 - 900 , 900 - 925 , 925 - 950 , 950 - 975 , 975 - 1000 , 1000 - 1025 , 1025 - 1050 , 1050 - 1075 , 1075 - 1100 , 1100 - 1125 , 1125 - 1150 , 1150 - 1175 , 1175 - 1200 , 1200 - 1225 | ||
| Click To Change The Sort Order: By Market Cap or Company Size Performance: Year-to-date, Week and Day | |
| Select Chart Type: | ||
|
Best Stocks Today 12Stocks.com |
© 2024 12Stocks.com Terms & Conditions Privacy Contact Us
All Information Provided Only For Education And Not To Be Used For Investing or Trading. See Terms & Conditions


One More Thing ... Get Best Stocks Delivered Daily!
Never Ever Miss A Move With Our Top Ten Stocks Lists
Find Best Stocks In Any Market - Bull or Bear Market
Take A Peek At Our Top Ten Stocks Lists: Daily, Weekly, Year-to-Date & Top Trends
Find Best Stocks In Any Market - Bull or Bear Market
Take A Peek At Our Top Ten Stocks Lists: Daily, Weekly, Year-to-Date & Top Trends
Financial Stocks With Best Up Trends [0-bearish to 100-bullish]: Fangdd Network[100], Xinyuan Real[100], MicroSectors Gold[100], Sprott Physical[100], Citizens & Northern[100], Sumitomo Mitsui[100], First Community[100], Chubb [100], Angel Oak[100], Sprott Physical[100], Iris Energy[100]
Best Financial Stocks Year-to-Date:
Root [526.36%], Fangdd Network[149.63%], Banco Macro[126.41%], Grupo Financiero[112.4%], Banco BBVA[110.66%], SelectQuote [110.22%], Gladstone Capital[106.92%], EverQuote [98.2%], Hippo [92.54%], Grupo Supervielle[86.95%], Vista Oil[60.93%] Best Financial Stocks This Week:
Fangdd Network[360.27%], Xinyuan Real[53.28%], Iris Energy[25.68%], Fathom [25.35%], Huize Holding[21.83%], First Foundation[18.98%], Trupanion [17.21%], Bridge [16.67%], MicroSectors Gold[15.19%], KE [13.86%], Douglas Elliman[13.56%] Best Financial Stocks Daily:
Fangdd Network[321.26%], Xinyuan Real[39.49%], MicroSectors Gold[12.02%], Fathom [9.88%], Citizens [8.53%], Hywin [8.28%], Root [6.10%], First Foundation[6.09%], Sprott Physical[6.09%], Freedom Holding[5.02%], NexGen Energy[4.99%]