
 Login Sign Up


| |||||
 |  | ||||

| 12Stocks.com Market Intelligence |
Best Financial Stocks
| In a hurry? Financial Stocks Lists: Performance Trends Table, Stock Charts
Sort Financial stocks: Daily, Weekly, Year-to-Date, Market Cap & Trends. Filter Financial stocks list by size:All Financial Large Mid-Range Small & MicroCap |
| 12Stocks.com Financial Stocks Performances & Trends Daily | |||||||||
|
|  The overall Smart Investing & Trading Score is 95 (0-bearish to 100-bullish) which puts Financial sector in short term bullish trend. The Smart Investing & Trading Score from previous trading session is 100 and a deterioration of trend continues.
| ||||||||
Here are the Smart Investing & Trading Scores of the most requested Financial stocks at 12Stocks.com (click stock name for detailed review):
|


| 12Stocks.com: Investing in Financial sector with Stocks | |
|
The following table helps investors and traders sort through current performance and trends (as measured by Smart Investing & Trading Score) of various
stocks in the Financial sector. Quick View: Move mouse or cursor over stock symbol (ticker) to view short-term Technical chart and over stock name to view long term chart. Click on  to add stock symbol to your watchlist and to add stock symbol to your watchlist and  to view watchlist. Click on any ticker or stock name for detailed market intelligence report for that stock. to view watchlist. Click on any ticker or stock name for detailed market intelligence report for that stock. |
12Stocks.com Performance of Stocks in Financial Sector
| Ticker | Stock Name | Watchlist | Category | Recent Price | Smart Investing & Trading Score | Change % | Weekly Change% |
| DUO | Fangdd Network |   | Property Mgmt | 1.68 | 100 | 321.26% | 360.27% |
| XIN | Xinyuan Real | | Real Estatet | 3.97 | 100 | 39.49% | 53.28% |
| IREN | Iris Energy | | Capital Markets | 6.02 | 100 | 3.26% | 25.68% |
| FTHM | Fathom | | Real Estate Services | 1.78 | 67 | 9.88% | 25.35% |
| HUIZ | Huize Holding | | Insurance | 0.85 | 90 | 0.24% | 21.83% |
| FFWM | First Foundation | | Regional Banks | 6.27 | 74 | 6.09% | 18.98% |
| TRUP | Trupanion | | Insurance | 30.24 | 68 | -7.86% | 17.21% |
| BRDG | Bridge | | Asset Mgmt | 7.98 | 100 | 3.10% | 16.67% |
| GDXU | MicroSectors Gold | | Exchange Traded Fund | 46.70 | 100 | 12.02% | 15.19% |
| BEKE | KE | | Real Estate Services | 19.47 | 100 | 1.72% | 13.86% |
| DOUG | Douglas Elliman | | Financials Services | 1.34 | 57 | -4.96% | 13.56% |
| CIA | Citizens | | Life Insurance | 2.80 | 74 | 8.53% | 13.36% |
| CWK | Cushman & Wakefield | | Property Mgmt | 11.72 | 100 | 0.60% | 12.42% |
| MLP | Maui Land | | Real Estatet | 23.30 | 100 | 1.22% | 11.75% |
| INTR | Inter & Co | | Banks - Regional | 6.42 | 100 | 1.90% | 11.65% |
| SIEB | Siebert | | Brokerage | 2.34 | 68 | -2.50% | 11.43% |
| FCCO | First Community | | Regional - Southwest Banks | 17.95 | 100 | 3.73% | 11.28% |
| NXE | NexGen Energy | | Closed-End Fund - Debt | 7.99 | 81 | 4.99% | 10.97% |
| PSLV | Sprott Physical | | Exchange Traded Fund | 10.54 | 100 | 6.09% | 10.60% |
| TRC | Tejon Ranch | | Property Mgmt | 17.98 | 100 | 0.78% | 10.58% |
| AI | C3.ai | | REIT Mortgage | 26.39 | 47 | 0.73% | 10.46% |
| SLQT | SelectQuote | | Insurance | 2.88 | 90 | -5.57% | 9.92% |
| IIPR | Innovative Industrial | | REIT - Industrial | 114.61 | 100 | 0.80% | 9.75% |
| BRP | BRP | | Real Estatet | 32.66 | 100 | 0.46% | 9.71% |
| AOMR | Angel Oak | | REIT - Mortgage | 12.69 | 100 | 3.51% | 9.59% |
| For chart view version of above stock list: Chart View ➞ 0 - 25 , 25 - 50 , 50 - 75 , 75 - 100 , 100 - 125 , 125 - 150 , 150 - 175 , 175 - 200 , 200 - 225 , 225 - 250 , 250 - 275 , 275 - 300 , 300 - 325 , 325 - 350 , 350 - 375 , 375 - 400 , 400 - 425 , 425 - 450 , 450 - 475 , 475 - 500 , 500 - 525 , 525 - 550 , 550 - 575 , 575 - 600 , 600 - 625 , 625 - 650 , 650 - 675 , 675 - 700 , 700 - 725 , 725 - 750 , 750 - 775 , 775 - 800 , 800 - 825 , 825 - 850 , 850 - 875 , 875 - 900 , 900 - 925 , 925 - 950 , 950 - 975 , 975 - 1000 , 1000 - 1025 , 1025 - 1050 , 1050 - 1075 , 1075 - 1100 , 1100 - 1125 , 1125 - 1150 , 1150 - 1175 , 1175 - 1200 , 1200 - 1225 | ||
 | Click To Change The Sort Order: By Market Cap or Company Size Performance: Year-to-date, Week and Day |  |
|
Get the most comprehensive stock market coverage daily at 12Stocks.com ➞ Best Stocks Today ➞ Best Stocks Weekly ➞ Best Stocks Year-to-Date ➞ Best Stocks Trends ➞  Best Stocks Today 12Stocks.com Best Nasdaq Stocks ➞ Best S&P 500 Stocks ➞ Best Tech Stocks ➞ Best Biotech Stocks ➞ |
| Detailed Overview of Financial Stocks |
| Financial Technical Overview, Leaders & Laggards, Top Financial ETF Funds & Detailed Financial Stocks List, Charts, Trends & More |
| Financial Sector: Technical Analysis, Trends & YTD Performance | |
| Financial sector is composed of stocks
from banks, brokers, insurance, REITs
and services subsectors. Financial sector, as represented by XLF, an exchange-traded fund [ETF] that holds basket of Financial stocks (e.g, Bank of America, Goldman Sachs) is up by 13.01% and is currently outperforming the overall market by 2.44% year-to-date. Below is a quick view of Technical charts and trends: |
|
 XLF Weekly Chart |
|
| Long Term Trend: Very Good | |
| Medium Term Trend: Very Good | |
 XLF Daily Chart |
|
| Short Term Trend: Very Good | |
| Overall Trend Score: 95 | |
| YTD Performance: 13.01% | |
| **Trend Scores & Views Are Only For Educational Purposes And Not For Investing | |
| 12Stocks.com: Top Performing Financial Sector Stocks | ||||||||||||||||||||||||||||||||||||||||||||||||
 The top performing Financial sector stocks year to date are
Now, more recently, over last week, the top performing Financial sector stocks on the move are


|
||||||||||||||||||||||||||||||||||||||||||||||||
| 12Stocks.com: Investing in Financial Sector using Exchange Traded Funds | |
|
The following table shows list of key exchange traded funds (ETF) that
help investors track Financial Index. For detailed view, check out our ETF Funds section of our website. Quick View: Move mouse or cursor over ETF symbol (ticker) to view short-term Technical chart and over ETF name to view long term chart. Click on ticker or stock name for detailed view. Click on to add stock symbol to your watchlist and to view watchlist. |
12Stocks.com List of ETFs that track Financial Index
| Ticker | ETF Name | Watchlist | Recent Price | Smart Investing & Trading Score | Change % | Week % | Year-to-date % |
| XLF | Financial | | 42.49 | 95 | 0.73 | 1.58 | 13.01% |
| IAI | Broker-Dealers & Secs | | 119.47 | 100 | 1.08 | 2.59 | 10.08% |
| IYF | Financials | | 96.85 | 95 | 0.43 | 1.73 | 13.39% |
| IYG | Financial Services | | 67.11 | 95 | 0.15 | 1.56 | 12.34% |
| KRE | Regional Banking | | 51.19 | 83 | 0.23 | 1.67 | -2.37% |
| IXG | Global Financials | | 88.72 | 88 | 0.21 | 1.41 | 12.91% |
| VFH | Financials | | 103.00 | 95 | 0.18 | 1.45 | 11.64% |
| KBE | Bank | | 47.93 | 83 | 0.44 | 1.25 | 4.15% |
| FAS | Financial Bull 3X | | 112.32 | 95 | 1.81 | 4.06 | 35.9% |
| FAZ | Financial Bear 3X | | 9.75 | 10 | -1.71 | -3.75 | -28.68% |
| UYG | Financials | | 68.54 | 100 | 1.23 | 2.77 | 24.17% |
| IAT | Regional Banks | | 43.42 | 76 | -0.26 | 1.02 | 3.78% |
| KIE | Insurance | | 51.83 | 100 | 0.88 | 1.09 | 14.62% |
| PSCF | SmallCap Financials | | 49.03 | 95 | 0.28 | 1.44 | -0.31% |
| EUFN | Europe Financials | | 24.13 | 95 | 0.67 | 2.51 | 15.12% |
| PGF | Financial Preferred | | 14.81 | 52 | -0.10 | 0.68 | 1.58% |
| 12Stocks.com: Charts, Trends, Fundamental Data and Performances of Financial Stocks | |
|
We now take in-depth look at all Financial stocks including charts, multi-period performances and overall trends (as measured by Smart Investing & Trading Score). One can sort Financial stocks (click link to choose) by Daily, Weekly and by Year-to-Date performances. Also, one can sort by size of the company or by market capitalization. |
| Select Your Default Chart Type: | |||||
| |||||
| Click on stock symbol or name for detailed view. Click on to add stock symbol to your watchlist and to view watchlist. Quick View: Move mouse or cursor over "Daily" to quickly view daily Technical stock chart and over "Weekly" to view weekly Technical stock chart. | |||||

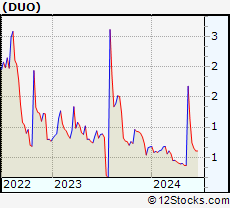 | DUO Fangdd Network Group Ltd. |
| Sector: Financials | |
| SubSector: Property Management | |
| MarketCap: 783.142 Millions | |
| Recent Price: 1.68 Smart Investing & Trading Score: 100 | |
| Day Percent Change: 321.26% Day Change: 1.28 | |
| Week Change: 360.27% Year-to-date Change: 149.6% | |
| DUO Links: Profile News Message Board | |
| Charts:- Daily , Weekly | |
| Add DUO to Watchlist: View: Get Complete DUO Trend Analysis ➞ | |
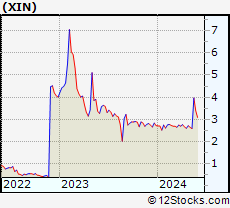 | XIN Xinyuan Real Estate Co., Ltd. |
| Sector: Financials | |
| SubSector: Real Estate Development | |
| MarketCap: 136.119 Millions | |
| Recent Price: 3.97 Smart Investing & Trading Score: 100 | |
| Day Percent Change: 39.49% Day Change: 1.12 | |
| Week Change: 53.28% Year-to-date Change: 46.0% | |
| XIN Links: Profile News Message Board | |
| Charts:- Daily , Weekly | |
| Add XIN to Watchlist: View: Get Complete XIN Trend Analysis ➞ | |
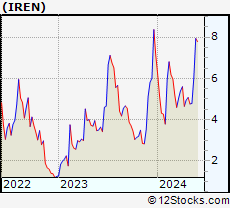 | IREN Iris Energy Limited |
| Sector: Financials | |
| SubSector: Capital Markets | |
| MarketCap: 236 Millions | |
| Recent Price: 6.02 Smart Investing & Trading Score: 100 | |
| Day Percent Change: 3.26% Day Change: 0.19 | |
| Week Change: 25.68% Year-to-date Change: -15.6% | |
| IREN Links: Profile News Message Board | |
| Charts:- Daily , Weekly | |
| Add IREN to Watchlist: View: Get Complete IREN Trend Analysis ➞ | |
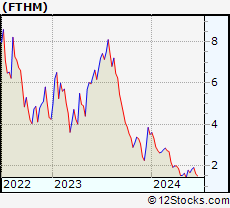 | FTHM Fathom Holdings Inc. |
| Sector: Financials | |
| SubSector: Real Estate Services | |
| MarketCap: 37267 Millions | |
| Recent Price: 1.78 Smart Investing & Trading Score: 67 | |
| Day Percent Change: 9.88% Day Change: 0.16 | |
| Week Change: 25.35% Year-to-date Change: -49.3% | |
| FTHM Links: Profile News Message Board | |
| Charts:- Daily , Weekly | |
| Add FTHM to Watchlist: View: Get Complete FTHM Trend Analysis ➞ | |
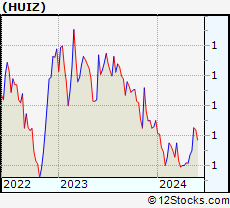 | HUIZ Huize Holding Limited |
| Sector: Financials | |
| SubSector: Insurance Brokers | |
| MarketCap: 37157 Millions | |
| Recent Price: 0.85 Smart Investing & Trading Score: 90 | |
| Day Percent Change: 0.24% Day Change: 0.00 | |
| Week Change: 21.83% Year-to-date Change: -5.3% | |
| HUIZ Links: Profile News Message Board | |
| Charts:- Daily , Weekly | |
| Add HUIZ to Watchlist: View: Get Complete HUIZ Trend Analysis ➞ | |
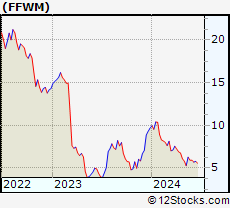 | FFWM First Foundation Inc. |
| Sector: Financials | |
| SubSector: Regional - Midwest Banks | |
| MarketCap: 457.17 Millions | |
| Recent Price: 6.27 Smart Investing & Trading Score: 74 | |
| Day Percent Change: 6.09% Day Change: 0.36 | |
| Week Change: 18.98% Year-to-date Change: -35.2% | |
| FFWM Links: Profile News Message Board | |
| Charts:- Daily , Weekly | |
| Add FFWM to Watchlist: View: Get Complete FFWM Trend Analysis ➞ | |
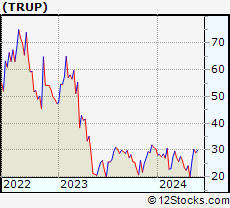 | TRUP Trupanion, Inc. |
| Sector: Financials | |
| SubSector: Accident & Health Insurance | |
| MarketCap: 852.06 Millions | |
| Recent Price: 30.24 Smart Investing & Trading Score: 68 | |
| Day Percent Change: -7.86% Day Change: -2.58 | |
| Week Change: 17.21% Year-to-date Change: -0.9% | |
| TRUP Links: Profile News Message Board | |
| Charts:- Daily , Weekly | |
| Add TRUP to Watchlist: View: Get Complete TRUP Trend Analysis ➞ | |
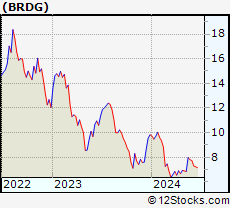 | BRDG Bridge Investment Group Holdings Inc. |
| Sector: Financials | |
| SubSector: Asset Management | |
| MarketCap: 1320 Millions | |
| Recent Price: 7.98 Smart Investing & Trading Score: 100 | |
| Day Percent Change: 3.10% Day Change: 0.24 | |
| Week Change: 16.67% Year-to-date Change: -18.8% | |
| BRDG Links: Profile News Message Board | |
| Charts:- Daily , Weekly | |
| Add BRDG to Watchlist: View: Get Complete BRDG Trend Analysis ➞ | |
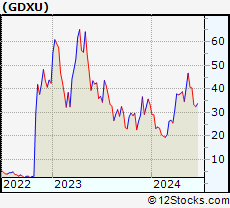 | GDXU MicroSectors Gold Miners 3X Leveraged ETNs |
| Sector: Financials | |
| SubSector: Exchange Traded Fund | |
| MarketCap: 60157 Millions | |
| Recent Price: 46.70 Smart Investing & Trading Score: 100 | |
| Day Percent Change: 12.02% Day Change: 5.01 | |
| Week Change: 15.19% Year-to-date Change: 39.9% | |
| GDXU Links: Profile News Message Board | |
| Charts:- Daily , Weekly | |
| Add GDXU to Watchlist: View: Get Complete GDXU Trend Analysis ➞ | |
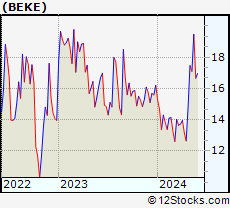 | BEKE KE Holdings Inc. |
| Sector: Financials | |
| SubSector: Real Estate Services | |
| MarketCap: 80167 Millions | |
| Recent Price: 19.47 Smart Investing & Trading Score: 100 | |
| Day Percent Change: 1.72% Day Change: 0.33 | |
| Week Change: 13.86% Year-to-date Change: 20.1% | |
| BEKE Links: Profile News Message Board | |
| Charts:- Daily , Weekly | |
| Add BEKE to Watchlist: View: Get Complete BEKE Trend Analysis ➞ | |
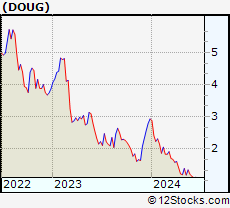 | DOUG Douglas Elliman Inc. |
| Sector: Financials | |
| SubSector: Financials Services | |
| MarketCap: 197 Millions | |
| Recent Price: 1.34 Smart Investing & Trading Score: 57 | |
| Day Percent Change: -4.96% Day Change: -0.07 | |
| Week Change: 13.56% Year-to-date Change: -54.3% | |
| DOUG Links: Profile News Message Board | |
| Charts:- Daily , Weekly | |
| Add DOUG to Watchlist: View: Get Complete DOUG Trend Analysis ➞ | |
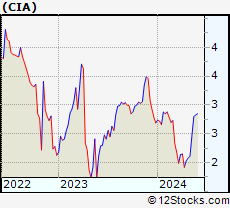 | CIA Citizens, Inc. |
| Sector: Financials | |
| SubSector: Life Insurance | |
| MarketCap: 341.986 Millions | |
| Recent Price: 2.80 Smart Investing & Trading Score: 74 | |
| Day Percent Change: 8.53% Day Change: 0.22 | |
| Week Change: 13.36% Year-to-date Change: 4.1% | |
| CIA Links: Profile News Message Board | |
| Charts:- Daily , Weekly | |
| Add CIA to Watchlist: View: Get Complete CIA Trend Analysis ➞ | |
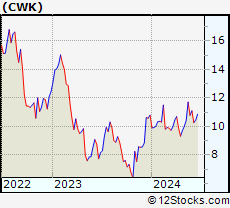 | CWK Cushman & Wakefield plc |
| Sector: Financials | |
| SubSector: Property Management | |
| MarketCap: 2651.62 Millions | |
| Recent Price: 11.72 Smart Investing & Trading Score: 100 | |
| Day Percent Change: 0.60% Day Change: 0.07 | |
| Week Change: 12.42% Year-to-date Change: 8.5% | |
| CWK Links: Profile News Message Board | |
| Charts:- Daily , Weekly | |
| Add CWK to Watchlist: View: Get Complete CWK Trend Analysis ➞ | |
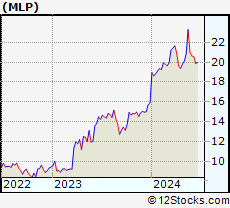 | MLP Maui Land & Pineapple Company, Inc. |
| Sector: Financials | |
| SubSector: Real Estate Development | |
| MarketCap: 186.619 Millions | |
| Recent Price: 23.30 Smart Investing & Trading Score: 100 | |
| Day Percent Change: 1.22% Day Change: 0.28 | |
| Week Change: 11.75% Year-to-date Change: 46.6% | |
| MLP Links: Profile News Message Board | |
| Charts:- Daily , Weekly | |
| Add MLP to Watchlist: View: Get Complete MLP Trend Analysis ➞ | |
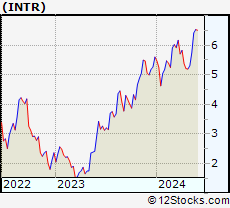 | INTR Inter & Co, Inc. |
| Sector: Financials | |
| SubSector: Banks - Regional | |
| MarketCap: 1250 Millions | |
| Recent Price: 6.42 Smart Investing & Trading Score: 100 | |
| Day Percent Change: 1.90% Day Change: 0.12 | |
| Week Change: 11.65% Year-to-date Change: 14.5% | |
| INTR Links: Profile News Message Board | |
| Charts:- Daily , Weekly | |
| Add INTR to Watchlist: View: Get Complete INTR Trend Analysis ➞ | |
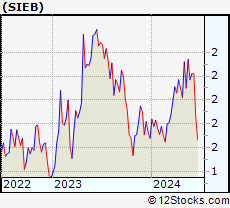 | SIEB Siebert Financial Corp. |
| Sector: Financials | |
| SubSector: Investment Brokerage - Regional | |
| MarketCap: 272.365 Millions | |
| Recent Price: 2.34 Smart Investing & Trading Score: 68 | |
| Day Percent Change: -2.50% Day Change: -0.06 | |
| Week Change: 11.43% Year-to-date Change: 39.3% | |
| SIEB Links: Profile News Message Board | |
| Charts:- Daily , Weekly | |
| Add SIEB to Watchlist: View: Get Complete SIEB Trend Analysis ➞ | |
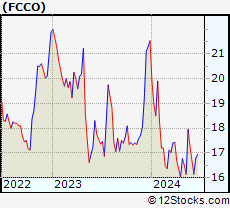 | FCCO First Community Corporation |
| Sector: Financials | |
| SubSector: Regional - Southwest Banks | |
| MarketCap: 123.865 Millions | |
| Recent Price: 17.95 Smart Investing & Trading Score: 100 | |
| Day Percent Change: 3.73% Day Change: 0.64 | |
| Week Change: 11.28% Year-to-date Change: -16.6% | |
| FCCO Links: Profile News Message Board | |
| Charts:- Daily , Weekly | |
| Add FCCO to Watchlist: View: Get Complete FCCO Trend Analysis ➞ | |
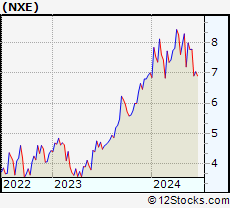 | NXE NexGen Energy Ltd. |
| Sector: Financials | |
| SubSector: Closed-End Fund - Debt | |
| MarketCap: 210.207 Millions | |
| Recent Price: 7.99 Smart Investing & Trading Score: 81 | |
| Day Percent Change: 4.99% Day Change: 0.38 | |
| Week Change: 10.97% Year-to-date Change: 14.1% | |
| NXE Links: Profile News Message Board | |
| Charts:- Daily , Weekly | |
| Add NXE to Watchlist: View: Get Complete NXE Trend Analysis ➞ | |
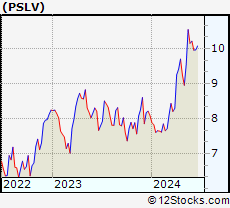 | PSLV Sprott Physical Silver Trust |
| Sector: Financials | |
| SubSector: Exchange Traded Fund | |
| MarketCap: 765.851 Millions | |
| Recent Price: 10.54 Smart Investing & Trading Score: 100 | |
| Day Percent Change: 6.09% Day Change: 0.60 | |
| Week Change: 10.6% Year-to-date Change: 30.5% | |
| PSLV Links: Profile News Message Board | |
| Charts:- Daily , Weekly | |
| Add PSLV to Watchlist: View: Get Complete PSLV Trend Analysis ➞ | |
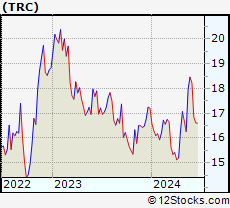 | TRC Tejon Ranch Co. |
| Sector: Financials | |
| SubSector: Property Management | |
| MarketCap: 346.442 Millions | |
| Recent Price: 17.98 Smart Investing & Trading Score: 100 | |
| Day Percent Change: 0.78% Day Change: 0.14 | |
| Week Change: 10.58% Year-to-date Change: 4.5% | |
| TRC Links: Profile News Message Board | |
| Charts:- Daily , Weekly | |
| Add TRC to Watchlist: View: Get Complete TRC Trend Analysis ➞ | |
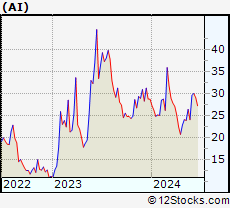 | AI C3.ai, Inc. |
| Sector: Financials | |
| SubSector: REIT Mortgage | |
| MarketCap: 12467 Millions | |
| Recent Price: 26.39 Smart Investing & Trading Score: 47 | |
| Day Percent Change: 0.73% Day Change: 0.19 | |
| Week Change: 10.46% Year-to-date Change: -8.1% | |
| AI Links: Profile News Message Board | |
| Charts:- Daily , Weekly | |
| Add AI to Watchlist: View: Get Complete AI Trend Analysis ➞ | |
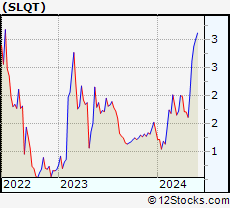 | SLQT SelectQuote, Inc. |
| Sector: Financials | |
| SubSector: Insurance Brokers | |
| MarketCap: 38257 Millions | |
| Recent Price: 2.88 Smart Investing & Trading Score: 90 | |
| Day Percent Change: -5.57% Day Change: -0.17 | |
| Week Change: 9.92% Year-to-date Change: 110.2% | |
| SLQT Links: Profile News Message Board | |
| Charts:- Daily , Weekly | |
| Add SLQT to Watchlist: View: Get Complete SLQT Trend Analysis ➞ | |
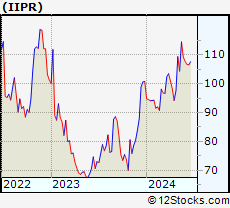 | IIPR Innovative Industrial Properties, Inc. |
| Sector: Financials | |
| SubSector: REIT - Industrial | |
| MarketCap: 1193.29 Millions | |
| Recent Price: 114.61 Smart Investing & Trading Score: 100 | |
| Day Percent Change: 0.80% Day Change: 0.91 | |
| Week Change: 9.75% Year-to-date Change: 13.7% | |
| IIPR Links: Profile News Message Board | |
| Charts:- Daily , Weekly | |
| Add IIPR to Watchlist: View: Get Complete IIPR Trend Analysis ➞ | |
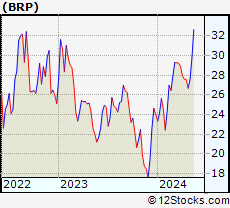 | BRP BRP Group, Inc. |
| Sector: Financials | |
| SubSector: Real Estate Development | |
| MarketCap: 741.219 Millions | |
| Recent Price: 32.66 Smart Investing & Trading Score: 100 | |
| Day Percent Change: 0.46% Day Change: 0.15 | |
| Week Change: 9.71% Year-to-date Change: 36.0% | |
| BRP Links: Profile News Message Board | |
| Charts:- Daily , Weekly | |
| Add BRP to Watchlist: View: Get Complete BRP Trend Analysis ➞ | |
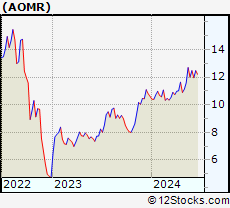 | AOMR Angel Oak Mortgage REIT, Inc. |
| Sector: Financials | |
| SubSector: REIT - Mortgage | |
| MarketCap: 202 Millions | |
| Recent Price: 12.69 Smart Investing & Trading Score: 100 | |
| Day Percent Change: 3.51% Day Change: 0.43 | |
| Week Change: 9.59% Year-to-date Change: 19.6% | |
| AOMR Links: Profile News Message Board | |
| Charts:- Daily , Weekly | |
| Add AOMR to Watchlist: View: Get Complete AOMR Trend Analysis ➞ | |
| For tabular summary view of above stock list: Summary View ➞ 0 - 25 , 25 - 50 , 50 - 75 , 75 - 100 , 100 - 125 , 125 - 150 , 150 - 175 , 175 - 200 , 200 - 225 , 225 - 250 , 250 - 275 , 275 - 300 , 300 - 325 , 325 - 350 , 350 - 375 , 375 - 400 , 400 - 425 , 425 - 450 , 450 - 475 , 475 - 500 , 500 - 525 , 525 - 550 , 550 - 575 , 575 - 600 , 600 - 625 , 625 - 650 , 650 - 675 , 675 - 700 , 700 - 725 , 725 - 750 , 750 - 775 , 775 - 800 , 800 - 825 , 825 - 850 , 850 - 875 , 875 - 900 , 900 - 925 , 925 - 950 , 950 - 975 , 975 - 1000 , 1000 - 1025 , 1025 - 1050 , 1050 - 1075 , 1075 - 1100 , 1100 - 1125 , 1125 - 1150 , 1150 - 1175 , 1175 - 1200 , 1200 - 1225 | ||
| Click To Change The Sort Order: By Market Cap or Company Size Performance: Year-to-date, Week and Day | |
| Select Chart Type: | ||
|
Best Stocks Today 12Stocks.com |
© 2024 12Stocks.com Terms & Conditions Privacy Contact Us
All Information Provided Only For Education And Not To Be Used For Investing or Trading. See Terms & Conditions


One More Thing ... Get Best Stocks Delivered Daily!
Never Ever Miss A Move With Our Top Ten Stocks Lists
Find Best Stocks In Any Market - Bull or Bear Market
Take A Peek At Our Top Ten Stocks Lists: Daily, Weekly, Year-to-Date & Top Trends
Find Best Stocks In Any Market - Bull or Bear Market
Take A Peek At Our Top Ten Stocks Lists: Daily, Weekly, Year-to-Date & Top Trends
Financial Stocks With Best Up Trends [0-bearish to 100-bullish]: Fangdd Network[100], Xinyuan Real[100], MicroSectors Gold[100], Sprott Physical[100], Citizens & Northern[100], Sumitomo Mitsui[100], First Community[100], Chubb [100], Angel Oak[100], Sprott Physical[100], Iris Energy[100]
Best Financial Stocks Year-to-Date:
Root [526.36%], Fangdd Network[149.63%], Banco Macro[126.41%], Grupo Financiero[112.4%], Banco BBVA[110.66%], SelectQuote [110.22%], Gladstone Capital[106.92%], EverQuote [98.2%], Hippo [92.54%], Grupo Supervielle[86.95%], Vista Oil[60.93%] Best Financial Stocks This Week:
Fangdd Network[360.27%], Xinyuan Real[53.28%], Iris Energy[25.68%], Fathom [25.35%], Huize Holding[21.83%], First Foundation[18.98%], Trupanion [17.21%], Bridge [16.67%], MicroSectors Gold[15.19%], KE [13.86%], Douglas Elliman[13.56%] Best Financial Stocks Daily:
Fangdd Network[321.26%], Xinyuan Real[39.49%], MicroSectors Gold[12.02%], Fathom [9.88%], Citizens [8.53%], Hywin [8.28%], Root [6.10%], First Foundation[6.09%], Sprott Physical[6.09%], Freedom Holding[5.02%], NexGen Energy[4.99%]