
 Login Sign Up


| |||||
 |  | ||||

| 12Stocks.com Market Intelligence |
Best Financial Stocks
| In a hurry? Financial Stocks Lists: Performance Trends Table, Stock Charts
Sort Financial stocks: Daily, Weekly, Year-to-Date, Market Cap & Trends. Filter Financial stocks list by size:All Financial Large Mid-Range Small & MicroCap |
| 12Stocks.com Financial Stocks Performances & Trends Daily | |||||||||
|
|  The overall Smart Investing & Trading Score is 78 (0-bearish to 100-bullish) which puts Financial sector in short term neutral to bullish trend. The Smart Investing & Trading Score from previous trading session is 46 and hence an improvement of trend.
| ||||||||
Here are the Smart Investing & Trading Scores of the most requested Financial stocks at 12Stocks.com (click stock name for detailed review):
|


| 12Stocks.com: Investing in Financial sector with Stocks | |
|
The following table helps investors and traders sort through current performance and trends (as measured by Smart Investing & Trading Score) of various
stocks in the Financial sector. Quick View: Move mouse or cursor over stock symbol (ticker) to view short-term Technical chart and over stock name to view long term chart. Click on  to add stock symbol to your watchlist and to add stock symbol to your watchlist and  to view watchlist. Click on any ticker or stock name for detailed market intelligence report for that stock. to view watchlist. Click on any ticker or stock name for detailed market intelligence report for that stock. |
12Stocks.com Performance of Stocks in Financial Sector
| Ticker | Stock Name | Watchlist | Category | Recent Price | Smart Investing & Trading Score | Change % | Weekly Change% |
| FITB | Fifth Third |   | Regional Banks | 37.42 | 68 | 1.82% | 0.46% |
| HTLF | Heartland | | Regional - Southwest Banks | 43.96 | 76 | 2.07% | 0.46% |
| DNP | DNP Select | | Closed-End Fund - Equity | 8.72 | 42 | 1.63% | 0.46% |
| CFFS | CF Acquisition | | SPAC | 11.01 | 83 | 0.18% | 0.46% |
| CIB | Bancolombia S.A | | Foreign Banks | 35.46 | 58 | -0.31% | 0.45% |
| PPBI | Pacific Premier | | Regional Banks | 22.24 | 42 | 1.65% | 0.45% |
| DFAI | Dimensional | | Exchange Traded Fund | 30.71 | 86 | 1.02% | 0.45% |
| FTII | FutureTech II | | SPAC | 11.15 | 45 | 0.54% | 0.45% |
| BRKH | Burtech Acquisition | | SPAC | 11.17 | 58 | 0.81% | 0.45% |
| KCGI | Kensington Capital | | SPAC | 11.08 | 85 | 0.34% | 0.45% |
| ETY | Eaton Vance | | Closed-End Fund - Equity | 13.64 | 95 | 0.44% | 0.44% |
| ALLY | Ally | | Mortgage | 38.97 | 63 | 1.75% | 0.44% |
| RKT | Rocket | | Mortgage Finance | 13.90 | 74 | 0.58% | 0.43% |
| MMT | MFS Multimarket | | Closed-End Fund - Debt | 4.64 | 70 | 0.43% | 0.43% |
| DX | Dynex Capital | | Mortgage | 12.25 | 55 | 0.66% | 0.41% |
| LANDM | Gladstone Land | | REIT - Specialty | 24.22 | 93 | 0.54% | 0.41% |
| PMX | PIMCO Municipal | | Closed-End Fund - Debt | 7.48 | 52 | 0.81% | 0.40% |
| DBL | DoubleLine Opportunistic | | Closed-End Fund - Debt | 15.03 | 25 | 0.57% | 0.40% |
| BFS | Saul Centers | | REIT - Retail | 36.39 | 53 | 1.17% | 0.39% |
| OXLCO | Oxford Lane | | Asset Mgmt | 22.31 | 55 | 0.07% | 0.39% |
| FBCV | Fidelity Blue | | Exchange Traded Fund | 30.62 | 83 | 1.96% | 0.39% |
| MAA | Mid-America Apartment | | REIT | 133.71 | 68 | 2.96% | 0.38% |
| MIN | MFS Intermediate | | Closed-End Fund - Debt | 2.62 | 42 | 1.16% | 0.38% |
| ETV | Eaton Vance | | Closed-End Fund - Equity | 13.04 | 73 | 1.24% | 0.38% |
| MOFG | MidWestOne | | Regional - Southwest Banks | 21.41 | 30 | -0.74% | 0.38% |
| For chart view version of above stock list: Chart View ➞ 0 - 25 , 25 - 50 , 50 - 75 , 75 - 100 , 100 - 125 , 125 - 150 , 150 - 175 , 175 - 200 , 200 - 225 , 225 - 250 , 250 - 275 , 275 - 300 , 300 - 325 , 325 - 350 , 350 - 375 , 375 - 400 , 400 - 425 , 425 - 450 , 450 - 475 , 475 - 500 , 500 - 525 , 525 - 550 , 550 - 575 , 575 - 600 , 600 - 625 , 625 - 650 , 650 - 675 , 675 - 700 , 700 - 725 , 725 - 750 , 750 - 775 , 775 - 800 , 800 - 825 , 825 - 850 , 850 - 875 , 875 - 900 , 900 - 925 , 925 - 950 , 950 - 975 , 975 - 1000 , 1000 - 1025 , 1025 - 1050 , 1050 - 1075 , 1075 - 1100 , 1100 - 1125 , 1125 - 1150 , 1150 - 1175 , 1175 - 1200 , 1200 - 1225 | ||
 | Click To Change The Sort Order: By Market Cap or Company Size Performance: Year-to-date, Week and Day |  |
|
Get the most comprehensive stock market coverage daily at 12Stocks.com ➞ Best Stocks Today ➞ Best Stocks Weekly ➞ Best Stocks Year-to-Date ➞ Best Stocks Trends ➞  Best Stocks Today 12Stocks.com Best Nasdaq Stocks ➞ Best S&P 500 Stocks ➞ Best Tech Stocks ➞ Best Biotech Stocks ➞ |
| Detailed Overview of Financial Stocks |
| Financial Technical Overview, Leaders & Laggards, Top Financial ETF Funds & Detailed Financial Stocks List, Charts, Trends & More |
| Financial Sector: Technical Analysis, Trends & YTD Performance | |
| Financial sector is composed of stocks
from banks, brokers, insurance, REITs
and services subsectors. Financial sector, as represented by XLF, an exchange-traded fund [ETF] that holds basket of Financial stocks (e.g, Bank of America, Goldman Sachs) is up by 10.74% and is currently outperforming the overall market by 0.95% year-to-date. Below is a quick view of Technical charts and trends: |
|
 XLF Weekly Chart |
|
| Long Term Trend: Very Good | |
| Medium Term Trend: Good | |
 XLF Daily Chart |
|
| Short Term Trend: Very Good | |
| Overall Trend Score: 78 | |
| YTD Performance: 10.74% | |
| **Trend Scores & Views Are Only For Educational Purposes And Not For Investing | |
| 12Stocks.com: Top Performing Financial Sector Stocks | ||||||||||||||||||||||||||||||||||||||||||||||||
 The top performing Financial sector stocks year to date are
Now, more recently, over last week, the top performing Financial sector stocks on the move are


|
||||||||||||||||||||||||||||||||||||||||||||||||
| 12Stocks.com: Investing in Financial Sector using Exchange Traded Funds | |
|
The following table shows list of key exchange traded funds (ETF) that
help investors track Financial Index. For detailed view, check out our ETF Funds section of our website. Quick View: Move mouse or cursor over ETF symbol (ticker) to view short-term Technical chart and over ETF name to view long term chart. Click on ticker or stock name for detailed view. Click on to add stock symbol to your watchlist and to view watchlist. |
12Stocks.com List of ETFs that track Financial Index
| Ticker | ETF Name | Watchlist | Recent Price | Smart Investing & Trading Score | Change % | Week % | Year-to-date % |
| XLF | Financial | | 41.64 | 78 | 1.46 | 0.07 | 10.74% |
| IAI | Broker-Dealers & Secs | | 116.64 | 58 | 0.53 | -1.91 | 7.47% |
| IYF | Financials | | 95.25 | 78 | 1.32 | 0.03 | 11.52% |
| IYG | Financial Services | | 65.74 | 71 | 1.14 | -0.33 | 10.05% |
| KRE | Regional Banking | | 48.85 | 61 | 1.41 | -0.14 | -6.83% |
| IXG | Global Financials | | 87.05 | 76 | 0.80 | -0.54 | 10.77% |
| VFH | Financials | | 101.01 | 78 | 1.28 | -0.12 | 9.48% |
| KBE | Bank | | 46.23 | 68 | 1.34 | 0 | 0.46% |
| FAS | Financial Bull 3X | | 105.34 | 78 | 4.16 | -0.02 | 27.45% |
| FAZ | Financial Bear 3X | | 10.35 | 17 | -4.08 | -0.1 | -24.29% |
| UYG | Financials | | 65.65 | 78 | 3.19 | -0.03 | 18.93% |
| IAT | Regional Banks | | 41.90 | 68 | 1.87 | 0 | 0.14% |
| KIE | Insurance | | 51.16 | 78 | 1.11 | 0.69 | 13.14% |
| PSCF | SmallCap Financials | | 47.14 | 53 | 1.59 | -0.79 | -4.14% |
| EUFN | Europe Financials | | 24.18 | 100 | 1.02 | 0.71 | 15.36% |
| PGF | Financial Preferred | | 14.79 | 55 | 1.09 | 0.68 | 1.44% |
| 12Stocks.com: Charts, Trends, Fundamental Data and Performances of Financial Stocks | |
|
We now take in-depth look at all Financial stocks including charts, multi-period performances and overall trends (as measured by Smart Investing & Trading Score). One can sort Financial stocks (click link to choose) by Daily, Weekly and by Year-to-Date performances. Also, one can sort by size of the company or by market capitalization. |
| Select Your Default Chart Type: | |||||
| |||||
| Click on stock symbol or name for detailed view. Click on to add stock symbol to your watchlist and to view watchlist. Quick View: Move mouse or cursor over "Daily" to quickly view daily Technical stock chart and over "Weekly" to view weekly Technical stock chart. | |||||

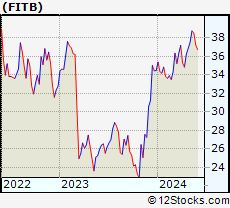 | FITB Fifth Third Bancorp |
| Sector: Financials | |
| SubSector: Regional - Midwest Banks | |
| MarketCap: 10197 Millions | |
| Recent Price: 37.42 Smart Investing & Trading Score: 68 | |
| Day Percent Change: 1.82% Day Change: 0.67 | |
| Week Change: 0.46% Year-to-date Change: 8.5% | |
| FITB Links: Profile News Message Board | |
| Charts:- Daily , Weekly | |
| Add FITB to Watchlist: View: Get Complete FITB Trend Analysis ➞ | |
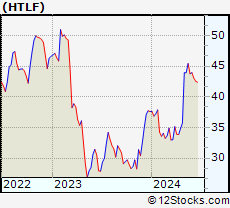 | HTLF Heartland Financial USA, Inc. |
| Sector: Financials | |
| SubSector: Regional - Southwest Banks | |
| MarketCap: 1143.85 Millions | |
| Recent Price: 43.96 Smart Investing & Trading Score: 76 | |
| Day Percent Change: 2.07% Day Change: 0.89 | |
| Week Change: 0.46% Year-to-date Change: 16.9% | |
| HTLF Links: Profile News Message Board | |
| Charts:- Daily , Weekly | |
| Add HTLF to Watchlist: View: Get Complete HTLF Trend Analysis ➞ | |
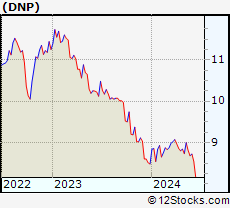 | DNP DNP Select Income Fund Inc. |
| Sector: Financials | |
| SubSector: Closed-End Fund - Equity | |
| MarketCap: 2706.07 Millions | |
| Recent Price: 8.72 Smart Investing & Trading Score: 42 | |
| Day Percent Change: 1.63% Day Change: 0.14 | |
| Week Change: 0.46% Year-to-date Change: 2.8% | |
| DNP Links: Profile News Message Board | |
| Charts:- Daily , Weekly | |
| Add DNP to Watchlist: View: Get Complete DNP Trend Analysis ➞ | |
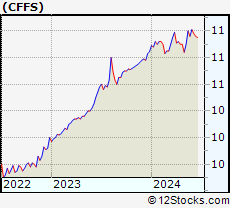 | CFFS CF Acquisition Corp. VII |
| Sector: Financials | |
| SubSector: SPAC | |
| MarketCap: 201 Millions | |
| Recent Price: 11.01 Smart Investing & Trading Score: 83 | |
| Day Percent Change: 0.18% Day Change: 0.02 | |
| Week Change: 0.46% Year-to-date Change: 1.5% | |
| CFFS Links: Profile News Message Board | |
| Charts:- Daily , Weekly | |
| Add CFFS to Watchlist: View: Get Complete CFFS Trend Analysis ➞ | |
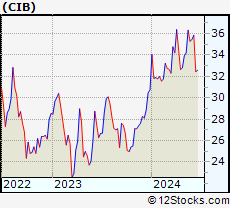 | CIB Bancolombia S.A. |
| Sector: Financials | |
| SubSector: Foreign Regional Banks | |
| MarketCap: 5031.99 Millions | |
| Recent Price: 35.46 Smart Investing & Trading Score: 58 | |
| Day Percent Change: -0.31% Day Change: -0.11 | |
| Week Change: 0.45% Year-to-date Change: 15.2% | |
| CIB Links: Profile News Message Board | |
| Charts:- Daily , Weekly | |
| Add CIB to Watchlist: View: Get Complete CIB Trend Analysis ➞ | |
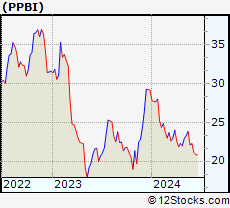 | PPBI Pacific Premier Bancorp, Inc. |
| Sector: Financials | |
| SubSector: Regional - Pacific Banks | |
| MarketCap: 978.029 Millions | |
| Recent Price: 22.24 Smart Investing & Trading Score: 42 | |
| Day Percent Change: 1.65% Day Change: 0.36 | |
| Week Change: 0.45% Year-to-date Change: -23.6% | |
| PPBI Links: Profile News Message Board | |
| Charts:- Daily , Weekly | |
| Add PPBI to Watchlist: View: Get Complete PPBI Trend Analysis ➞ | |
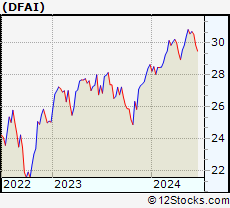 | DFAI Dimensional International Core Equity Market ETF |
| Sector: Financials | |
| SubSector: Exchange Traded Fund | |
| MarketCap: 60157 Millions | |
| Recent Price: 30.71 Smart Investing & Trading Score: 86 | |
| Day Percent Change: 1.02% Day Change: 0.31 | |
| Week Change: 0.45% Year-to-date Change: 7.2% | |
| DFAI Links: Profile News Message Board | |
| Charts:- Daily , Weekly | |
| Add DFAI to Watchlist: View: Get Complete DFAI Trend Analysis ➞ | |
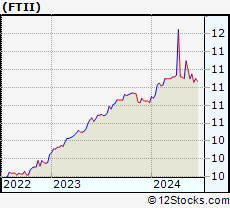 | FTII FutureTech II Acquisition Corp. |
| Sector: Financials | |
| SubSector: SPAC | |
| MarketCap: 160 Millions | |
| Recent Price: 11.15 Smart Investing & Trading Score: 45 | |
| Day Percent Change: 0.54% Day Change: 0.06 | |
| Week Change: 0.45% Year-to-date Change: 3.0% | |
| FTII Links: Profile News Message Board | |
| Charts:- Daily , Weekly | |
| Add FTII to Watchlist: View: Get Complete FTII Trend Analysis ➞ | |
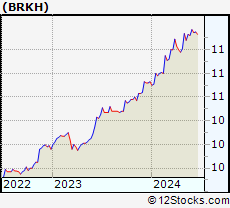 | BRKH Burtech Acquisition Corp. |
| Sector: Financials | |
| SubSector: SPAC | |
| MarketCap: 182 Millions | |
| Recent Price: 11.17 Smart Investing & Trading Score: 58 | |
| Day Percent Change: 0.81% Day Change: 0.09 | |
| Week Change: 0.45% Year-to-date Change: 4.1% | |
| BRKH Links: Profile News Message Board | |
| Charts:- Daily , Weekly | |
| Add BRKH to Watchlist: View: Get Complete BRKH Trend Analysis ➞ | |
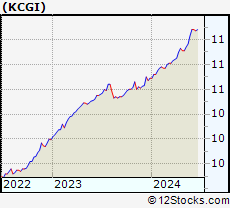 | KCGI Kensington Capital Acquisition Corp. V |
| Sector: Financials | |
| SubSector: SPAC | |
| MarketCap: 365 Millions | |
| Recent Price: 11.08 Smart Investing & Trading Score: 85 | |
| Day Percent Change: 0.34% Day Change: 0.04 | |
| Week Change: 0.45% Year-to-date Change: 3.7% | |
| KCGI Links: Profile News Message Board | |
| Charts:- Daily , Weekly | |
| Add KCGI to Watchlist: View: Get Complete KCGI Trend Analysis ➞ | |
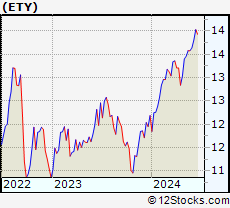 | ETY Eaton Vance Tax-Managed Diversified Equity Income Fund |
| Sector: Financials | |
| SubSector: Closed-End Fund - Equity | |
| MarketCap: 1228.97 Millions | |
| Recent Price: 13.64 Smart Investing & Trading Score: 95 | |
| Day Percent Change: 0.44% Day Change: 0.06 | |
| Week Change: 0.44% Year-to-date Change: 11.9% | |
| ETY Links: Profile News Message Board | |
| Charts:- Daily , Weekly | |
| Add ETY to Watchlist: View: Get Complete ETY Trend Analysis ➞ | |
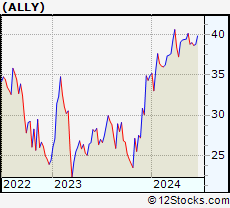 | ALLY Ally Financial Inc. |
| Sector: Financials | |
| SubSector: Mortgage Investment | |
| MarketCap: 4643.99 Millions | |
| Recent Price: 38.97 Smart Investing & Trading Score: 63 | |
| Day Percent Change: 1.75% Day Change: 0.67 | |
| Week Change: 0.44% Year-to-date Change: 11.6% | |
| ALLY Links: Profile News Message Board | |
| Charts:- Daily , Weekly | |
| Add ALLY to Watchlist: View: Get Complete ALLY Trend Analysis ➞ | |
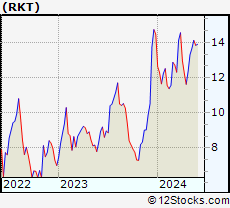 | RKT Rocket Companies, Inc. |
| Sector: Financials | |
| SubSector: Mortgage Finance | |
| MarketCap: 41287 Millions | |
| Recent Price: 13.90 Smart Investing & Trading Score: 74 | |
| Day Percent Change: 0.58% Day Change: 0.08 | |
| Week Change: 0.43% Year-to-date Change: -4.0% | |
| RKT Links: Profile News Message Board | |
| Charts:- Daily , Weekly | |
| Add RKT to Watchlist: View: Get Complete RKT Trend Analysis ➞ | |
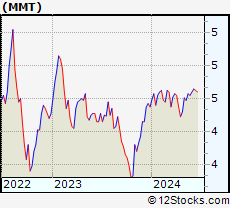 | MMT MFS Multimarket Income Trust |
| Sector: Financials | |
| SubSector: Closed-End Fund - Debt | |
| MarketCap: 279.807 Millions | |
| Recent Price: 4.64 Smart Investing & Trading Score: 70 | |
| Day Percent Change: 0.43% Day Change: 0.02 | |
| Week Change: 0.43% Year-to-date Change: 2.0% | |
| MMT Links: Profile News Message Board | |
| Charts:- Daily , Weekly | |
| Add MMT to Watchlist: View: Get Complete MMT Trend Analysis ➞ | |
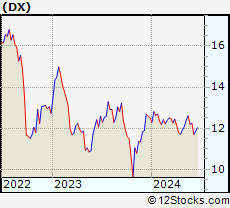 | DX Dynex Capital, Inc. |
| Sector: Financials | |
| SubSector: Mortgage Investment | |
| MarketCap: 327.839 Millions | |
| Recent Price: 12.25 Smart Investing & Trading Score: 55 | |
| Day Percent Change: 0.66% Day Change: 0.08 | |
| Week Change: 0.41% Year-to-date Change: -2.2% | |
| DX Links: Profile News Message Board | |
| Charts:- Daily , Weekly | |
| Add DX to Watchlist: View: Get Complete DX Trend Analysis ➞ | |
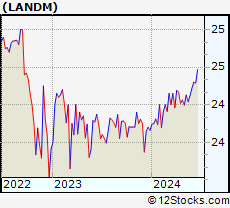 | LANDM Gladstone Land Corporation |
| Sector: Financials | |
| SubSector: REIT - Specialty | |
| MarketCap: 581 Millions | |
| Recent Price: 24.22 Smart Investing & Trading Score: 93 | |
| Day Percent Change: 0.54% Day Change: 0.13 | |
| Week Change: 0.41% Year-to-date Change: 2.4% | |
| LANDM Links: Profile News Message Board | |
| Charts:- Daily , Weekly | |
| Add LANDM to Watchlist: View: Get Complete LANDM Trend Analysis ➞ | |
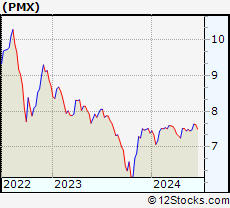 | PMX PIMCO Municipal Income Fund III |
| Sector: Financials | |
| SubSector: Closed-End Fund - Debt | |
| MarketCap: 309.807 Millions | |
| Recent Price: 7.48 Smart Investing & Trading Score: 52 | |
| Day Percent Change: 0.81% Day Change: 0.06 | |
| Week Change: 0.4% Year-to-date Change: 1.2% | |
| PMX Links: Profile News Message Board | |
| Charts:- Daily , Weekly | |
| Add PMX to Watchlist: View: Get Complete PMX Trend Analysis ➞ | |
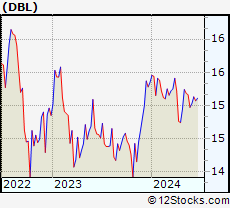 | DBL DoubleLine Opportunistic Credit Fund |
| Sector: Financials | |
| SubSector: Closed-End Fund - Debt | |
| MarketCap: 255.407 Millions | |
| Recent Price: 15.03 Smart Investing & Trading Score: 25 | |
| Day Percent Change: 0.57% Day Change: 0.08 | |
| Week Change: 0.4% Year-to-date Change: -2.1% | |
| DBL Links: Profile News Message Board | |
| Charts:- Daily , Weekly | |
| Add DBL to Watchlist: View: Get Complete DBL Trend Analysis ➞ | |
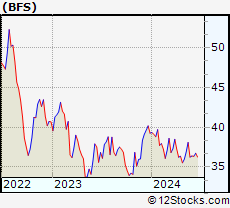 | BFS Saul Centers, Inc. |
| Sector: Financials | |
| SubSector: REIT - Retail | |
| MarketCap: 689.914 Millions | |
| Recent Price: 36.39 Smart Investing & Trading Score: 53 | |
| Day Percent Change: 1.17% Day Change: 0.42 | |
| Week Change: 0.39% Year-to-date Change: -7.3% | |
| BFS Links: Profile News Message Board | |
| Charts:- Daily , Weekly | |
| Add BFS to Watchlist: View: Get Complete BFS Trend Analysis ➞ | |
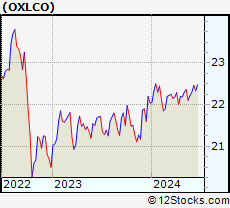 | OXLCO Oxford Lane Capital Corp. |
| Sector: Financials | |
| SubSector: Asset Management | |
| MarketCap: 718.003 Millions | |
| Recent Price: 22.31 Smart Investing & Trading Score: 55 | |
| Day Percent Change: 0.07% Day Change: 0.02 | |
| Week Change: 0.39% Year-to-date Change: 1.2% | |
| OXLCO Links: Profile News Message Board | |
| Charts:- Daily , Weekly | |
| Add OXLCO to Watchlist: View: Get Complete OXLCO Trend Analysis ➞ | |
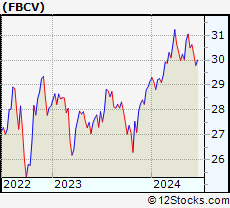 | FBCV Fidelity Blue Chip Value ETF |
| Sector: Financials | |
| SubSector: Exchange Traded Fund | |
| MarketCap: 60157 Millions | |
| Recent Price: 30.62 Smart Investing & Trading Score: 83 | |
| Day Percent Change: 1.96% Day Change: 0.59 | |
| Week Change: 0.39% Year-to-date Change: 5.0% | |
| FBCV Links: Profile News Message Board | |
| Charts:- Daily , Weekly | |
| Add FBCV to Watchlist: View: Get Complete FBCV Trend Analysis ➞ | |
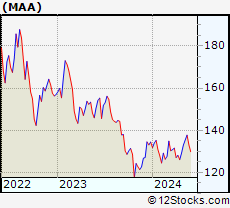 | MAA Mid-America Apartment Communities, Inc. |
| Sector: Financials | |
| SubSector: REIT - Residential | |
| MarketCap: 11385.5 Millions | |
| Recent Price: 133.71 Smart Investing & Trading Score: 68 | |
| Day Percent Change: 2.96% Day Change: 3.85 | |
| Week Change: 0.38% Year-to-date Change: -0.6% | |
| MAA Links: Profile News Message Board | |
| Charts:- Daily , Weekly | |
| Add MAA to Watchlist: View: Get Complete MAA Trend Analysis ➞ | |
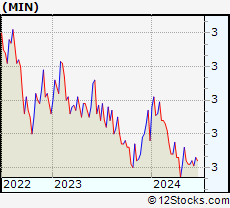 | MIN MFS Intermediate Income Trust |
| Sector: Financials | |
| SubSector: Closed-End Fund - Debt | |
| MarketCap: 395.107 Millions | |
| Recent Price: 2.62 Smart Investing & Trading Score: 42 | |
| Day Percent Change: 1.16% Day Change: 0.03 | |
| Week Change: 0.38% Year-to-date Change: -2.2% | |
| MIN Links: Profile News Message Board | |
| Charts:- Daily , Weekly | |
| Add MIN to Watchlist: View: Get Complete MIN Trend Analysis ➞ | |
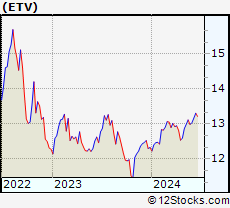 | ETV Eaton Vance Tax-Managed Buy-Write Opportunities Fund |
| Sector: Financials | |
| SubSector: Closed-End Fund - Equity | |
| MarketCap: 881.147 Millions | |
| Recent Price: 13.04 Smart Investing & Trading Score: 73 | |
| Day Percent Change: 1.24% Day Change: 0.16 | |
| Week Change: 0.38% Year-to-date Change: 5.8% | |
| ETV Links: Profile News Message Board | |
| Charts:- Daily , Weekly | |
| Add ETV to Watchlist: View: Get Complete ETV Trend Analysis ➞ | |
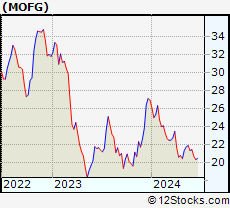 | MOFG MidWestOne Financial Group, Inc. |
| Sector: Financials | |
| SubSector: Regional - Southwest Banks | |
| MarketCap: 345.265 Millions | |
| Recent Price: 21.41 Smart Investing & Trading Score: 30 | |
| Day Percent Change: -0.74% Day Change: -0.16 | |
| Week Change: 0.38% Year-to-date Change: -20.4% | |
| MOFG Links: Profile News Message Board | |
| Charts:- Daily , Weekly | |
| Add MOFG to Watchlist: View: Get Complete MOFG Trend Analysis ➞ | |
| For tabular summary view of above stock list: Summary View ➞ 0 - 25 , 25 - 50 , 50 - 75 , 75 - 100 , 100 - 125 , 125 - 150 , 150 - 175 , 175 - 200 , 200 - 225 , 225 - 250 , 250 - 275 , 275 - 300 , 300 - 325 , 325 - 350 , 350 - 375 , 375 - 400 , 400 - 425 , 425 - 450 , 450 - 475 , 475 - 500 , 500 - 525 , 525 - 550 , 550 - 575 , 575 - 600 , 600 - 625 , 625 - 650 , 650 - 675 , 675 - 700 , 700 - 725 , 725 - 750 , 750 - 775 , 775 - 800 , 800 - 825 , 825 - 850 , 850 - 875 , 875 - 900 , 900 - 925 , 925 - 950 , 950 - 975 , 975 - 1000 , 1000 - 1025 , 1025 - 1050 , 1050 - 1075 , 1075 - 1100 , 1100 - 1125 , 1125 - 1150 , 1150 - 1175 , 1175 - 1200 , 1200 - 1225 | ||
| Click To Change The Sort Order: By Market Cap or Company Size Performance: Year-to-date, Week and Day | |
| Select Chart Type: | ||
|
Best Stocks Today 12Stocks.com |
© 2024 12Stocks.com Terms & Conditions Privacy Contact Us
All Information Provided Only For Education And Not To Be Used For Investing or Trading. See Terms & Conditions


One More Thing ... Get Best Stocks Delivered Daily!
Never Ever Miss A Move With Our Top Ten Stocks Lists
Find Best Stocks In Any Market - Bull or Bear Market
Take A Peek At Our Top Ten Stocks Lists: Daily, Weekly, Year-to-Date & Top Trends
Find Best Stocks In Any Market - Bull or Bear Market
Take A Peek At Our Top Ten Stocks Lists: Daily, Weekly, Year-to-Date & Top Trends
Financial Stocks With Best Up Trends [0-bearish to 100-bullish]: X [100], Brighthouse [100], Central and[100], Northrim BanCorp[100], Bank of America[100], Hagerty [100], Urban Edge[100], Global Blockchain[100], Ventas [100], Omega Healthcare[100], LPL [100]
Best Financial Stocks Year-to-Date:
Root [385.58%], Chimera [138.48%], Banco Macro[130.98%], SelectQuote [127.74%], Gladstone Capital[109.35%], Grupo Financiero[107.65%], Banco BBVA[107.54%], EverQuote [95.18%], Hippo [93.63%], Grupo Supervielle[78.33%], Vista Oil[64.18%] Best Financial Stocks This Week:
C3.ai [23%], Investors Title[19.4%], Banco BBVA[14.74%], Riverview Bancorp[14.25%], Banco Macro[13.7%], IRSA Inversiones[12.15%], Grupo Supervielle[11.73%], Metals Acquisition[10.74%], Grupo Financiero[10.41%], Fathom [10.24%], Vista Oil[9.32%] Best Financial Stocks Daily:
Riverview Bancorp[15.75%], Allied World[14.88%], Medical Properties[7.20%], X [6.14%], Franklin Street[5.32%], Washington Federal[5.16%], Iris Energy[5.13%], Ameris Bancorp[4.80%], Brighthouse [4.79%], Auburn National[4.70%], Central and[4.63%]