
 Login Sign Up


| |||||
 |  | ||||

| 12Stocks.com Market Intelligence |
Best Tech Stocks
| In a hurry? Tech Stocks Lists: Performance & Trends, Stock Charts, FANG Stocks
Sort Tech stocks: Daily, Weekly, Year-to-Date, Market Cap & Trends. Filter Tech stocks list by size:All Tech Large Mid-Range Small and MicroCap |
| 12Stocks.com Tech Stocks Performances & Trends Daily | |||||||||
|
|  The overall Smart Investing & Trading Score is 10 (0-bearish to 100-bullish) which puts Technology sector in short term bearish trend. The Smart Investing & Trading Score from previous trading session is 0 and hence an improvement of trend.
| ||||||||
Here are the Smart Investing & Trading Scores of the most requested Technology stocks at 12Stocks.com (click stock name for detailed review):
|


| 12Stocks.com: Investing in Technology sector with Stocks | |
|
The following table helps investors and traders sort through current performance and trends (as measured by Smart Investing & Trading Score) of various
stocks in the Tech sector. Quick View: Move mouse or cursor over stock symbol (ticker) to view short-term technical chart and over stock name to view long term chart. Click on  to add stock symbol to your watchlist and to add stock symbol to your watchlist and  to view watchlist. Click on any ticker or stock name for detailed market intelligence report for that stock. to view watchlist. Click on any ticker or stock name for detailed market intelligence report for that stock. |
12Stocks.com Performance of Stocks in Tech Sector
| Ticker | Stock Name | Watchlist | Category | Recent Price | Smart Investing & Trading Score | Change % | YTD Change% |
| GDS | GDS |   | Data Storage | 8.62 | 95 | 2.32% | -5.54% |
| WMG | Warner Music | | Entertainment | 33.70 | 64 | 0.82% | -5.87% |
| EA | Electronic Arts | | Software | 127.37 | 44 | -0.63% | -6.90% |
| DCBO | Docebo | | Software | 45.01 | 22 | -0.18% | -7.02% |
| CSCO | Cisco Systems | | Communication | 46.78 | 0 | -0.13% | -7.40% |
| HPQ | HP | | Computer | 27.80 | 10 | 0.18% | -7.61% |
| WDAY | Workday | | Software | 254.76 | 42 | 4.00% | -7.72% |
| BIDU | Baidu | | Internet | 109.46 | 100 | 4.92% | -8.09% |
| KEYS | Keysight | | Instruments | 145.97 | 17 | 0.70% | -8.25% |
| SHOP | Shopify | | Software | 71.28 | 42 | 1.24% | -8.50% |
| LBTYA | Liberty Global | | CATV | 16.25 | 35 | -0.09% | -8.53% |
| INFY | Infosys | | IT | 16.79 | 20 | 0.12% | -8.65% |
| TU | TELUS | | Wireless | 16.14 | 57 | -0.55% | -9.27% |
| KC | Kingsoft Cloud | | Software | 3.43 | 95 | 9.94% | -9.38% |
| NCNO | nCino | | Software | 30.44 | 65 | 1.40% | -9.49% |
| AAPL | Apple | | Electronic | 171.87 | 27 | 1.52% | -10.73% |
| FDS | FactSet Research | | IT | 424.99 | 42 | 1.29% | -10.91% |
| RNG | RingCentral | | Software | 30.23 | 22 | 0.50% | -10.96% |
| SQ | Square | | Internet | 68.82 | 0 | 2.96% | -11.03% |
| ZI | ZoomInfo | | Software | 16.37 | 67 | 0.06% | -11.47% |
| TTWO | Take-Two Interactive | | Software | 141.78 | 17 | -0.67% | -11.91% |
| CTSH | Cognizant | | IT | 66.37 | 35 | 1.53% | -12.13% |
| VIV | Telefonica Brasil | | Wireless | 9.50 | 49 | 2.04% | -13.16% |
| ADSK | Autodesk | | Software | 211.10 | 10 | 0.18% | -13.30% |
| ANSS | ANSYS | | Software | 314.54 | 0 | -2.16% | -13.32% |
| For chart view version of above stock list: Chart View ➞ 0 - 25 , 25 - 50 , 50 - 75 , 75 - 100 , 100 - 125 , 125 - 150 , 150 - 175 | ||
 | Click To Change The Sort Order: By Market Cap or Company Size Performance: Year-to-date, Week and Day |  |
|
Get the most comprehensive stock market coverage daily at 12Stocks.com ➞ Best Stocks Today ➞ Best Stocks Weekly ➞ Best Stocks Year-to-Date ➞ Best Stocks Trends ➞  Best Stocks Today 12Stocks.com Best Nasdaq Stocks ➞ Best S&P 500 Stocks ➞ Best Tech Stocks ➞ Best Biotech Stocks ➞ |
| Detailed Overview of Tech Stocks |
| Tech Technical Overview, Leaders & Laggards, Top Tech ETF Funds & Detailed Tech Stocks List, Charts, Trends & More |
| Tech Sector: Technical Analysis, Trends & YTD Performance | |
| Technology sector is composed of stocks
from semiconductors, software, web, social media
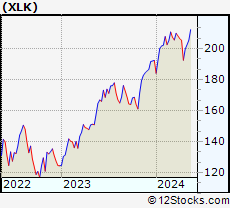
and services subsectors. Technology sector, as represented by XLK, an exchange-traded fund [ETF] that holds basket of tech stocks (e.g, Intel, Google) is up by 1.93% and is currently underperforming the overall market by -3.22% year-to-date. Below is a quick view of technical charts and trends: |
|
 XLK Weekly Chart |
|
| Long Term Trend: Not Good | |
| Medium Term Trend: Not Good | |
 XLK Daily Chart |
|
| Short Term Trend: Deteriorating | |
| Overall Trend Score: 10 | |
| YTD Performance: 1.93% | |
| **Trend Scores & Views Are Only For Educational Purposes And Not For Investing | |
| 12Stocks.com: Top Performing Technology Sector Stocks | ||||||||||||||||||||||||||||||||||||||||||||||||
 The top performing Technology sector stocks year to date are
Now, more recently, over last week, the top performing Technology sector stocks on the move are


|
||||||||||||||||||||||||||||||||||||||||||||||||
| 12Stocks.com: Investing in Tech Sector using Exchange Traded Funds | |
|
The following table shows list of key exchange traded funds (ETF) that
help investors track Tech Index. For detailed view, check out our ETF Funds section of our website. Quick View: Move mouse or cursor over ETF symbol (ticker) to view short-term technical chart and over ETF name to view long term chart. Click on ticker or stock name for detailed view. Click on to add stock symbol to your watchlist and to view watchlist. |
12Stocks.com List of ETFs that track Tech Index
| Ticker | ETF Name | Watchlist | Recent Price | Smart Investing & Trading Score | Change % | Week % | Year-to-date % |
| XLK | Technology | | 196.19 | 10 | 0.99 | -1.82 | 1.93% |
| QQQ | QQQ | | 424.79 | 17 | 0.78 | -1.44 | 3.73% |
| VGT | Information Technology | | 493.70 | 17 | 0.89 | -2.03 | 2.01% |
| IGV | Tech-Software | | 79.72 | 10 | 0.82 | -1.7 | -1.74% |
| TQQQ | QQQ | | 52.73 | 17 | 2.19 | -4.61 | 4% |
| SQQQ | Short QQQ | | 11.97 | 78 | -2.05 | 4.72 | -11% |
| SOXL | Semicondct Bull 3X | | 35.90 | 7 | 4.45 | -9.69 | 14.33% |
| SOXS | Semicondct Bear 3X | | 38.45 | 66 | -4.42 | 9.54 | 560.65% |
| SOXX | PHLX Semiconductor | | 210.11 | 7 | 1.62 | -3.13 | 9.41% |
| SMH | Semiconductor | | 210.85 | 30 | 1.44 | -3.12 | 20.58% |
| 12Stocks.com: Charts, Trends, Fundamental Data and Performances of Tech Stocks | |
|
We now take in-depth look at all Tech stocks including charts, multi-period performances and overall trends (as measured by Smart Investing & Trading Score). One can sort Tech stocks (click link to choose) by Daily, Weekly and by Year-to-Date performances. Also, one can sort by size of the company or by market capitalization. |
| Select Your Default Chart Type: | |||||
| |||||
| Click on stock symbol or name for detailed view. Click on to add stock symbol to your watchlist and to view watchlist. Quick View: Move mouse or cursor over "Daily" to quickly view daily technical stock chart and over "Weekly" to view weekly technical stock chart. | |||||


 | GDS GDS Holdings Limited |
| Sector: Technology | |
| SubSector: Data Storage Devices | |
| MarketCap: 8597.99 Millions | |
| Recent Price: 8.62 Smart Investing & Trading Score: 95 | |
| Day Percent Change: 2.32% Day Change: 0.20 | |
| Week Change: 11.02% Year-to-date Change: -5.5% | |
| GDS Links: Profile News Message Board | |
| Charts:- Daily , Weekly | |
| Add GDS to Watchlist: View: Get Complete GDS Trend Analysis ➞ | |
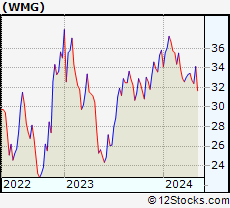 | WMG Warner Music Group Corp. |
| Sector: Technology | |
| SubSector: Entertainment | |
| MarketCap: 17237 Millions | |
| Recent Price: 33.70 Smart Investing & Trading Score: 64 | |
| Day Percent Change: 0.82% Day Change: 0.27 | |
| Week Change: 4.03% Year-to-date Change: -5.9% | |
| WMG Links: Profile News Message Board | |
| Charts:- Daily , Weekly | |
| Add WMG to Watchlist: View: Get Complete WMG Trend Analysis ➞ | |
 | EA Electronic Arts Inc. |
| Sector: Technology | |
| SubSector: Multimedia & Graphics Software | |
| MarketCap: 27296.5 Millions | |
| Recent Price: 127.37 Smart Investing & Trading Score: 44 | |
| Day Percent Change: -0.63% Day Change: -0.81 | |
| Week Change: -0.41% Year-to-date Change: -6.9% | |
| EA Links: Profile News Message Board | |
| Charts:- Daily , Weekly | |
| Add EA to Watchlist: View: Get Complete EA Trend Analysis ➞ | |
 | DCBO Docebo Inc. |
| Sector: Technology | |
| SubSector: Software Application | |
| MarketCap: 15787 Millions | |
| Recent Price: 45.01 Smart Investing & Trading Score: 22 | |
| Day Percent Change: -0.18% Day Change: -0.08 | |
| Week Change: 0.65% Year-to-date Change: -7.0% | |
| DCBO Links: Profile News Message Board | |
| Charts:- Daily , Weekly | |
| Add DCBO to Watchlist: View: Get Complete DCBO Trend Analysis ➞ | |
 | CSCO Cisco Systems, Inc. |
| Sector: Technology | |
| SubSector: Communication Equipment | |
| MarketCap: 168483 Millions | |
| Recent Price: 46.78 Smart Investing & Trading Score: 0 | |
| Day Percent Change: -0.13% Day Change: -0.06 | |
| Week Change: -2.26% Year-to-date Change: -7.4% | |
| CSCO Links: Profile News Message Board | |
| Charts:- Daily , Weekly | |
| Add CSCO to Watchlist: View: Get Complete CSCO Trend Analysis ➞ | |
 | HPQ HP Inc. |
| Sector: Technology | |
| SubSector: Diversified Computer Systems | |
| MarketCap: 22107.8 Millions | |
| Recent Price: 27.80 Smart Investing & Trading Score: 10 | |
| Day Percent Change: 0.18% Day Change: 0.05 | |
| Week Change: -0.71% Year-to-date Change: -7.6% | |
| HPQ Links: Profile News Message Board | |
| Charts:- Daily , Weekly | |
| Add HPQ to Watchlist: View: Get Complete HPQ Trend Analysis ➞ | |
 | WDAY Workday, Inc. |
| Sector: Technology | |
| SubSector: Application Software | |
| MarketCap: 31372.1 Millions | |
| Recent Price: 254.76 Smart Investing & Trading Score: 42 | |
| Day Percent Change: 4.00% Day Change: 9.79 | |
| Week Change: 1.48% Year-to-date Change: -7.7% | |
| WDAY Links: Profile News Message Board | |
| Charts:- Daily , Weekly | |
| Add WDAY to Watchlist: View: Get Complete WDAY Trend Analysis ➞ | |
 | BIDU Baidu, Inc. |
| Sector: Technology | |
| SubSector: Internet Information Providers | |
| MarketCap: 33525.9 Millions | |
| Recent Price: 109.46 Smart Investing & Trading Score: 100 | |
| Day Percent Change: 4.92% Day Change: 5.14 | |
| Week Change: 8.89% Year-to-date Change: -8.1% | |
| BIDU Links: Profile News Message Board | |
| Charts:- Daily , Weekly | |
| Add BIDU to Watchlist: View: Get Complete BIDU Trend Analysis ➞ | |
 | KEYS Keysight Technologies, Inc. |
| Sector: Technology | |
| SubSector: Scientific & Technical Instruments | |
| MarketCap: 17355.1 Millions | |
| Recent Price: 145.97 Smart Investing & Trading Score: 17 | |
| Day Percent Change: 0.70% Day Change: 1.02 | |
| Week Change: -1.74% Year-to-date Change: -8.3% | |
| KEYS Links: Profile News Message Board | |
| Charts:- Daily , Weekly | |
| Add KEYS to Watchlist: View: Get Complete KEYS Trend Analysis ➞ | |
 | SHOP Shopify Inc. |
| Sector: Technology | |
| SubSector: Application Software | |
| MarketCap: 45164.2 Millions | |
| Recent Price: 71.28 Smart Investing & Trading Score: 42 | |
| Day Percent Change: 1.24% Day Change: 0.88 | |
| Week Change: -0.08% Year-to-date Change: -8.5% | |
| SHOP Links: Profile News Message Board | |
| Charts:- Daily , Weekly | |
| Add SHOP to Watchlist: View: Get Complete SHOP Trend Analysis ➞ | |
 | LBTYA Liberty Global plc |
| Sector: Technology | |
| SubSector: CATV Systems | |
| MarketCap: 11723.7 Millions | |
| Recent Price: 16.25 Smart Investing & Trading Score: 35 | |
| Day Percent Change: -0.09% Day Change: -0.02 | |
| Week Change: -0.58% Year-to-date Change: -8.5% | |
| LBTYA Links: Profile News Message Board | |
| Charts:- Daily , Weekly | |
| Add LBTYA to Watchlist: View: Get Complete LBTYA Trend Analysis ➞ | |
 | INFY Infosys Limited |
| Sector: Technology | |
| SubSector: Information Technology Services | |
| MarketCap: 33819.1 Millions | |
| Recent Price: 16.79 Smart Investing & Trading Score: 20 | |
| Day Percent Change: 0.12% Day Change: 0.02 | |
| Week Change: -0.89% Year-to-date Change: -8.7% | |
| INFY Links: Profile News Message Board | |
| Charts:- Daily , Weekly | |
| Add INFY to Watchlist: View: Get Complete INFY Trend Analysis ➞ | |
 | TU TELUS Corporation |
| Sector: Technology | |
| SubSector: Wireless Communications | |
| MarketCap: 10864.7 Millions | |
| Recent Price: 16.14 Smart Investing & Trading Score: 57 | |
| Day Percent Change: -0.55% Day Change: -0.09 | |
| Week Change: 0.44% Year-to-date Change: -9.3% | |
| TU Links: Profile News Message Board | |
| Charts:- Daily , Weekly | |
| Add TU to Watchlist: View: Get Complete TU Trend Analysis ➞ | |
 | KC Kingsoft Cloud Holdings Limited |
| Sector: Technology | |
| SubSector: Software Application | |
| MarketCap: 98487 Millions | |
| Recent Price: 3.43 Smart Investing & Trading Score: 95 | |
| Day Percent Change: 9.94% Day Change: 0.31 | |
| Week Change: 8.54% Year-to-date Change: -9.4% | |
| KC Links: Profile News Message Board | |
| Charts:- Daily , Weekly | |
| Add KC to Watchlist: View: Get Complete KC Trend Analysis ➞ | |
 | NCNO nCino, Inc. |
| Sector: Technology | |
| SubSector: Software Application | |
| MarketCap: 74187 Millions | |
| Recent Price: 30.44 Smart Investing & Trading Score: 65 | |
| Day Percent Change: 1.40% Day Change: 0.42 | |
| Week Change: 3.15% Year-to-date Change: -9.5% | |
| NCNO Links: Profile News Message Board | |
| Charts:- Daily , Weekly | |
| Add NCNO to Watchlist: View: Get Complete NCNO Trend Analysis ➞ | |
 | AAPL Apple Inc. |
| Sector: Technology | |
| SubSector: Electronic Equipment | |
| MarketCap: 1112940 Millions | |
| Recent Price: 171.87 Smart Investing & Trading Score: 27 | |
| Day Percent Change: 1.52% Day Change: 2.56 | |
| Week Change: 1.52% Year-to-date Change: -10.7% | |
| AAPL Links: Profile News Message Board | |
| Charts:- Daily , Weekly | |
| Add AAPL to Watchlist: View: Get Complete AAPL Trend Analysis ➞ | |
 | FDS FactSet Research Systems Inc. |
| Sector: Technology | |
| SubSector: Information & Delivery Services | |
| MarketCap: 9024.37 Millions | |
| Recent Price: 424.99 Smart Investing & Trading Score: 42 | |
| Day Percent Change: 1.29% Day Change: 5.42 | |
| Week Change: 0.83% Year-to-date Change: -10.9% | |
| FDS Links: Profile News Message Board | |
| Charts:- Daily , Weekly | |
| Add FDS to Watchlist: View: Get Complete FDS Trend Analysis ➞ | |
 | RNG RingCentral, Inc. |
| Sector: Technology | |
| SubSector: Application Software | |
| MarketCap: 17755.3 Millions | |
| Recent Price: 30.23 Smart Investing & Trading Score: 22 | |
| Day Percent Change: 0.50% Day Change: 0.15 | |
| Week Change: -1.34% Year-to-date Change: -11.0% | |
| RNG Links: Profile News Message Board | |
| Charts:- Daily , Weekly | |
| Add RNG to Watchlist: View: Get Complete RNG Trend Analysis ➞ | |
 | SQ Square, Inc. |
| Sector: Technology | |
| SubSector: Internet Software & Services | |
| MarketCap: 19323.1 Millions | |
| Recent Price: 68.82 Smart Investing & Trading Score: 0 | |
| Day Percent Change: 2.96% Day Change: 1.98 | |
| Week Change: -7.6% Year-to-date Change: -11.0% | |
| SQ Links: Profile News Message Board | |
| Charts:- Daily , Weekly | |
| Add SQ to Watchlist: View: Get Complete SQ Trend Analysis ➞ | |
 | ZI ZoomInfo Technologies Inc. |
| Sector: Technology | |
| SubSector: Software Application | |
| MarketCap: 15937 Millions | |
| Recent Price: 16.37 Smart Investing & Trading Score: 67 | |
| Day Percent Change: 0.06% Day Change: 0.01 | |
| Week Change: 0% Year-to-date Change: -11.5% | |
| ZI Links: Profile News Message Board | |
| Charts:- Daily , Weekly | |
| Add ZI to Watchlist: View: Get Complete ZI Trend Analysis ➞ | |
 | TTWO Take-Two Interactive Software, Inc. |
| Sector: Technology | |
| SubSector: Multimedia & Graphics Software | |
| MarketCap: 12479.6 Millions | |
| Recent Price: 141.78 Smart Investing & Trading Score: 17 | |
| Day Percent Change: -0.67% Day Change: -0.96 | |
| Week Change: -1.86% Year-to-date Change: -11.9% | |
| TTWO Links: Profile News Message Board | |
| Charts:- Daily , Weekly | |
| Add TTWO to Watchlist: View: Get Complete TTWO Trend Analysis ➞ | |
 | CTSH Cognizant Technology Solutions Corporation |
| Sector: Technology | |
| SubSector: Information Technology Services | |
| MarketCap: 26249.7 Millions | |
| Recent Price: 66.37 Smart Investing & Trading Score: 35 | |
| Day Percent Change: 1.53% Day Change: 1.00 | |
| Week Change: -0.85% Year-to-date Change: -12.1% | |
| CTSH Links: Profile News Message Board | |
| Charts:- Daily , Weekly | |
| Add CTSH to Watchlist: View: Get Complete CTSH Trend Analysis ➞ | |
 | VIV Telefonica Brasil S.A. |
| Sector: Technology | |
| SubSector: Wireless Communications | |
| MarketCap: 19611.1 Millions | |
| Recent Price: 9.50 Smart Investing & Trading Score: 49 | |
| Day Percent Change: 2.04% Day Change: 0.19 | |
| Week Change: 0.96% Year-to-date Change: -13.2% | |
| VIV Links: Profile News Message Board | |
| Charts:- Daily , Weekly | |
| Add VIV to Watchlist: View: Get Complete VIV Trend Analysis ➞ | |
 | ADSK Autodesk, Inc. |
| Sector: Technology | |
| SubSector: Technical & System Software | |
| MarketCap: 36975.8 Millions | |
| Recent Price: 211.10 Smart Investing & Trading Score: 10 | |
| Day Percent Change: 0.18% Day Change: 0.38 | |
| Week Change: -3.14% Year-to-date Change: -13.3% | |
| ADSK Links: Profile News Message Board | |
| Charts:- Daily , Weekly | |
| Add ADSK to Watchlist: View: Get Complete ADSK Trend Analysis ➞ | |
 | ANSS ANSYS, Inc. |
| Sector: Technology | |
| SubSector: Application Software | |
| MarketCap: 19497.4 Millions | |
| Recent Price: 314.54 Smart Investing & Trading Score: 0 | |
| Day Percent Change: -2.16% Day Change: -6.94 | |
| Week Change: -5.76% Year-to-date Change: -13.3% | |
| ANSS Links: Profile News Message Board | |
| Charts:- Daily , Weekly | |
| Add ANSS to Watchlist: View: Get Complete ANSS Trend Analysis ➞ | |
| For tabular summary view of above stock list: Summary View ➞ 0 - 25 , 25 - 50 , 50 - 75 , 75 - 100 , 100 - 125 , 125 - 150 , 150 - 175 | ||
| Click To Change The Sort Order: By Market Cap or Company Size Performance: Year-to-date, Week and Day | |
| Select Chart Type: | ||
|
Best Stocks Today 12Stocks.com |
© 2024 12Stocks.com Terms & Conditions Privacy Contact Us
All Information Provided Only For Education And Not To Be Used For Investing or Trading. See Terms & Conditions


One More Thing ... Get Best Stocks Delivered Daily!
Never Ever Miss A Move With Our Top Ten Stocks Lists
Find Best Stocks In Any Market - Bull or Bear Market
Take A Peek At Our Top Ten Stocks Lists: Daily, Weekly, Year-to-Date & Top Trends
Find Best Stocks In Any Market - Bull or Bear Market
Take A Peek At Our Top Ten Stocks Lists: Daily, Weekly, Year-to-Date & Top Trends
Technology Stocks With Best Up Trends [0-bearish to 100-bullish]: Benchmark Electronics[100], FormFactor [100], TTM [100], MediaAlpha [100], Q2 [100], QUALCOMM [100], QuinStreet [100], 21Vianet [100], JD.com [100], Itron [100], Cognex [100]
Best Technology Stocks Year-to-Date:
MediaCo Holding[364.79%], Smith Micro[191.77%], Bakkt [187.89%], Uxin [183.88%], CXApp [168.73%], Super Micro[161.15%], SoundHound AI[113.32%], MediaAlpha [111.6%], NextNav [108.76%], CuriosityStream [107.37%], GigaCloud [81.29%] Best Technology Stocks This Week:
Bakkt [1506.2%], SYLA [67.53%], Koninklijke Philips[26.41%], Mitcham Industries[24.94%], MediaAlpha [24.76%], Phoenix New[21.71%], Cogint [19.6%], 21Vianet [18.67%], Harmonic [18.37%], Quantum [15.48%], Garmin [14.63%] Best Technology Stocks Daily:
Benchmark Electronics[17.40%], FormFactor [13.73%], CommScope Holding[12.75%], TTM [12.32%], MediaAlpha [11.73%], Alkami [11.21%], Q2 [10.36%], QUALCOMM [10.01%], Kingsoft Cloud[9.94%], Clearwater Analytics[8.72%], Xiao-I [8.57%]