
 Login Sign Up


| |||||
 |  | ||||

| 12Stocks.com Market Intelligence |
Best SmallCap Stocks
|
| In a hurry? Small Cap Stock Lists: Performance Trends Table, Stock Charts
Sort Small Cap stocks: Daily, Weekly, Year-to-Date, Market Cap & Trends. Filter Small Cap stocks list by sector: Show all, Tech, Finance, Energy, Staples, Retail, Industrial, Materials, Utilities and HealthCare Filter Small Cap stocks list by size: All Large Medium Small and MicroCap |
| 12Stocks.com Small Cap Stocks Performances & Trends Daily | |||||||||
|
|  The overall Smart Investing & Trading Score is 56 (0-bearish to 100-bullish) which puts Small Cap index in short term neutral trend. The Smart Investing & Trading Score from previous trading session is 44 and hence an improvement of trend.
| ||||||||
Here are the Smart Investing & Trading Scores of the most requested small cap stocks at 12Stocks.com (click stock name for detailed review):
|


| 12Stocks.com: Investing in Smallcap Index with Stocks | |
|
The following table helps investors and traders sort through current performance and trends (as measured by Smart Investing & Trading Score) of various
stocks in the Smallcap Index. Quick View: Move mouse or cursor over stock symbol (ticker) to view short-term technical chart and over stock name to view long term chart. Click on  to add stock symbol to your watchlist and to add stock symbol to your watchlist and  to view watchlist. Click on any ticker or stock name for detailed market intelligence report for that stock. to view watchlist. Click on any ticker or stock name for detailed market intelligence report for that stock. |
12Stocks.com Performance of Stocks in Smallcap Index
| Ticker | Stock Name | Watchlist | Category | Recent Price | Smart Investing & Trading Score | Change % | YTD Change% |
| PNRG | PrimeEnergy Resources |   | Energy | 101.97 | 41 | -0.49% | -4.12% |
| WISH | ContextLogic | | Services & Goods | 5.70 | 71 | -0.18% | -4.12% |
| ARR | ARMOUR Residential | | Financials | 18.52 | 42 | 1.70% | -4.14% |
| NTST | NetSTREIT | | Financials | 17.12 | 59 | 0.20% | -4.14% |
| TTMI | TTM | | Technology | 15.13 | 93 | 2.37% | -4.30% |
| BLMN | Bloomin | | Services & Goods | 26.93 | 58 | -0.22% | -4.33% |
| SNBR | Sleep Number | | Consumer Staples | 14.18 | 68 | -0.35% | -4.38% |
| LADR | Ladder Capital | | Financials | 11.00 | 42 | 1.85% | -4.43% |
| ENFN | Enfusion | | Technology | 9.42 | 61 | 0.00% | -4.44% |
| PRA | ProAssurance | | Financials | 13.17 | 42 | -3.52% | -4.50% |
| OB | Outbrain | | Services & Goods | 4.18 | 75 | 2.70% | -4.57% |
| SGMO | Sangamo | | Health Care | 0.52 | 51 | 2.94% | -4.69% |
| LPG | Dorian LPG | | Transports | 41.78 | 95 | 1.21% | -4.76% |
| MFA | MFA Financial | | Financials | 10.73 | 35 | 1.80% | -4.79% |
| DX | Dynex Capital | | Financials | 11.92 | 44 | 2.23% | -4.79% |
| ATRO | Astronics | | Industrials | 16.58 | 32 | 2.85% | -4.82% |
| EXLS | ExlService | | Technology | 29.36 | 42 | 0.17% | -4.83% |
| NBN | Northeast Bank | | Financials | 52.51 | 42 | 1.39% | -4.86% |
| INVA | Innoviva | | Health Care | 15.26 | 64 | 1.80% | -4.86% |
| ESRT | Empire State | | Financials | 9.21 | 42 | 0.99% | -4.95% |
| FFBC | First Financial | | Financials | 22.57 | 87 | 0.94% | -4.97% |
| UTL | Unitil | | Utilities | 49.94 | 78 | -1.09% | -5.00% |
| MYGN | Myriad Genetics | | Services & Goods | 18.18 | 17 | 1.11% | -5.02% |
| APAM | Artisan Partners | | Financials | 41.96 | 20 | 2.24% | -5.02% |
| HTLF | Heartland Financial | | Financials | 35.72 | 93 | 0.68% | -5.03% |


| Too many stocks? View smallcap stocks filtered by marketcap & sector |
| Marketcap: All SmallCap Stocks (default-no microcap), Large, Mid-Range, Small |
| Smallcap Sector: Tech, Finance, Energy, Staples, Retail, Industrial, Materials, & Medical |
|
Get the most comprehensive stock market coverage daily at 12Stocks.com ➞ Best Stocks Today ➞ Best Stocks Weekly ➞ Best Stocks Year-to-Date ➞ Best Stocks Trends ➞  Best Stocks Today 12Stocks.com Best Nasdaq Stocks ➞ Best S&P 500 Stocks ➞ Best Tech Stocks ➞ Best Biotech Stocks ➞ |
| Detailed Overview of SmallCap Stocks |
| SmallCap Technical Overview, Leaders & Laggards, Top SmallCap ETF Funds & Detailed SmallCap Stocks List, Charts, Trends & More |
| Smallcap: Technical Analysis, Trends & YTD Performance | |
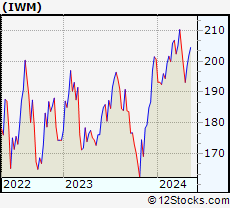
| SmallCap segment as represented by
IWM, an exchange-traded fund [ETF], holds basket of thousands of smallcap stocks from across all major sectors of the US stock market. The smallcap index (contains stocks like Riverbed & Sotheby's) is down by -1.16% and is currently underperforming the overall market by -7.3% year-to-date. Below is a quick view of technical charts and trends: | |
 IWM Weekly Chart |
|
| Long Term Trend: Good | |
| Medium Term Trend: Not Good | |
 IWM Daily Chart |
|
| Short Term Trend: Very Good | |
| Overall Trend Score: 56 | |
| YTD Performance: -1.16% | |
| **Trend Scores & Views Are Only For Educational Purposes And Not For Investing | |
| 12Stocks.com: Top Performing Small Cap Index Stocks | ||||||||||||||||||||||||||||||||||||||||||||||||
 The top performing Small Cap Index stocks year to date are
Now, more recently, over last week, the top performing Small Cap Index stocks on the move are


|
||||||||||||||||||||||||||||||||||||||||||||||||
| 12Stocks.com: Investing in Smallcap Index using Exchange Traded Funds | |
|
The following table shows list of key exchange traded funds (ETF) that
help investors track Smallcap index. The following list also includes leveraged ETF funds that track twice or thrice the daily returns of Smallcap indices. Short or inverse ETF funds move in the opposite direction to the index they track and are useful during market pullbacks or during bear markets. Quick View: Move mouse or cursor over ETF symbol (ticker) to view short-term technical chart and over ETF name to view long term chart. Click on ticker or stock name for detailed view. Click on to add stock symbol to your watchlist and to view watchlist. |
12Stocks.com List of ETFs that track Smallcap Index
| Ticker | ETF Name | Watchlist | Recent Price | Smart Investing & Trading Score | Change % | Week % | Year-to-date % |
| IWM | iShares Russell 2000 | | 198.39 | 56 | 0.97 | 2.72 | -1.16% |
| IJR | iShares Core S&P Small-Cap | | 105.65 | 85 | 0.75 | 2.35 | -2.4% |
| VTWO | Vanguard Russell 2000 ETF | | 80.22 | 70 | 0.97 | 2.74 | -1.09% |
| IWN | iShares Russell 2000 Value | | 151.14 | 75 | 0.64 | 2.27 | -2.7% |
| IWO | iShares Russell 2000 Growth | | 253.09 | 58 | 1.29 | 3.18 | 0.34% |
| IJS | iShares S&P Small-Cap 600 Value | | 97.19 | 67 | 0.52 | 1.65 | -5.7% |
| IJT | iShares S&P Small-Cap 600 Growth | | 126.09 | 70 | 0.82 | 3.17 | 0.76% |
| XSLV | PowerShares S&P SmallCap Low Volatil ETF | | 42.72 | 80 | 0.42 | 1.28 | -3.24% |
| SAA | ProShares Ultra SmallCap600 | | 23.04 | 65 | 1.68 | 5.69 | -7.66% |
| SBB | ProShares Short SmallCap600 | | 16.39 | 33 | -0.70 | -2.7 | 2.86% |
| SDD | ProShares UltraShort SmallCap600 | | 19.35 | 35 | -1.17 | -4.87 | 5.01% |
| SMLV | SPDR SSGA US Small Cap Low Volatil ETF | | 107.52 | 80 | 0.18 | 1.35 | -4.44% |
| 12Stocks.com: Charts, Trends, Fundamental Data and Performances of SmallCap Stocks | |
|
We now take in-depth look at all SmallCap stocks including charts, multi-period performances and overall trends (as measured by Smart Investing & Trading Score). One can sort SmallCap stocks (click link to choose) by Daily, Weekly and by Year-to-Date performances. Also, one can sort by size of the company or by market capitalization. |
| Select Your Default Chart Type: | |||||
| |||||
| Click on stock symbol or name for detailed view. Click on to add stock symbol to your watchlist and to view watchlist. Quick View: Move mouse or cursor over "Daily" to quickly view daily technical stock chart and over "Weekly" to view weekly technical stock chart. | |||||

 | PNRG PrimeEnergy Resources Corporation |
| Sector: Energy | |
| SubSector: Independent Oil & Gas | |
| MarketCap: 112.593 Millions | |
| Recent Price: 101.97 Smart Investing & Trading Score: 41 | |
| Day Percent Change: -0.49% Day Change: -0.50 | |
| Week Change: 0.92% Year-to-date Change: -4.1% | |
| PNRG Links: Profile News Message Board | |
| Charts:- Daily , Weekly | |
| Add PNRG to Watchlist: View: Get Complete PNRG Trend Analysis ➞ | |
 | WISH ContextLogic Inc. |
| Sector: Services & Goods | |
| SubSector: Internet Retail | |
| MarketCap: 165 Millions | |
| Recent Price: 5.70 Smart Investing & Trading Score: 71 | |
| Day Percent Change: -0.18% Day Change: -0.01 | |
| Week Change: -2.4% Year-to-date Change: -4.1% | |
| WISH Links: Profile News Message Board | |
| Charts:- Daily , Weekly | |
| Add WISH to Watchlist: View: Get Complete WISH Trend Analysis ➞ | |
 | ARR ARMOUR Residential REIT, Inc. |
| Sector: Financials | |
| SubSector: Mortgage Investment | |
| MarketCap: 578.739 Millions | |
| Recent Price: 18.52 Smart Investing & Trading Score: 42 | |
| Day Percent Change: 1.70% Day Change: 0.31 | |
| Week Change: 1.93% Year-to-date Change: -4.1% | |
| ARR Links: Profile News Message Board | |
| Charts:- Daily , Weekly | |
| Add ARR to Watchlist: View: Get Complete ARR Trend Analysis ➞ | |
 | NTST NetSTREIT Corp. |
| Sector: Financials | |
| SubSector: REIT Retail | |
| MarketCap: 51267 Millions | |
| Recent Price: 17.12 Smart Investing & Trading Score: 59 | |
| Day Percent Change: 0.20% Day Change: 0.04 | |
| Week Change: 2.48% Year-to-date Change: -4.1% | |
| NTST Links: Profile News Message Board | |
| Charts:- Daily , Weekly | |
| Add NTST to Watchlist: View: Get Complete NTST Trend Analysis ➞ | |
 | TTMI TTM Technologies, Inc. |
| Sector: Technology | |
| SubSector: Printed Circuit Boards | |
| MarketCap: 1028.35 Millions | |
| Recent Price: 15.13 Smart Investing & Trading Score: 93 | |
| Day Percent Change: 2.37% Day Change: 0.35 | |
| Week Change: 7.69% Year-to-date Change: -4.3% | |
| TTMI Links: Profile News Message Board | |
| Charts:- Daily , Weekly | |
| Add TTMI to Watchlist: View: Get Complete TTMI Trend Analysis ➞ | |
 | BLMN Bloomin Brands, Inc. |
| Sector: Services & Goods | |
| SubSector: Restaurants | |
| MarketCap: 503.47 Millions | |
| Recent Price: 26.93 Smart Investing & Trading Score: 58 | |
| Day Percent Change: -0.22% Day Change: -0.06 | |
| Week Change: -0.41% Year-to-date Change: -4.3% | |
| BLMN Links: Profile News Message Board | |
| Charts:- Daily , Weekly | |
| Add BLMN to Watchlist: View: Get Complete BLMN Trend Analysis ➞ | |
 | SNBR Sleep Number Corporation |
| Sector: Consumer Staples | |
| SubSector: Home Furnishings & Fixtures | |
| MarketCap: 692.735 Millions | |
| Recent Price: 14.18 Smart Investing & Trading Score: 68 | |
| Day Percent Change: -0.35% Day Change: -0.05 | |
| Week Change: 4.19% Year-to-date Change: -4.4% | |
| SNBR Links: Profile News Message Board | |
| Charts:- Daily , Weekly | |
| Add SNBR to Watchlist: View: Get Complete SNBR Trend Analysis ➞ | |
 | LADR Ladder Capital Corp |
| Sector: Financials | |
| SubSector: Mortgage Investment | |
| MarketCap: 660.039 Millions | |
| Recent Price: 11.00 Smart Investing & Trading Score: 42 | |
| Day Percent Change: 1.85% Day Change: 0.20 | |
| Week Change: 4.96% Year-to-date Change: -4.4% | |
| LADR Links: Profile News Message Board | |
| Charts:- Daily , Weekly | |
| Add LADR to Watchlist: View: Get Complete LADR Trend Analysis ➞ | |
 | ENFN Enfusion, Inc. |
| Sector: Technology | |
| SubSector: Software - Application | |
| MarketCap: 1290 Millions | |
| Recent Price: 9.42 Smart Investing & Trading Score: 61 | |
| Day Percent Change: 0.00% Day Change: 0.00 | |
| Week Change: 1.95% Year-to-date Change: -4.4% | |
| ENFN Links: Profile News Message Board | |
| Charts:- Daily , Weekly | |
| Add ENFN to Watchlist: View: Get Complete ENFN Trend Analysis ➞ | |
 | PRA ProAssurance Corporation |
| Sector: Financials | |
| SubSector: Accident & Health Insurance | |
| MarketCap: 1434.6 Millions | |
| Recent Price: 13.17 Smart Investing & Trading Score: 42 | |
| Day Percent Change: -3.52% Day Change: -0.48 | |
| Week Change: -1.64% Year-to-date Change: -4.5% | |
| PRA Links: Profile News Message Board | |
| Charts:- Daily , Weekly | |
| Add PRA to Watchlist: View: Get Complete PRA Trend Analysis ➞ | |
 | OB Outbrain Inc. |
| Sector: Services & Goods | |
| SubSector: Internet Content & Information | |
| MarketCap: 250 Millions | |
| Recent Price: 4.18 Smart Investing & Trading Score: 75 | |
| Day Percent Change: 2.70% Day Change: 0.11 | |
| Week Change: 2.2% Year-to-date Change: -4.6% | |
| OB Links: Profile News Message Board | |
| Charts:- Daily , Weekly | |
| Add OB to Watchlist: View: Get Complete OB Trend Analysis ➞ | |
 | SGMO Sangamo Therapeutics, Inc. |
| Sector: Health Care | |
| SubSector: Biotechnology | |
| MarketCap: 779.285 Millions | |
| Recent Price: 0.52 Smart Investing & Trading Score: 51 | |
| Day Percent Change: 2.94% Day Change: 0.01 | |
| Week Change: 1.23% Year-to-date Change: -4.7% | |
| SGMO Links: Profile News Message Board | |
| Charts:- Daily , Weekly | |
| Add SGMO to Watchlist: View: Get Complete SGMO Trend Analysis ➞ | |
 | LPG Dorian LPG Ltd. |
| Sector: Transports | |
| SubSector: Shipping | |
| MarketCap: 426.414 Millions | |
| Recent Price: 41.78 Smart Investing & Trading Score: 95 | |
| Day Percent Change: 1.21% Day Change: 0.50 | |
| Week Change: 4.97% Year-to-date Change: -4.8% | |
| LPG Links: Profile News Message Board | |
| Charts:- Daily , Weekly | |
| Add LPG to Watchlist: View: Get Complete LPG Trend Analysis ➞ | |
 | MFA MFA Financial, Inc. |
| Sector: Financials | |
| SubSector: Mortgage Investment | |
| MarketCap: 1869.69 Millions | |
| Recent Price: 10.73 Smart Investing & Trading Score: 35 | |
| Day Percent Change: 1.80% Day Change: 0.19 | |
| Week Change: 2.88% Year-to-date Change: -4.8% | |
| MFA Links: Profile News Message Board | |
| Charts:- Daily , Weekly | |
| Add MFA to Watchlist: View: Get Complete MFA Trend Analysis ➞ | |
 | DX Dynex Capital, Inc. |
| Sector: Financials | |
| SubSector: Mortgage Investment | |
| MarketCap: 327.839 Millions | |
| Recent Price: 11.92 Smart Investing & Trading Score: 44 | |
| Day Percent Change: 2.23% Day Change: 0.26 | |
| Week Change: 1.79% Year-to-date Change: -4.8% | |
| DX Links: Profile News Message Board | |
| Charts:- Daily , Weekly | |
| Add DX to Watchlist: View: Get Complete DX Trend Analysis ➞ | |
 | ATRO Astronics Corporation |
| Sector: Industrials | |
| SubSector: Aerospace/Defense Products & Services | |
| MarketCap: 287.201 Millions | |
| Recent Price: 16.58 Smart Investing & Trading Score: 32 | |
| Day Percent Change: 2.85% Day Change: 0.46 | |
| Week Change: 3.5% Year-to-date Change: -4.8% | |
| ATRO Links: Profile News Message Board | |
| Charts:- Daily , Weekly | |
| Add ATRO to Watchlist: View: Get Complete ATRO Trend Analysis ➞ | |
 | EXLS ExlService Holdings, Inc. |
| Sector: Technology | |
| SubSector: Information Technology Services | |
| MarketCap: 1781.78 Millions | |
| Recent Price: 29.36 Smart Investing & Trading Score: 42 | |
| Day Percent Change: 0.17% Day Change: 0.05 | |
| Week Change: 0.14% Year-to-date Change: -4.8% | |
| EXLS Links: Profile News Message Board | |
| Charts:- Daily , Weekly | |
| Add EXLS to Watchlist: View: Get Complete EXLS Trend Analysis ➞ | |
 | NBN Northeast Bank |
| Sector: Financials | |
| SubSector: Regional - Northeast Banks | |
| MarketCap: 114.199 Millions | |
| Recent Price: 52.51 Smart Investing & Trading Score: 42 | |
| Day Percent Change: 1.39% Day Change: 0.72 | |
| Week Change: -0.61% Year-to-date Change: -4.9% | |
| NBN Links: Profile News Message Board | |
| Charts:- Daily , Weekly | |
| Add NBN to Watchlist: View: Get Complete NBN Trend Analysis ➞ | |
 | INVA Innoviva, Inc. |
| Sector: Health Care | |
| SubSector: Biotechnology | |
| MarketCap: 1023.15 Millions | |
| Recent Price: 15.26 Smart Investing & Trading Score: 64 | |
| Day Percent Change: 1.80% Day Change: 0.27 | |
| Week Change: 2.07% Year-to-date Change: -4.9% | |
| INVA Links: Profile News Message Board | |
| Charts:- Daily , Weekly | |
| Add INVA to Watchlist: View: Get Complete INVA Trend Analysis ➞ | |
 | ESRT Empire State Realty Trust, Inc. |
| Sector: Financials | |
| SubSector: REIT - Diversified | |
| MarketCap: 1632.13 Millions | |
| Recent Price: 9.21 Smart Investing & Trading Score: 42 | |
| Day Percent Change: 0.99% Day Change: 0.09 | |
| Week Change: 0.66% Year-to-date Change: -5.0% | |
| ESRT Links: Profile News Message Board | |
| Charts:- Daily , Weekly | |
| Add ESRT to Watchlist: View: Get Complete ESRT Trend Analysis ➞ | |
 | FFBC First Financial Bancorp. |
| Sector: Financials | |
| SubSector: Regional - Midwest Banks | |
| MarketCap: 1363.7 Millions | |
| Recent Price: 22.57 Smart Investing & Trading Score: 87 | |
| Day Percent Change: 0.94% Day Change: 0.21 | |
| Week Change: 3.11% Year-to-date Change: -5.0% | |
| FFBC Links: Profile News Message Board | |
| Charts:- Daily , Weekly | |
| Add FFBC to Watchlist: View: Get Complete FFBC Trend Analysis ➞ | |
 | UTL Unitil Corporation |
| Sector: Utilities | |
| SubSector: Diversified Utilities | |
| MarketCap: 756.98 Millions | |
| Recent Price: 49.94 Smart Investing & Trading Score: 78 | |
| Day Percent Change: -1.09% Day Change: -0.55 | |
| Week Change: -0.5% Year-to-date Change: -5.0% | |
| UTL Links: Profile News Message Board | |
| Charts:- Daily , Weekly | |
| Add UTL to Watchlist: View: Get Complete UTL Trend Analysis ➞ | |
 | MYGN Myriad Genetics, Inc. |
| Sector: Services & Goods | |
| SubSector: Research Services | |
| MarketCap: 1051.94 Millions | |
| Recent Price: 18.18 Smart Investing & Trading Score: 17 | |
| Day Percent Change: 1.11% Day Change: 0.20 | |
| Week Change: -1.73% Year-to-date Change: -5.0% | |
| MYGN Links: Profile News Message Board | |
| Charts:- Daily , Weekly | |
| Add MYGN to Watchlist: View: Get Complete MYGN Trend Analysis ➞ | |
 | APAM Artisan Partners Asset Management Inc. |
| Sector: Financials | |
| SubSector: Asset Management | |
| MarketCap: 1688.33 Millions | |
| Recent Price: 41.96 Smart Investing & Trading Score: 20 | |
| Day Percent Change: 2.24% Day Change: 0.92 | |
| Week Change: -1.55% Year-to-date Change: -5.0% | |
| APAM Links: Profile News Message Board | |
| Charts:- Daily , Weekly | |
| Add APAM to Watchlist: View: Get Complete APAM Trend Analysis ➞ | |
 | HTLF Heartland Financial USA, Inc. |
| Sector: Financials | |
| SubSector: Regional - Southwest Banks | |
| MarketCap: 1143.85 Millions | |
| Recent Price: 35.72 Smart Investing & Trading Score: 93 | |
| Day Percent Change: 0.68% Day Change: 0.24 | |
| Week Change: 2.64% Year-to-date Change: -5.0% | |
| HTLF Links: Profile News Message Board | |
| Charts:- Daily , Weekly | |
| Add HTLF to Watchlist: View: Get Complete HTLF Trend Analysis ➞ | |
| Too many stocks? View smallcap stocks filtered by marketcap & sector |
| Marketcap: All SmallCap Stocks (default-no microcap), Large, Mid-Range, Small & MicroCap |
| Sector: Tech, Finance, Energy, Staples, Retail, Industrial, Materials, Utilities & Medical |
|
Best Stocks Today 12Stocks.com |
© 2024 12Stocks.com Terms & Conditions Privacy Contact Us
All Information Provided Only For Education And Not To Be Used For Investing or Trading. See Terms & Conditions


One More Thing ... Get Best Stocks Delivered Daily!
Never Ever Miss A Move With Our Top Ten Stocks Lists
Find Best Stocks In Any Market - Bull or Bear Market
Take A Peek At Our Top Ten Stocks Lists: Daily, Weekly, Year-to-Date & Top Trends
Find Best Stocks In Any Market - Bull or Bear Market
Take A Peek At Our Top Ten Stocks Lists: Daily, Weekly, Year-to-Date & Top Trends
Smallcap Stocks With Best Up Trends [0-bearish to 100-bullish]: Cullinan Oncology[100], NextNav [100], MBIA [100], Reservoir Media[100], B. Riley[100], Braemar Hotels[100], Pactiv Evergreen[100], Wolverine World[100], Haemonetics [100], Benchmark Electronics[100], Uniti Group[100]
Best Smallcap Stocks Year-to-Date:
CareMax [568.04%], Janux [341.65%], Viking [299.3%], Alpine Immune[239.21%], Longboard [222.09%], Super Micro[201.64%], Avidity Biosciences[166.81%], Arcutis Bio[162.23%], Vera [156.27%], Cullinan Oncology[147.08%], Hippo [141.6%] Best Smallcap Stocks This Week:
Matterport [170.98%], B. Riley[84.19%], Cullinan Oncology[60.86%], Seres [47.35%], Zura Bio[38.67%], Universal Logistics[36.84%], Tutor Perini[33.89%], Riot Blockchain[30.67%], IGM Biosciences[30.56%], Impinj [29.74%], Sonic Automotive[28.14%] Best Smallcap Stocks Daily:
Universal Logistics[39.37%], Zura Bio[31.90%], Cullinan Oncology[30.86%], Tutor Perini[28.01%], IGM Biosciences[23.36%], U.S. Silica[21.67%], Maxeon Solar[20.17%], Exponent [19.49%], TPI Composites[16.32%], OptimizeRx [14.84%], Solaris Oilfield[13.95%]