
 Login Sign Up


| |||||
 |  | ||||

| 12Stocks.com Market Intelligence |
Best SmallCap Stocks
|
| In a hurry? Small Cap Stock Lists: Performance Trends Table, Stock Charts
Sort Small Cap stocks: Daily, Weekly, Year-to-Date, Market Cap & Trends. Filter Small Cap stocks list by sector: Show all, Tech, Finance, Energy, Staples, Retail, Industrial, Materials, Utilities and HealthCare Filter Small Cap stocks list by size: All Large Medium Small and MicroCap |
| 12Stocks.com Small Cap Stocks Performances & Trends Daily | |||||||||
|
|  The overall Smart Investing & Trading Score is 58 (0-bearish to 100-bullish) which puts Small Cap index in short term neutral trend. The Smart Investing & Trading Score from previous trading session is 63 and hence a deterioration of trend.
| ||||||||
Here are the Smart Investing & Trading Scores of the most requested small cap stocks at 12Stocks.com (click stock name for detailed review):
|


| 12Stocks.com: Investing in Smallcap Index with Stocks | |
|
The following table helps investors and traders sort through current performance and trends (as measured by Smart Investing & Trading Score) of various
stocks in the Smallcap Index. Quick View: Move mouse or cursor over stock symbol (ticker) to view short-term technical chart and over stock name to view long term chart. Click on  to add stock symbol to your watchlist and to add stock symbol to your watchlist and  to view watchlist. Click on any ticker or stock name for detailed market intelligence report for that stock. to view watchlist. Click on any ticker or stock name for detailed market intelligence report for that stock. |
12Stocks.com Performance of Stocks in Smallcap Index
| Ticker | Stock Name | Watchlist | Category | Recent Price | Smart Investing & Trading Score | Change % | YTD Change% |
| PRIM | Primoris Services |   | Industrials | 45.01 | 68 | -0.88% | 35.53% |
| BV | BrightView | | Industrials | 11.33 | 75 | -1.65% | 34.56% |
| HUMA | Humacyte | | Health Care | 3.82 | 81 | -2.68% | 34.51% |
| RDW | Redwire | | Industrials | 3.83 | 75 | 0.00% | 34.39% |
| SHAK | Shake Shack | | Services & Goods | 99.54 | 70 | -0.45% | 34.30% |
| RXST | RxSight | | Health Care | 53.86 | 86 | -1.82% | 34.28% |
| PI | Impinj | | Technology | 120.88 | 90 | -2.26% | 34.27% |
| REI | Ring Energy | | Energy | 1.96 | 36 | -2.97% | 34.25% |
| AHCO | AdaptHealth | | Health Care | 9.78 | 53 | -0.31% | 34.16% |
| AESI | Atlas Energy | | Energy | 22.77 | 68 | 0.75% | 33.00% |
| NRIX | Nurix | | Health Care | 13.73 | 53 | -2.83% | 32.91% |
| WIRE | Encore Wire | | Technology | 282.70 | 69 | -0.32% | 32.35% |
| NEXT | NextDecade | | Energy | 6.30 | 71 | -0.39% | 32.18% |
| USLM | United States | | Industrials | 304.22 | 68 | -0.02% | 32.07% |
| ETRN | Equitrans Midstream | | Energy | 13.44 | 80 | 4.27% | 32.02% |
| TGAN | Transphorm | | Technology | 4.83 | 55 | -0.51% | 31.79% |
| MLYS | Mineralys | | Health Care | 11.47 | 53 | 0.53% | 31.48% |
| ATMU | Atmus Filtration | | Industrials | 30.66 | 54 | -1.11% | 31.22% |
| AGX | Argan | | Industrials | 61.21 | 76 | -0.68% | 30.82% |
| WLDN | Willdan Group | | Services & Goods | 28.06 | 83 | 0.21% | 30.51% |
| DNOW | NOW | | Energy | 14.77 | 68 | -2.51% | 30.48% |
| ANF | Abercrombie & Fitch Co | | Services & Goods | 115.09 | 65 | -3.86% | 30.46% |
| KURA | Kura Oncology | | Health Care | 18.76 | 37 | 0.16% | 30.46% |
| VCEL | Vericel | | Health Care | 46.40 | 63 | -0.04% | 30.30% |
| PBF | PBF Energy | | Energy | 57.18 | 68 | -0.37% | 30.07% |


| Too many stocks? View smallcap stocks filtered by marketcap & sector |
| Marketcap: All SmallCap Stocks (default-no microcap), Large, Mid-Range, Small |
| Smallcap Sector: Tech, Finance, Energy, Staples, Retail, Industrial, Materials, & Medical |
|
Get the most comprehensive stock market coverage daily at 12Stocks.com ➞ Best Stocks Today ➞ Best Stocks Weekly ➞ Best Stocks Year-to-Date ➞ Best Stocks Trends ➞  Best Stocks Today 12Stocks.com Best Nasdaq Stocks ➞ Best S&P 500 Stocks ➞ Best Tech Stocks ➞ Best Biotech Stocks ➞ |
| Detailed Overview of SmallCap Stocks |
| SmallCap Technical Overview, Leaders & Laggards, Top SmallCap ETF Funds & Detailed SmallCap Stocks List, Charts, Trends & More |
| Smallcap: Technical Analysis, Trends & YTD Performance | |
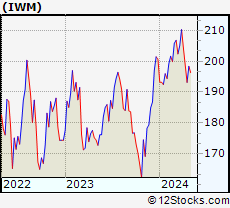
| SmallCap segment as represented by
IWM, an exchange-traded fund [ETF], holds basket of thousands of smallcap stocks from across all major sectors of the US stock market. The smallcap index (contains stocks like Riverbed & Sotheby's) is down by -1.51% and is currently underperforming the overall market by -7.17% year-to-date. Below is a quick view of technical charts and trends: | |
 IWM Weekly Chart |
|
| Long Term Trend: Good | |
| Medium Term Trend: Not Good | |
 IWM Daily Chart |
|
| Short Term Trend: Very Good | |
| Overall Trend Score: 58 | |
| YTD Performance: -1.51% | |
| **Trend Scores & Views Are Only For Educational Purposes And Not For Investing | |
| 12Stocks.com: Top Performing Small Cap Index Stocks | ||||||||||||||||||||||||||||||||||||||||||||||||
 The top performing Small Cap Index stocks year to date are
Now, more recently, over last week, the top performing Small Cap Index stocks on the move are


|
||||||||||||||||||||||||||||||||||||||||||||||||
| 12Stocks.com: Investing in Smallcap Index using Exchange Traded Funds | |
|
The following table shows list of key exchange traded funds (ETF) that
help investors track Smallcap index. The following list also includes leveraged ETF funds that track twice or thrice the daily returns of Smallcap indices. Short or inverse ETF funds move in the opposite direction to the index they track and are useful during market pullbacks or during bear markets. Quick View: Move mouse or cursor over ETF symbol (ticker) to view short-term technical chart and over ETF name to view long term chart. Click on ticker or stock name for detailed view. Click on to add stock symbol to your watchlist and to view watchlist. |
12Stocks.com List of ETFs that track Smallcap Index
| Ticker | ETF Name | Watchlist | Recent Price | Smart Investing & Trading Score | Change % | Week % | Year-to-date % |
| IWM | iShares Russell 2000 | | 197.68 | 58 | -0.45 | 2.35 | -1.51% |
| IJR | iShares Core S&P Small-Cap | | 105.71 | 85 | -0.24 | 2.41 | -2.35% |
| VTWO | Vanguard Russell 2000 ETF | | 79.95 | 48 | -0.42 | 2.39 | -1.42% |
| IWN | iShares Russell 2000 Value | | 151.28 | 75 | -0.30 | 2.37 | -2.61% |
| IWO | iShares Russell 2000 Growth | | 251.27 | 58 | -0.44 | 2.44 | -0.38% |
| IJS | iShares S&P Small-Cap 600 Value | | 97.71 | 45 | -0.43 | 2.2 | -5.2% |
| IJT | iShares S&P Small-Cap 600 Growth | | 125.60 | 48 | -0.10 | 2.77 | 0.37% |
| XSLV | PowerShares S&P SmallCap Low Volatil ETF | | 42.81 | 48 | -0.57 | 1.48 | -3.05% |
| SBB | ProShares Short SmallCap600 | | 16.37 | 33 | -0.02 | -2.79 | 2.76% |
| SMLV | SPDR SSGA US Small Cap Low Volatil ETF | | 108.43 | 73 | -0.31 | 2.21 | -3.63% |
| SAA | ProShares Ultra SmallCap600 | | 23.01 | 58 | -0.60 | 5.55 | -7.78% |
| SDD | ProShares UltraShort SmallCap600 | | 19.49 | 42 | 1.35 | -4.18 | 5.77% |
| 12Stocks.com: Charts, Trends, Fundamental Data and Performances of SmallCap Stocks | |
|
We now take in-depth look at all SmallCap stocks including charts, multi-period performances and overall trends (as measured by Smart Investing & Trading Score). One can sort SmallCap stocks (click link to choose) by Daily, Weekly and by Year-to-Date performances. Also, one can sort by size of the company or by market capitalization. |
| Select Your Default Chart Type: | |||||
| |||||
| Click on stock symbol or name for detailed view. Click on to add stock symbol to your watchlist and to view watchlist. Quick View: Move mouse or cursor over "Daily" to quickly view daily technical stock chart and over "Weekly" to view weekly technical stock chart. | |||||

 | PRIM Primoris Services Corporation |
| Sector: Industrials | |
| SubSector: Heavy Construction | |
| MarketCap: 931.895 Millions | |
| Recent Price: 45.01 Smart Investing & Trading Score: 68 | |
| Day Percent Change: -0.88% Day Change: -0.40 | |
| Week Change: 3.4% Year-to-date Change: 35.5% | |
| PRIM Links: Profile News Message Board | |
| Charts:- Daily , Weekly | |
| Add PRIM to Watchlist: View: Get Complete PRIM Trend Analysis ➞ | |
 | BV BrightView Holdings, Inc. |
| Sector: Industrials | |
| SubSector: General Contractors | |
| MarketCap: 973.763 Millions | |
| Recent Price: 11.33 Smart Investing & Trading Score: 75 | |
| Day Percent Change: -1.65% Day Change: -0.19 | |
| Week Change: 2.44% Year-to-date Change: 34.6% | |
| BV Links: Profile News Message Board | |
| Charts:- Daily , Weekly | |
| Add BV to Watchlist: View: Get Complete BV Trend Analysis ➞ | |
 | HUMA Humacyte, Inc. |
| Sector: Health Care | |
| SubSector: Biotechnology | |
| MarketCap: 297 Millions | |
| Recent Price: 3.82 Smart Investing & Trading Score: 81 | |
| Day Percent Change: -2.68% Day Change: -0.10 | |
| Week Change: 3.24% Year-to-date Change: 34.5% | |
| HUMA Links: Profile News Message Board | |
| Charts:- Daily , Weekly | |
| Add HUMA to Watchlist: View: Get Complete HUMA Trend Analysis ➞ | |
 | RDW Redwire Corporation |
| Sector: Industrials | |
| SubSector: Aerospace & Defense | |
| MarketCap: 160 Millions | |
| Recent Price: 3.83 Smart Investing & Trading Score: 75 | |
| Day Percent Change: 0.00% Day Change: 0.00 | |
| Week Change: 8.19% Year-to-date Change: 34.4% | |
| RDW Links: Profile News Message Board | |
| Charts:- Daily , Weekly | |
| Add RDW to Watchlist: View: Get Complete RDW Trend Analysis ➞ | |
 | SHAK Shake Shack Inc. |
| Sector: Services & Goods | |
| SubSector: Specialty Eateries | |
| MarketCap: 1497.67 Millions | |
| Recent Price: 99.54 Smart Investing & Trading Score: 70 | |
| Day Percent Change: -0.45% Day Change: -0.45 | |
| Week Change: 5.44% Year-to-date Change: 34.3% | |
| SHAK Links: Profile News Message Board | |
| Charts:- Daily , Weekly | |
| Add SHAK to Watchlist: View: Get Complete SHAK Trend Analysis ➞ | |
 | RXST RxSight, Inc. |
| Sector: Health Care | |
| SubSector: Medical Devices | |
| MarketCap: 893 Millions | |
| Recent Price: 53.86 Smart Investing & Trading Score: 86 | |
| Day Percent Change: -1.82% Day Change: -1.00 | |
| Week Change: 4.42% Year-to-date Change: 34.3% | |
| RXST Links: Profile News Message Board | |
| Charts:- Daily , Weekly | |
| Add RXST to Watchlist: View: Get Complete RXST Trend Analysis ➞ | |
 | PI Impinj, Inc. |
| Sector: Technology | |
| SubSector: Communication Equipment | |
| MarketCap: 364.739 Millions | |
| Recent Price: 120.88 Smart Investing & Trading Score: 90 | |
| Day Percent Change: -2.26% Day Change: -2.80 | |
| Week Change: 3.92% Year-to-date Change: 34.3% | |
| PI Links: Profile News Message Board | |
| Charts:- Daily , Weekly | |
| Add PI to Watchlist: View: Get Complete PI Trend Analysis ➞ | |
 | REI Ring Energy, Inc. |
| Sector: Energy | |
| SubSector: Oil & Gas Drilling & Exploration | |
| MarketCap: 50.8139 Millions | |
| Recent Price: 1.96 Smart Investing & Trading Score: 36 | |
| Day Percent Change: -2.97% Day Change: -0.06 | |
| Week Change: -2.97% Year-to-date Change: 34.3% | |
| REI Links: Profile News Message Board | |
| Charts:- Daily , Weekly | |
| Add REI to Watchlist: View: Get Complete REI Trend Analysis ➞ | |
 | AHCO AdaptHealth Corp. |
| Sector: Health Care | |
| SubSector: Medical Appliances & Equipment | |
| MarketCap: 1084.8 Millions | |
| Recent Price: 9.78 Smart Investing & Trading Score: 53 | |
| Day Percent Change: -0.31% Day Change: -0.03 | |
| Week Change: 4.71% Year-to-date Change: 34.2% | |
| AHCO Links: Profile News Message Board | |
| Charts:- Daily , Weekly | |
| Add AHCO to Watchlist: View: Get Complete AHCO Trend Analysis ➞ | |
 | AESI Atlas Energy Solutions Inc. |
| Sector: Energy | |
| SubSector: Oil & Gas Equipment & Services | |
| MarketCap: 947 Millions | |
| Recent Price: 22.77 Smart Investing & Trading Score: 68 | |
| Day Percent Change: 0.75% Day Change: 0.17 | |
| Week Change: 2.15% Year-to-date Change: 33.0% | |
| AESI Links: Profile News Message Board | |
| Charts:- Daily , Weekly | |
| Add AESI to Watchlist: View: Get Complete AESI Trend Analysis ➞ | |
 | NRIX Nurix Therapeutics, Inc. |
| Sector: Health Care | |
| SubSector: Biotechnology | |
| MarketCap: 16787 Millions | |
| Recent Price: 13.73 Smart Investing & Trading Score: 53 | |
| Day Percent Change: -2.83% Day Change: -0.40 | |
| Week Change: -3.07% Year-to-date Change: 32.9% | |
| NRIX Links: Profile News Message Board | |
| Charts:- Daily , Weekly | |
| Add NRIX to Watchlist: View: Get Complete NRIX Trend Analysis ➞ | |
 | WIRE Encore Wire Corporation |
| Sector: Technology | |
| SubSector: Diversified Electronics | |
| MarketCap: 898.896 Millions | |
| Recent Price: 282.70 Smart Investing & Trading Score: 69 | |
| Day Percent Change: -0.32% Day Change: -0.90 | |
| Week Change: -0.6% Year-to-date Change: 32.4% | |
| WIRE Links: Profile News Message Board | |
| Charts:- Daily , Weekly | |
| Add WIRE to Watchlist: View: Get Complete WIRE Trend Analysis ➞ | |
 | NEXT NextDecade Corporation |
| Sector: Energy | |
| SubSector: Independent Oil & Gas | |
| MarketCap: 270.893 Millions | |
| Recent Price: 6.30 Smart Investing & Trading Score: 71 | |
| Day Percent Change: -0.39% Day Change: -0.03 | |
| Week Change: 3.36% Year-to-date Change: 32.2% | |
| NEXT Links: Profile News Message Board | |
| Charts:- Daily , Weekly | |
| Add NEXT to Watchlist: View: Get Complete NEXT Trend Analysis ➞ | |
 | USLM United States Lime & Minerals, Inc. |
| Sector: Industrials | |
| SubSector: General Building Materials | |
| MarketCap: 427.653 Millions | |
| Recent Price: 304.22 Smart Investing & Trading Score: 68 | |
| Day Percent Change: -0.02% Day Change: -0.06 | |
| Week Change: 2.51% Year-to-date Change: 32.1% | |
| USLM Links: Profile News Message Board | |
| Charts:- Daily , Weekly | |
| Add USLM to Watchlist: View: Get Complete USLM Trend Analysis ➞ | |
 | ETRN Equitrans Midstream Corporation |
| Sector: Energy | |
| SubSector: Independent Oil & Gas | |
| MarketCap: 1772.73 Millions | |
| Recent Price: 13.44 Smart Investing & Trading Score: 80 | |
| Day Percent Change: 4.27% Day Change: 0.55 | |
| Week Change: 7.95% Year-to-date Change: 32.0% | |
| ETRN Links: Profile News Message Board | |
| Charts:- Daily , Weekly | |
| Add ETRN to Watchlist: View: Get Complete ETRN Trend Analysis ➞ | |
 | TGAN Transphorm, Inc. |
| Sector: Technology | |
| SubSector: Semiconductor Equipment & Materials | |
| MarketCap: 194 Millions | |
| Recent Price: 4.83 Smart Investing & Trading Score: 55 | |
| Day Percent Change: -0.51% Day Change: -0.03 | |
| Week Change: 0.84% Year-to-date Change: 31.8% | |
| TGAN Links: Profile News Message Board | |
| Charts:- Daily , Weekly | |
| Add TGAN to Watchlist: View: Get Complete TGAN Trend Analysis ➞ | |
 | MLYS Mineralys Therapeutics, Inc. |
| Sector: Health Care | |
| SubSector: Biotechnology | |
| MarketCap: 719 Millions | |
| Recent Price: 11.47 Smart Investing & Trading Score: 53 | |
| Day Percent Change: 0.53% Day Change: 0.06 | |
| Week Change: 1.55% Year-to-date Change: 31.5% | |
| MLYS Links: Profile News Message Board | |
| Charts:- Daily , Weekly | |
| Add MLYS to Watchlist: View: Get Complete MLYS Trend Analysis ➞ | |
 | ATMU Atmus Filtration Technologies Inc. |
| Sector: Industrials | |
| SubSector: Pollution & Treatment Controls | |
| MarketCap: 1830 Millions | |
| Recent Price: 30.66 Smart Investing & Trading Score: 54 | |
| Day Percent Change: -1.11% Day Change: -0.35 | |
| Week Change: -0.66% Year-to-date Change: 31.2% | |
| ATMU Links: Profile News Message Board | |
| Charts:- Daily , Weekly | |
| Add ATMU to Watchlist: View: Get Complete ATMU Trend Analysis ➞ | |
 | AGX Argan, Inc. |
| Sector: Industrials | |
| SubSector: Heavy Construction | |
| MarketCap: 664.095 Millions | |
| Recent Price: 61.21 Smart Investing & Trading Score: 76 | |
| Day Percent Change: -0.68% Day Change: -0.42 | |
| Week Change: -1.15% Year-to-date Change: 30.8% | |
| AGX Links: Profile News Message Board | |
| Charts:- Daily , Weekly | |
| Add AGX to Watchlist: View: Get Complete AGX Trend Analysis ➞ | |
 | WLDN Willdan Group, Inc. |
| Sector: Services & Goods | |
| SubSector: Technical Services | |
| MarketCap: 235.61 Millions | |
| Recent Price: 28.06 Smart Investing & Trading Score: 83 | |
| Day Percent Change: 0.21% Day Change: 0.06 | |
| Week Change: 4.51% Year-to-date Change: 30.5% | |
| WLDN Links: Profile News Message Board | |
| Charts:- Daily , Weekly | |
| Add WLDN to Watchlist: View: Get Complete WLDN Trend Analysis ➞ | |
 | DNOW NOW Inc. |
| Sector: Energy | |
| SubSector: Oil & Gas Equipment & Services | |
| MarketCap: 679.661 Millions | |
| Recent Price: 14.77 Smart Investing & Trading Score: 68 | |
| Day Percent Change: -2.51% Day Change: -0.38 | |
| Week Change: 0.82% Year-to-date Change: 30.5% | |
| DNOW Links: Profile News Message Board | |
| Charts:- Daily , Weekly | |
| Add DNOW to Watchlist: View: Get Complete DNOW Trend Analysis ➞ | |
 | ANF Abercrombie & Fitch Co. |
| Sector: Services & Goods | |
| SubSector: Apparel Stores | |
| MarketCap: 589.108 Millions | |
| Recent Price: 115.09 Smart Investing & Trading Score: 65 | |
| Day Percent Change: -3.86% Day Change: -4.62 | |
| Week Change: 4.29% Year-to-date Change: 30.5% | |
| ANF Links: Profile News Message Board | |
| Charts:- Daily , Weekly | |
| Add ANF to Watchlist: View: Get Complete ANF Trend Analysis ➞ | |
 | KURA Kura Oncology, Inc. |
| Sector: Health Care | |
| SubSector: Biotechnology | |
| MarketCap: 401.885 Millions | |
| Recent Price: 18.76 Smart Investing & Trading Score: 37 | |
| Day Percent Change: 0.16% Day Change: 0.03 | |
| Week Change: 7.02% Year-to-date Change: 30.5% | |
| KURA Links: Profile News Message Board | |
| Charts:- Daily , Weekly | |
| Add KURA to Watchlist: View: Get Complete KURA Trend Analysis ➞ | |
 | VCEL Vericel Corporation |
| Sector: Health Care | |
| SubSector: Biotechnology | |
| MarketCap: 391.885 Millions | |
| Recent Price: 46.40 Smart Investing & Trading Score: 63 | |
| Day Percent Change: -0.04% Day Change: -0.02 | |
| Week Change: 6.08% Year-to-date Change: 30.3% | |
| VCEL Links: Profile News Message Board | |
| Charts:- Daily , Weekly | |
| Add VCEL to Watchlist: View: Get Complete VCEL Trend Analysis ➞ | |
 | PBF PBF Energy Inc |
| Sector: Energy | |
| SubSector: Oil & Gas Refining & Marketing | |
| MarketCap: 1118.54 Millions | |
| Recent Price: 57.18 Smart Investing & Trading Score: 68 | |
| Day Percent Change: -0.37% Day Change: -0.21 | |
| Week Change: 2.25% Year-to-date Change: 30.1% | |
| PBF Links: Profile News Message Board | |
| Charts:- Daily , Weekly | |
| Add PBF to Watchlist: View: Get Complete PBF Trend Analysis ➞ | |
| Too many stocks? View smallcap stocks filtered by marketcap & sector |
| Marketcap: All SmallCap Stocks (default-no microcap), Large, Mid-Range, Small & MicroCap |
| Sector: Tech, Finance, Energy, Staples, Retail, Industrial, Materials, Utilities & Medical |
|
Best Stocks Today 12Stocks.com |
© 2024 12Stocks.com Terms & Conditions Privacy Contact Us
All Information Provided Only For Education And Not To Be Used For Investing or Trading. See Terms & Conditions


One More Thing ... Get Best Stocks Delivered Daily!
Never Ever Miss A Move With Our Top Ten Stocks Lists
Find Best Stocks In Any Market - Bull or Bear Market
Take A Peek At Our Top Ten Stocks Lists: Daily, Weekly, Year-to-Date & Top Trends
Find Best Stocks In Any Market - Bull or Bear Market
Take A Peek At Our Top Ten Stocks Lists: Daily, Weekly, Year-to-Date & Top Trends
Smallcap Stocks With Best Up Trends [0-bearish to 100-bullish]: B. Riley[100], Ribbon [100], Group 1[100], Trustmark [100], MBIA [100], Integer [100], EchoStar [100], Vishay Inter[100], Comstock Resources[100], Jamf Holding[100], SunOpta [100]
Best Smallcap Stocks Year-to-Date:
CareMax [574.23%], Janux [352.07%], Viking [249.44%], Alpine Immune[239.13%], Longboard [223.4%], Avidity Biosciences[177.71%], Arcutis Bio[171.21%], Super Micro[165.69%], Vera [149.61%], Hippo [130.79%], Y-mAbs [123.75%] Best Smallcap Stocks This Week:
Matterport [166.09%], B. Riley[49.37%], Seres [30.29%], Riot Blockchain[30.07%], CareMax [27.24%], Ribbon [25.78%], ProKidney [23.28%], SoundHound AI[22.54%], Cipher Mining[22.14%], Hibbett Sports[21.56%], Cullinan Oncology[20.69%] Best Smallcap Stocks Daily:
B. Riley[37.48%], Ribbon [26.26%], Babcock & Wilcox Enterprises[15.57%], Cullinan Oncology[13.55%], Amneal [12.41%], Gritstone Oncology[11.01%], Comtech Tele[10.76%], Innodata [9.76%], Navitas Semiconductor[8.83%], Eyenovia [8.68%], K12 [8.64%]