
 Login Sign Up


| |||||
 |  | ||||

| 12Stocks.com Market Intelligence |
Best SmallCap Stocks
|
| In a hurry? Small Cap Stock Lists: Performance Trends Table, Stock Charts
Sort Small Cap stocks: Daily, Weekly, Year-to-Date, Market Cap & Trends. Filter Small Cap stocks list by sector: Show all, Tech, Finance, Energy, Staples, Retail, Industrial, Materials, Utilities and HealthCare Filter Small Cap stocks list by size: All Large Medium Small and MicroCap |
| 12Stocks.com Small Cap Stocks Performances & Trends Daily | |||||||||
|
|  The overall Smart Investing & Trading Score is 23 (0-bearish to 100-bullish) which puts Small Cap index in short term bearish to neutral trend. The Smart Investing & Trading Score from previous trading session is 13 and hence an improvement of trend.
| ||||||||
Here are the Smart Investing & Trading Scores of the most requested small cap stocks at 12Stocks.com (click stock name for detailed review):
|


| 12Stocks.com: Investing in Smallcap Index with Stocks | |
|
The following table helps investors and traders sort through current performance and trends (as measured by Smart Investing & Trading Score) of various
stocks in the Smallcap Index. Quick View: Move mouse or cursor over stock symbol (ticker) to view short-term technical chart and over stock name to view long term chart. Click on  to add stock symbol to your watchlist and to add stock symbol to your watchlist and  to view watchlist. Click on any ticker or stock name for detailed market intelligence report for that stock. to view watchlist. Click on any ticker or stock name for detailed market intelligence report for that stock. |
12Stocks.com Performance of Stocks in Smallcap Index
| Ticker | Stock Name | Watchlist | Category | Recent Price | Smart Investing & Trading Score | Change % | YTD Change% |
| CIM | Chimera |   | Financials | 4.02 | 22 | 1.26% | -19.44% |
| NVEE | NV5 Global | | Services & Goods | 89.46 | 0 | -1.55% | -19.49% |
| BBCP | Concrete Pumping | | Industrials | 6.60 | 0 | -3.79% | -19.51% |
| PZZA | Papa John | | Services & Goods | 61.35 | 10 | 0.66% | -19.52% |
| JJSF | J & J Snack Foods | | Consumer Staples | 134.50 | 35 | 0.21% | -19.53% |
| FMAO | Farmers & Merchants Bancorp | | Financials | 19.95 | 18 | 0.50% | -19.56% |
| MHO | M/I Homes | | Industrials | 110.69 | 10 | -0.64% | -19.64% |
| CDZI | Cadiz | | Utilities | 2.25 | 17 | 4.65% | -19.64% |
| VIAV | Viavi Solutions | | Technology | 8.09 | 10 | -0.98% | -19.66% |
| FIBK | First Interstate | | Financials | 24.70 | 28 | 1.06% | -19.67% |
| DLTH | Duluth | | Services & Goods | 4.32 | 10 | -0.46% | -19.70% |
| CYTK | Cytokinetics | | Health Care | 67.00 | 0 | -1.37% | -19.75% |
| PKBK | Parke Bancorp | | Financials | 16.25 | 35 | 0.31% | -19.75% |
| JOUT | Johnson Outdoors | | Consumer Staples | 42.78 | 35 | 0.90% | -19.92% |
| INSM | Insmed | | Health Care | 24.80 | 0 | -5.27% | -19.97% |
| CFFN | Capitol Federal | | Financials | 5.16 | 25 | 0.78% | -20.00% |
| AMAL | Amalgamated Bank | | Financials | 21.55 | 10 | 0.28% | -20.01% |
| HBCP | Home Bancorp | | Financials | 33.60 | 0 | -0.30% | -20.02% |
| OIS | Oil States | | Energy | 5.43 | 0 | 0.18% | -20.03% |
| NYMT | New York | | Financials | 6.82 | 20 | 0.00% | -20.05% |
| ACCO | ACCO Brands | | Consumer Staples | 4.86 | 10 | 0.41% | -20.07% |
| GIII | G-III Apparel | | Consumer Staples | 27.15 | 18 | -0.48% | -20.10% |
| MIRM | Mirum | | Health Care | 23.57 | 0 | -1.17% | -20.16% |
| UTMD | Utah Medical | | Health Care | 67.23 | 20 | -0.58% | -20.17% |
| MQ | Marqeta | | Technology | 5.62 | 42 | 4.17% | -20.18% |


| Too many stocks? View smallcap stocks filtered by marketcap & sector |
| Marketcap: All SmallCap Stocks (default-no microcap), Large, Mid-Range, Small |
| Smallcap Sector: Tech, Finance, Energy, Staples, Retail, Industrial, Materials, & Medical |
|
Get the most comprehensive stock market coverage daily at 12Stocks.com ➞ Best Stocks Today ➞ Best Stocks Weekly ➞ Best Stocks Year-to-Date ➞ Best Stocks Trends ➞  Best Stocks Today 12Stocks.com Best Nasdaq Stocks ➞ Best S&P 500 Stocks ➞ Best Tech Stocks ➞ Best Biotech Stocks ➞ |
| Detailed Overview of SmallCap Stocks |
| SmallCap Technical Overview, Leaders & Laggards, Top SmallCap ETF Funds & Detailed SmallCap Stocks List, Charts, Trends & More |
| Smallcap: Technical Analysis, Trends & YTD Performance | |
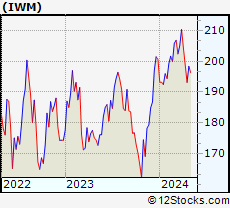
| SmallCap segment as represented by
IWM, an exchange-traded fund [ETF], holds basket of thousands of smallcap stocks from across all major sectors of the US stock market. The smallcap index (contains stocks like Riverbed & Sotheby's) is down by -3.92% and is currently underperforming the overall market by -8.11% year-to-date. Below is a quick view of technical charts and trends: | |
 IWM Weekly Chart |
|
| Long Term Trend: Not Good | |
| Medium Term Trend: Not Good | |
 IWM Daily Chart |
|
| Short Term Trend: Not Good | |
| Overall Trend Score: 23 | |
| YTD Performance: -3.92% | |
| **Trend Scores & Views Are Only For Educational Purposes And Not For Investing | |
| 12Stocks.com: Top Performing Small Cap Index Stocks | ||||||||||||||||||||||||||||||||||||||||||||||||
 The top performing Small Cap Index stocks year to date are
Now, more recently, over last week, the top performing Small Cap Index stocks on the move are


|
||||||||||||||||||||||||||||||||||||||||||||||||
| 12Stocks.com: Investing in Smallcap Index using Exchange Traded Funds | |
|
The following table shows list of key exchange traded funds (ETF) that
help investors track Smallcap index. The following list also includes leveraged ETF funds that track twice or thrice the daily returns of Smallcap indices. Short or inverse ETF funds move in the opposite direction to the index they track and are useful during market pullbacks or during bear markets. Quick View: Move mouse or cursor over ETF symbol (ticker) to view short-term technical chart and over ETF name to view long term chart. Click on ticker or stock name for detailed view. Click on to add stock symbol to your watchlist and to view watchlist. |
12Stocks.com List of ETFs that track Smallcap Index
| Ticker | ETF Name | Watchlist | Recent Price | Smart Investing & Trading Score | Change % | Week % | Year-to-date % |
| IWM | iShares Russell 2000 | | 192.84 | 23 | -0.08 | -2.94 | -3.92% |
| IJR | iShares Core S&P Small-Cap | | 102.34 | 31 | 0.21 | -2.08 | -5.46% |
| VTWO | Vanguard Russell 2000 ETF | | 77.95 | 23 | -0.13 | -2.95 | -3.88% |
| IWN | iShares Russell 2000 Value | | 146.33 | 10 | 0.21 | -2.69 | -5.79% |
| IJS | iShares S&P Small-Cap 600 Value | | 94.51 | 10 | 0.41 | -1.73 | -8.31% |
| IWO | iShares Russell 2000 Growth | | 246.94 | 36 | -0.44 | -3.3 | -2.09% |
| IJT | iShares S&P Small-Cap 600 Growth | | 121.57 | 23 | -0.22 | -2.57 | -2.85% |
| XSLV | PowerShares S&P SmallCap Low Volatil ETF | | 41.65 | 25 | 0.56 | -1.05 | -5.66% |
| SAA | ProShares Ultra SmallCap600 | | 21.62 | 10 | -0.18 | -4.17 | -13.35% |
| SMLV | SPDR SSGA US Small Cap Low Volatil ETF | | 103.83 | 10 | 0.16 | -1.13 | -7.72% |
| SBB | ProShares Short SmallCap600 | | 16.98 | 95 | 0.77 | 2.62 | 6.59% |
| SDD | ProShares UltraShort SmallCap600 | | 20.69 | 83 | 0.44 | 4.33 | 12.28% |
| 12Stocks.com: Charts, Trends, Fundamental Data and Performances of SmallCap Stocks | |
|
We now take in-depth look at all SmallCap stocks including charts, multi-period performances and overall trends (as measured by Smart Investing & Trading Score). One can sort SmallCap stocks (click link to choose) by Daily, Weekly and by Year-to-Date performances. Also, one can sort by size of the company or by market capitalization. |
| Select Your Default Chart Type: | |||||
| |||||
| Click on stock symbol or name for detailed view. Click on to add stock symbol to your watchlist and to view watchlist. Quick View: Move mouse or cursor over "Daily" to quickly view daily technical stock chart and over "Weekly" to view weekly technical stock chart. | |||||

 | CIM Chimera Investment Corporation |
| Sector: Financials | |
| SubSector: Mortgage Investment | |
| MarketCap: 2164.09 Millions | |
| Recent Price: 4.02 Smart Investing & Trading Score: 22 | |
| Day Percent Change: 1.26% Day Change: 0.05 | |
| Week Change: -1.47% Year-to-date Change: -19.4% | |
| CIM Links: Profile News Message Board | |
| Charts:- Daily , Weekly | |
| Add CIM to Watchlist: View: Get Complete CIM Trend Analysis ➞ | |
 | NVEE NV5 Global, Inc. |
| Sector: Services & Goods | |
| SubSector: Technical Services | |
| MarketCap: 484.91 Millions | |
| Recent Price: 89.46 Smart Investing & Trading Score: 0 | |
| Day Percent Change: -1.55% Day Change: -1.41 | |
| Week Change: -5.66% Year-to-date Change: -19.5% | |
| NVEE Links: Profile News Message Board | |
| Charts:- Daily , Weekly | |
| Add NVEE to Watchlist: View: Get Complete NVEE Trend Analysis ➞ | |
 | BBCP Concrete Pumping Holdings, Inc. |
| Sector: Industrials | |
| SubSector: General Building Materials | |
| MarketCap: 263.653 Millions | |
| Recent Price: 6.60 Smart Investing & Trading Score: 0 | |
| Day Percent Change: -3.79% Day Change: -0.26 | |
| Week Change: -9.22% Year-to-date Change: -19.5% | |
| BBCP Links: Profile News Message Board | |
| Charts:- Daily , Weekly | |
| Add BBCP to Watchlist: View: Get Complete BBCP Trend Analysis ➞ | |
 | PZZA Papa John s International, Inc. |
| Sector: Services & Goods | |
| SubSector: Specialty Eateries | |
| MarketCap: 1925.27 Millions | |
| Recent Price: 61.35 Smart Investing & Trading Score: 10 | |
| Day Percent Change: 0.66% Day Change: 0.40 | |
| Week Change: -0.7% Year-to-date Change: -19.5% | |
| PZZA Links: Profile News Message Board | |
| Charts:- Daily , Weekly | |
| Add PZZA to Watchlist: View: Get Complete PZZA Trend Analysis ➞ | |
 | JJSF J & J Snack Foods Corp. |
| Sector: Consumer Staples | |
| SubSector: Processed & Packaged Goods | |
| MarketCap: 2706.28 Millions | |
| Recent Price: 134.50 Smart Investing & Trading Score: 35 | |
| Day Percent Change: 0.21% Day Change: 0.28 | |
| Week Change: -0.06% Year-to-date Change: -19.5% | |
| JJSF Links: Profile News Message Board | |
| Charts:- Daily , Weekly | |
| Add JJSF to Watchlist: View: Get Complete JJSF Trend Analysis ➞ | |
 | FMAO Farmers & Merchants Bancorp, Inc. |
| Sector: Financials | |
| SubSector: Regional - Midwest Banks | |
| MarketCap: 280.27 Millions | |
| Recent Price: 19.95 Smart Investing & Trading Score: 18 | |
| Day Percent Change: 0.50% Day Change: 0.10 | |
| Week Change: -1.48% Year-to-date Change: -19.6% | |
| FMAO Links: Profile News Message Board | |
| Charts:- Daily , Weekly | |
| Add FMAO to Watchlist: View: Get Complete FMAO Trend Analysis ➞ | |
 | MHO M/I Homes, Inc. |
| Sector: Industrials | |
| SubSector: Residential Construction | |
| MarketCap: 437.106 Millions | |
| Recent Price: 110.69 Smart Investing & Trading Score: 10 | |
| Day Percent Change: -0.64% Day Change: -0.71 | |
| Week Change: -6% Year-to-date Change: -19.6% | |
| MHO Links: Profile News Message Board | |
| Charts:- Daily , Weekly | |
| Add MHO to Watchlist: View: Get Complete MHO Trend Analysis ➞ | |
 | CDZI Cadiz Inc. |
| Sector: Utilities | |
| SubSector: Water Utilities | |
| MarketCap: 265.502 Millions | |
| Recent Price: 2.25 Smart Investing & Trading Score: 17 | |
| Day Percent Change: 4.65% Day Change: 0.10 | |
| Week Change: -3.02% Year-to-date Change: -19.6% | |
| CDZI Links: Profile News Message Board | |
| Charts:- Daily , Weekly | |
| Add CDZI to Watchlist: View: Get Complete CDZI Trend Analysis ➞ | |
 | VIAV Viavi Solutions Inc. |
| Sector: Technology | |
| SubSector: Communication Equipment | |
| MarketCap: 2653.29 Millions | |
| Recent Price: 8.09 Smart Investing & Trading Score: 10 | |
| Day Percent Change: -0.98% Day Change: -0.08 | |
| Week Change: -4.26% Year-to-date Change: -19.7% | |
| VIAV Links: Profile News Message Board | |
| Charts:- Daily , Weekly | |
| Add VIAV to Watchlist: View: Get Complete VIAV Trend Analysis ➞ | |
 | FIBK First Interstate BancSystem, Inc. |
| Sector: Financials | |
| SubSector: Regional - Pacific Banks | |
| MarketCap: 1797.69 Millions | |
| Recent Price: 24.70 Smart Investing & Trading Score: 28 | |
| Day Percent Change: 1.06% Day Change: 0.26 | |
| Week Change: -1.55% Year-to-date Change: -19.7% | |
| FIBK Links: Profile News Message Board | |
| Charts:- Daily , Weekly | |
| Add FIBK to Watchlist: View: Get Complete FIBK Trend Analysis ➞ | |
 | DLTH Duluth Holdings Inc. |
| Sector: Services & Goods | |
| SubSector: Apparel Stores | |
| MarketCap: 180.008 Millions | |
| Recent Price: 4.32 Smart Investing & Trading Score: 10 | |
| Day Percent Change: -0.46% Day Change: -0.02 | |
| Week Change: -2.7% Year-to-date Change: -19.7% | |
| DLTH Links: Profile News Message Board | |
| Charts:- Daily , Weekly | |
| Add DLTH to Watchlist: View: Get Complete DLTH Trend Analysis ➞ | |
 | CYTK Cytokinetics, Incorporated |
| Sector: Health Care | |
| SubSector: Biotechnology | |
| MarketCap: 654.285 Millions | |
| Recent Price: 67.00 Smart Investing & Trading Score: 0 | |
| Day Percent Change: -1.37% Day Change: -0.93 | |
| Week Change: -6.37% Year-to-date Change: -19.8% | |
| CYTK Links: Profile News Message Board | |
| Charts:- Daily , Weekly | |
| Add CYTK to Watchlist: View: Get Complete CYTK Trend Analysis ➞ | |
 | PKBK Parke Bancorp, Inc. |
| Sector: Financials | |
| SubSector: Regional - Northeast Banks | |
| MarketCap: 165.799 Millions | |
| Recent Price: 16.25 Smart Investing & Trading Score: 35 | |
| Day Percent Change: 0.31% Day Change: 0.05 | |
| Week Change: 0.25% Year-to-date Change: -19.8% | |
| PKBK Links: Profile News Message Board | |
| Charts:- Daily , Weekly | |
| Add PKBK to Watchlist: View: Get Complete PKBK Trend Analysis ➞ | |
 | JOUT Johnson Outdoors Inc. |
| Sector: Consumer Staples | |
| SubSector: Sporting Goods | |
| MarketCap: 572.844 Millions | |
| Recent Price: 42.78 Smart Investing & Trading Score: 35 | |
| Day Percent Change: 0.90% Day Change: 0.38 | |
| Week Change: -0.35% Year-to-date Change: -19.9% | |
| JOUT Links: Profile News Message Board | |
| Charts:- Daily , Weekly | |
| Add JOUT to Watchlist: View: Get Complete JOUT Trend Analysis ➞ | |
 | INSM Insmed Incorporated |
| Sector: Health Care | |
| SubSector: Biotechnology | |
| MarketCap: 1452.45 Millions | |
| Recent Price: 24.80 Smart Investing & Trading Score: 0 | |
| Day Percent Change: -5.27% Day Change: -1.38 | |
| Week Change: -8.99% Year-to-date Change: -20.0% | |
| INSM Links: Profile News Message Board | |
| Charts:- Daily , Weekly | |
| Add INSM to Watchlist: View: Get Complete INSM Trend Analysis ➞ | |
 | CFFN Capitol Federal Financial, Inc. |
| Sector: Financials | |
| SubSector: Savings & Loans | |
| MarketCap: 1639.1 Millions | |
| Recent Price: 5.16 Smart Investing & Trading Score: 25 | |
| Day Percent Change: 0.78% Day Change: 0.04 | |
| Week Change: -2.46% Year-to-date Change: -20.0% | |
| CFFN Links: Profile News Message Board | |
| Charts:- Daily , Weekly | |
| Add CFFN to Watchlist: View: Get Complete CFFN Trend Analysis ➞ | |
 | AMAL Amalgamated Bank |
| Sector: Financials | |
| SubSector: Regional - Northeast Banks | |
| MarketCap: 321.899 Millions | |
| Recent Price: 21.55 Smart Investing & Trading Score: 10 | |
| Day Percent Change: 0.28% Day Change: 0.06 | |
| Week Change: -1.96% Year-to-date Change: -20.0% | |
| AMAL Links: Profile News Message Board | |
| Charts:- Daily , Weekly | |
| Add AMAL to Watchlist: View: Get Complete AMAL Trend Analysis ➞ | |
 | HBCP Home Bancorp, Inc. |
| Sector: Financials | |
| SubSector: Savings & Loans | |
| MarketCap: 206.83 Millions | |
| Recent Price: 33.60 Smart Investing & Trading Score: 0 | |
| Day Percent Change: -0.30% Day Change: -0.10 | |
| Week Change: -3.17% Year-to-date Change: -20.0% | |
| HBCP Links: Profile News Message Board | |
| Charts:- Daily , Weekly | |
| Add HBCP to Watchlist: View: Get Complete HBCP Trend Analysis ➞ | |
 | OIS Oil States International, Inc. |
| Sector: Energy | |
| SubSector: Oil & Gas Equipment & Services | |
| MarketCap: 131.061 Millions | |
| Recent Price: 5.43 Smart Investing & Trading Score: 0 | |
| Day Percent Change: 0.18% Day Change: 0.01 | |
| Week Change: -7.5% Year-to-date Change: -20.0% | |
| OIS Links: Profile News Message Board | |
| Charts:- Daily , Weekly | |
| Add OIS to Watchlist: View: Get Complete OIS Trend Analysis ➞ | |
 | NYMT New York Mortgage Trust, Inc. |
| Sector: Financials | |
| SubSector: Mortgage Investment | |
| MarketCap: 1038.39 Millions | |
| Recent Price: 6.82 Smart Investing & Trading Score: 20 | |
| Day Percent Change: 0.00% Day Change: 0.00 | |
| Week Change: -2.29% Year-to-date Change: -20.1% | |
| NYMT Links: Profile News Message Board | |
| Charts:- Daily , Weekly | |
| Add NYMT to Watchlist: View: Get Complete NYMT Trend Analysis ➞ | |
 | ACCO ACCO Brands Corporation |
| Sector: Consumer Staples | |
| SubSector: Office Supplies | |
| MarketCap: 448.2 Millions | |
| Recent Price: 4.86 Smart Investing & Trading Score: 10 | |
| Day Percent Change: 0.41% Day Change: 0.02 | |
| Week Change: -3.38% Year-to-date Change: -20.1% | |
| ACCO Links: Profile News Message Board | |
| Charts:- Daily , Weekly | |
| Add ACCO to Watchlist: View: Get Complete ACCO Trend Analysis ➞ | |
 | GIII G-III Apparel Group, Ltd. |
| Sector: Consumer Staples | |
| SubSector: Textile - Apparel Clothing | |
| MarketCap: 354.365 Millions | |
| Recent Price: 27.15 Smart Investing & Trading Score: 18 | |
| Day Percent Change: -0.48% Day Change: -0.13 | |
| Week Change: -2.72% Year-to-date Change: -20.1% | |
| GIII Links: Profile News Message Board | |
| Charts:- Daily , Weekly | |
| Add GIII to Watchlist: View: Get Complete GIII Trend Analysis ➞ | |
 | MIRM Mirum Pharmaceuticals, Inc. |
| Sector: Health Care | |
| SubSector: Biotechnology | |
| MarketCap: 309.585 Millions | |
| Recent Price: 23.57 Smart Investing & Trading Score: 0 | |
| Day Percent Change: -1.17% Day Change: -0.28 | |
| Week Change: -4.11% Year-to-date Change: -20.2% | |
| MIRM Links: Profile News Message Board | |
| Charts:- Daily , Weekly | |
| Add MIRM to Watchlist: View: Get Complete MIRM Trend Analysis ➞ | |
 | UTMD Utah Medical Products, Inc. |
| Sector: Health Care | |
| SubSector: Medical Instruments & Supplies | |
| MarketCap: 285.86 Millions | |
| Recent Price: 67.23 Smart Investing & Trading Score: 20 | |
| Day Percent Change: -0.58% Day Change: -0.39 | |
| Week Change: -2.08% Year-to-date Change: -20.2% | |
| UTMD Links: Profile News Message Board | |
| Charts:- Daily , Weekly | |
| Add UTMD to Watchlist: View: Get Complete UTMD Trend Analysis ➞ | |
 | MQ Marqeta, Inc. |
| Sector: Technology | |
| SubSector: Software - Infrastructure | |
| MarketCap: 2650 Millions | |
| Recent Price: 5.62 Smart Investing & Trading Score: 42 | |
| Day Percent Change: 4.17% Day Change: 0.23 | |
| Week Change: 3.22% Year-to-date Change: -20.2% | |
| MQ Links: Profile News Message Board | |
| Charts:- Daily , Weekly | |
| Add MQ to Watchlist: View: Get Complete MQ Trend Analysis ➞ | |
| Too many stocks? View smallcap stocks filtered by marketcap & sector |
| Marketcap: All SmallCap Stocks (default-no microcap), Large, Mid-Range, Small & MicroCap |
| Sector: Tech, Finance, Energy, Staples, Retail, Industrial, Materials, Utilities & Medical |
|
Best Stocks Today 12Stocks.com |
© 2024 12Stocks.com Terms & Conditions Privacy Contact Us
All Information Provided Only For Education And Not To Be Used For Investing or Trading. See Terms & Conditions


One More Thing ... Get Best Stocks Delivered Daily!
Never Ever Miss A Move With Our Top Ten Stocks Lists
Find Best Stocks In Any Market - Bull or Bear Market
Take A Peek At Our Top Ten Stocks Lists: Daily, Weekly, Year-to-Date & Top Trends
Find Best Stocks In Any Market - Bull or Bear Market
Take A Peek At Our Top Ten Stocks Lists: Daily, Weekly, Year-to-Date & Top Trends
Smallcap Stocks With Best Up Trends [0-bearish to 100-bullish]: Badger Meter[100], Cullinan Oncology[100], Oscar Health[100], NextNav [100], EchoStar [100], Victory Capital[100], Macatawa Bank[100], IMAX [100], Envestnet [100], ALX Oncology[100], Argan [95]
Best Smallcap Stocks Year-to-Date:
Agenus [500.31%], CareMax [417.53%], Janux [348.12%], Viking [247.5%], Alpine Immune[238.5%], Super Micro[226.63%], Longboard [194.76%], Arcutis Bio[192.57%], Vera [161.3%], Avidity Biosciences[154.87%], Hippo [128.32%] Best Smallcap Stocks This Week:
Macatawa Bank[44.42%], 23andMe Holding[33.3%], ProKidney [32%], Snap One[29.73%], Vertex Energy[25.96%], ALX Oncology[20.64%], Vanda [20.63%], Expensify [18.37%], Badger Meter[16.72%], ContextLogic [15%], Cullinan Oncology[13.89%] Best Smallcap Stocks Daily:
23andMe Holding[65.91%], Vertex Energy[33.78%], Zura Bio[17.20%], Badger Meter[16.65%], ContextLogic [15.81%], Expensify [15.23%], Montrose Environmental[12.84%], Vaxxinity [10.05%], Cipher Mining[8.65%], FiscalNote [8.61%], Vuzix [8.15%]