
 Login Sign Up


| |||||
 |  | ||||

| 12Stocks.com Market Intelligence |
Best SmallCap Stocks
|
| In a hurry? Small Cap Stock Lists: Performance Trends Table, Stock Charts
Sort Small Cap stocks: Daily, Weekly, Year-to-Date, Market Cap & Trends. Filter Small Cap stocks list by sector: Show all, Tech, Finance, Energy, Staples, Retail, Industrial, Materials, Utilities and HealthCare Filter Small Cap stocks list by size: All Large Medium Small and MicroCap |
| 12Stocks.com Small Cap Stocks Performances & Trends Daily | |||||||||
|
|  The overall Smart Investing & Trading Score is 23 (0-bearish to 100-bullish) which puts Small Cap index in short term bearish to neutral trend. The Smart Investing & Trading Score from previous trading session is 13 and hence an improvement of trend.
| ||||||||
Here are the Smart Investing & Trading Scores of the most requested small cap stocks at 12Stocks.com (click stock name for detailed review):
|


| 12Stocks.com: Investing in Smallcap Index with Stocks | |
|
The following table helps investors and traders sort through current performance and trends (as measured by Smart Investing & Trading Score) of various
stocks in the Smallcap Index. Quick View: Move mouse or cursor over stock symbol (ticker) to view short-term technical chart and over stock name to view long term chart. Click on  to add stock symbol to your watchlist and to add stock symbol to your watchlist and  to view watchlist. Click on any ticker or stock name for detailed market intelligence report for that stock. to view watchlist. Click on any ticker or stock name for detailed market intelligence report for that stock. |
12Stocks.com Performance of Stocks in Smallcap Index
| Ticker | Stock Name | Watchlist | Category | Recent Price | Smart Investing & Trading Score | Change % | YTD Change% |
| SCL | Stepan |   | Materials | 81.53 | 10 | -0.10% | -13.77% |
| FCBC | First Community | | Financials | 31.98 | 35 | 0.90% | -13.79% |
| PRO | PROS | | Technology | 33.44 | 10 | -0.71% | -13.79% |
| JBGS | JBG SMITH | | Financials | 14.65 | 17 | 1.00% | -13.84% |
| BXMT | Blackstone Mortgage | | Financials | 18.32 | 32 | 0.49% | -13.87% |
| METCB | Ramaco Resources | | Materials | 11.41 | 32 | 0.04% | -13.89% |
| CLDT | Chatham Lodging | | Financials | 9.23 | 17 | 0.76% | -13.90% |
| CBL | CBL & Associates Properties | | Financials | 21.02 | 0 | 0.10% | -13.92% |
| TBBK | Bancorp | | Financials | 33.19 | 57 | 1.05% | -13.94% |
| ONTF | ON24 | | Technology | 6.79 | 13 | 0.97% | -13.95% |
| RUSHB | Rush Enterprises | | Services & Goods | 45.57 | 20 | -0.07% | -13.99% |
| STRO | Sutro Biopharma | | Health Care | 3.69 | 10 | -2.89% | -13.99% |
| HVT | Haverty Furniture | | Services & Goods | 30.53 | 25 | 0.86% | -14.00% |
| PARR | Par Pacific | | Energy | 31.27 | 10 | -2.90% | -14.04% |
| IPAR | Inter Parfums | | Consumer Staples | 123.78 | 18 | 0.11% | -14.05% |
| ROIC | Retail Opportunity | | Financials | 12.06 | 10 | 0.63% | -14.08% |
| BOWL | Bowlero | | Services & Goods | 12.13 | 58 | 0.00% | -14.09% |
| HOPE | Hope Bancorp | | Financials | 10.37 | 20 | 0.88% | -14.16% |
| SAH | Sonic Automotive | | Services & Goods | 48.22 | 18 | -0.82% | -14.21% |
| IIIN | Insteel Industries | | Materials | 32.83 | 17 | 0.24% | -14.26% |
| LXU | LSB Industries | | Materials | 7.98 | 51 | 0.38% | -14.29% |
| CNS | Cohen & Steers | | Financials | 64.86 | 0 | -3.01% | -14.35% |
| ALKS | Alkermes | | Health Care | 23.75 | 10 | -1.08% | -14.38% |
| WISH | ContextLogic | | Services & Goods | 5.09 | 63 | 2.52% | -14.38% |
| PKOH | Park-Ohio | | Services & Goods | 23.08 | 10 | -0.99% | -14.39% |


| Too many stocks? View smallcap stocks filtered by marketcap & sector |
| Marketcap: All SmallCap Stocks (default-no microcap), Large, Mid-Range, Small |
| Smallcap Sector: Tech, Finance, Energy, Staples, Retail, Industrial, Materials, & Medical |
|
Get the most comprehensive stock market coverage daily at 12Stocks.com ➞ Best Stocks Today ➞ Best Stocks Weekly ➞ Best Stocks Year-to-Date ➞ Best Stocks Trends ➞  Best Stocks Today 12Stocks.com Best Nasdaq Stocks ➞ Best S&P 500 Stocks ➞ Best Tech Stocks ➞ Best Biotech Stocks ➞ |
| Detailed Overview of SmallCap Stocks |
| SmallCap Technical Overview, Leaders & Laggards, Top SmallCap ETF Funds & Detailed SmallCap Stocks List, Charts, Trends & More |
| Smallcap: Technical Analysis, Trends & YTD Performance | |
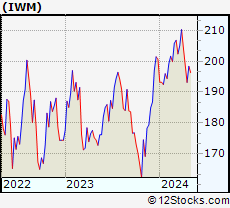
| SmallCap segment as represented by
IWM, an exchange-traded fund [ETF], holds basket of thousands of smallcap stocks from across all major sectors of the US stock market. The smallcap index (contains stocks like Riverbed & Sotheby's) is down by -3.99% and is currently underperforming the overall market by -8.02% year-to-date. Below is a quick view of technical charts and trends: | |
 IWM Weekly Chart |
|
| Long Term Trend: Not Good | |
| Medium Term Trend: Not Good | |
 IWM Daily Chart |
|
| Short Term Trend: Not Good | |
| Overall Trend Score: 23 | |
| YTD Performance: -3.99% | |
| **Trend Scores & Views Are Only For Educational Purposes And Not For Investing | |
| 12Stocks.com: Top Performing Small Cap Index Stocks | ||||||||||||||||||||||||||||||||||||||||||||||||
 The top performing Small Cap Index stocks year to date are
Now, more recently, over last week, the top performing Small Cap Index stocks on the move are


|
||||||||||||||||||||||||||||||||||||||||||||||||
| 12Stocks.com: Investing in Smallcap Index using Exchange Traded Funds | |
|
The following table shows list of key exchange traded funds (ETF) that
help investors track Smallcap index. The following list also includes leveraged ETF funds that track twice or thrice the daily returns of Smallcap indices. Short or inverse ETF funds move in the opposite direction to the index they track and are useful during market pullbacks or during bear markets. Quick View: Move mouse or cursor over ETF symbol (ticker) to view short-term technical chart and over ETF name to view long term chart. Click on ticker or stock name for detailed view. Click on to add stock symbol to your watchlist and to view watchlist. |
12Stocks.com List of ETFs that track Smallcap Index
| Ticker | ETF Name | Watchlist | Recent Price | Smart Investing & Trading Score | Change % | Week % | Year-to-date % |
| IWM | iShares Russell 2000 | | 192.71 | 23 | -0.15 | -3.01 | -3.99% |
| IJR | iShares Core S&P Small-Cap | | 102.18 | 31 | 0.05 | -2.23 | -5.61% |
| VTWO | Vanguard Russell 2000 ETF | | 77.90 | 23 | -0.19 | -3.01 | -3.95% |
| IWN | iShares Russell 2000 Value | | 146.15 | 10 | 0.08 | -2.81 | -5.91% |
| IWO | iShares Russell 2000 Growth | | 247.09 | 36 | -0.37 | -3.24 | -2.03% |
| IJS | iShares S&P Small-Cap 600 Value | | 94.40 | 10 | 0.30 | -1.84 | -8.41% |
| IJT | iShares S&P Small-Cap 600 Growth | | 122.58 | 23 | 0.61 | -1.76 | -2.05% |
| XSLV | PowerShares S&P SmallCap Low Volatil ETF | | 41.62 | 25 | 0.48 | -1.12 | -5.73% |
| SAA | ProShares Ultra SmallCap600 | | 21.71 | 10 | 0.25 | -3.75 | -12.97% |
| SMLV | SPDR SSGA US Small Cap Low Volatil ETF | | 104.02 | 18 | 0.34 | -0.95 | -7.56% |
| SBB | ProShares Short SmallCap600 | | 16.89 | 80 | 0.24 | 2.07 | 6.03% |
| SDD | ProShares UltraShort SmallCap600 | | 20.23 | 73 | -1.80 | 2.01 | 9.79% |
| 12Stocks.com: Charts, Trends, Fundamental Data and Performances of SmallCap Stocks | |
|
We now take in-depth look at all SmallCap stocks including charts, multi-period performances and overall trends (as measured by Smart Investing & Trading Score). One can sort SmallCap stocks (click link to choose) by Daily, Weekly and by Year-to-Date performances. Also, one can sort by size of the company or by market capitalization. |
| Select Your Default Chart Type: | |||||
| |||||
| Click on stock symbol or name for detailed view. Click on to add stock symbol to your watchlist and to view watchlist. Quick View: Move mouse or cursor over "Daily" to quickly view daily technical stock chart and over "Weekly" to view weekly technical stock chart. | |||||

 | SCL Stepan Company |
| Sector: Materials | |
| SubSector: Specialty Chemicals | |
| MarketCap: 1812.97 Millions | |
| Recent Price: 81.53 Smart Investing & Trading Score: 10 | |
| Day Percent Change: -0.10% Day Change: -0.08 | |
| Week Change: -3.06% Year-to-date Change: -13.8% | |
| SCL Links: Profile News Message Board | |
| Charts:- Daily , Weekly | |
| Add SCL to Watchlist: View: Get Complete SCL Trend Analysis ➞ | |
 | FCBC First Community Bankshares, Inc. |
| Sector: Financials | |
| SubSector: Regional - Mid-Atlantic Banks | |
| MarketCap: 393.459 Millions | |
| Recent Price: 31.98 Smart Investing & Trading Score: 35 | |
| Day Percent Change: 0.90% Day Change: 0.29 | |
| Week Change: -0.45% Year-to-date Change: -13.8% | |
| FCBC Links: Profile News Message Board | |
| Charts:- Daily , Weekly | |
| Add FCBC to Watchlist: View: Get Complete FCBC Trend Analysis ➞ | |
 | PRO PROS Holdings, Inc. |
| Sector: Technology | |
| SubSector: Application Software | |
| MarketCap: 1357.42 Millions | |
| Recent Price: 33.44 Smart Investing & Trading Score: 10 | |
| Day Percent Change: -0.71% Day Change: -0.24 | |
| Week Change: -6.44% Year-to-date Change: -13.8% | |
| PRO Links: Profile News Message Board | |
| Charts:- Daily , Weekly | |
| Add PRO to Watchlist: View: Get Complete PRO Trend Analysis ➞ | |
 | JBGS JBG SMITH Properties |
| Sector: Financials | |
| SubSector: Property Management | |
| MarketCap: 4335.32 Millions | |
| Recent Price: 14.65 Smart Investing & Trading Score: 17 | |
| Day Percent Change: 1.00% Day Change: 0.14 | |
| Week Change: -4.09% Year-to-date Change: -13.8% | |
| JBGS Links: Profile News Message Board | |
| Charts:- Daily , Weekly | |
| Add JBGS to Watchlist: View: Get Complete JBGS Trend Analysis ➞ | |
 | BXMT Blackstone Mortgage Trust, Inc. |
| Sector: Financials | |
| SubSector: Mortgage Investment | |
| MarketCap: 2820.69 Millions | |
| Recent Price: 18.32 Smart Investing & Trading Score: 32 | |
| Day Percent Change: 0.49% Day Change: 0.09 | |
| Week Change: -1.77% Year-to-date Change: -13.9% | |
| BXMT Links: Profile News Message Board | |
| Charts:- Daily , Weekly | |
| Add BXMT to Watchlist: View: Get Complete BXMT Trend Analysis ➞ | |
 | METCB Ramaco Resources, Inc. |
| Sector: Materials | |
| SubSector: Coking Coal | |
| MarketCap: 469 Millions | |
| Recent Price: 11.41 Smart Investing & Trading Score: 32 | |
| Day Percent Change: 0.04% Day Change: 0.01 | |
| Week Change: 0% Year-to-date Change: -13.9% | |
| METCB Links: Profile News Message Board | |
| Charts:- Daily , Weekly | |
| Add METCB to Watchlist: View: Get Complete METCB Trend Analysis ➞ | |
 | CLDT Chatham Lodging Trust |
| Sector: Financials | |
| SubSector: REIT - Hotel/Motel | |
| MarketCap: 274.734 Millions | |
| Recent Price: 9.23 Smart Investing & Trading Score: 17 | |
| Day Percent Change: 0.76% Day Change: 0.07 | |
| Week Change: -5.24% Year-to-date Change: -13.9% | |
| CLDT Links: Profile News Message Board | |
| Charts:- Daily , Weekly | |
| Add CLDT to Watchlist: View: Get Complete CLDT Trend Analysis ➞ | |
 | CBL CBL & Associates Properties, Inc. |
| Sector: Financials | |
| SubSector: REIT - Retail | |
| MarketCap: 690 Millions | |
| Recent Price: 21.02 Smart Investing & Trading Score: 0 | |
| Day Percent Change: 0.10% Day Change: 0.02 | |
| Week Change: -4.02% Year-to-date Change: -13.9% | |
| CBL Links: Profile News Message Board | |
| Charts:- Daily , Weekly | |
| Add CBL to Watchlist: View: Get Complete CBL Trend Analysis ➞ | |
 | TBBK The Bancorp, Inc. |
| Sector: Financials | |
| SubSector: Regional - Mid-Atlantic Banks | |
| MarketCap: 267.859 Millions | |
| Recent Price: 33.19 Smart Investing & Trading Score: 57 | |
| Day Percent Change: 1.05% Day Change: 0.34 | |
| Week Change: 5.42% Year-to-date Change: -13.9% | |
| TBBK Links: Profile News Message Board | |
| Charts:- Daily , Weekly | |
| Add TBBK to Watchlist: View: Get Complete TBBK Trend Analysis ➞ | |
 | ONTF ON24, Inc. |
| Sector: Technology | |
| SubSector: Software - Application | |
| MarketCap: 386 Millions | |
| Recent Price: 6.79 Smart Investing & Trading Score: 13 | |
| Day Percent Change: 0.97% Day Change: 0.07 | |
| Week Change: -2.93% Year-to-date Change: -14.0% | |
| ONTF Links: Profile News Message Board | |
| Charts:- Daily , Weekly | |
| Add ONTF to Watchlist: View: Get Complete ONTF Trend Analysis ➞ | |
 | RUSHB Rush Enterprises, Inc. |
| Sector: Services & Goods | |
| SubSector: Auto Dealerships | |
| MarketCap: 203.221 Millions | |
| Recent Price: 45.57 Smart Investing & Trading Score: 20 | |
| Day Percent Change: -0.07% Day Change: -0.03 | |
| Week Change: -6.25% Year-to-date Change: -14.0% | |
| RUSHB Links: Profile News Message Board | |
| Charts:- Daily , Weekly | |
| Add RUSHB to Watchlist: View: Get Complete RUSHB Trend Analysis ➞ | |
 | STRO Sutro Biopharma, Inc. |
| Sector: Health Care | |
| SubSector: Biotechnology | |
| MarketCap: 196.485 Millions | |
| Recent Price: 3.69 Smart Investing & Trading Score: 10 | |
| Day Percent Change: -2.89% Day Change: -0.11 | |
| Week Change: -10.87% Year-to-date Change: -14.0% | |
| STRO Links: Profile News Message Board | |
| Charts:- Daily , Weekly | |
| Add STRO to Watchlist: View: Get Complete STRO Trend Analysis ➞ | |
 | HVT Haverty Furniture Companies, Inc. |
| Sector: Services & Goods | |
| SubSector: Home Furnishing Stores | |
| MarketCap: 253.125 Millions | |
| Recent Price: 30.53 Smart Investing & Trading Score: 25 | |
| Day Percent Change: 0.86% Day Change: 0.26 | |
| Week Change: -0.46% Year-to-date Change: -14.0% | |
| HVT Links: Profile News Message Board | |
| Charts:- Daily , Weekly | |
| Add HVT to Watchlist: View: Get Complete HVT Trend Analysis ➞ | |
 | PARR Par Pacific Holdings, Inc. |
| Sector: Energy | |
| SubSector: Oil & Gas Refining & Marketing | |
| MarketCap: 443.154 Millions | |
| Recent Price: 31.27 Smart Investing & Trading Score: 10 | |
| Day Percent Change: -2.90% Day Change: -0.94 | |
| Week Change: -9.46% Year-to-date Change: -14.0% | |
| PARR Links: Profile News Message Board | |
| Charts:- Daily , Weekly | |
| Add PARR to Watchlist: View: Get Complete PARR Trend Analysis ➞ | |
 | IPAR Inter Parfums, Inc. |
| Sector: Consumer Staples | |
| SubSector: Personal Products | |
| MarketCap: 1302.55 Millions | |
| Recent Price: 123.78 Smart Investing & Trading Score: 18 | |
| Day Percent Change: 0.11% Day Change: 0.14 | |
| Week Change: -2.06% Year-to-date Change: -14.1% | |
| IPAR Links: Profile News Message Board | |
| Charts:- Daily , Weekly | |
| Add IPAR to Watchlist: View: Get Complete IPAR Trend Analysis ➞ | |
 | ROIC Retail Opportunity Investments Corp. |
| Sector: Financials | |
| SubSector: REIT - Retail | |
| MarketCap: 943.414 Millions | |
| Recent Price: 12.06 Smart Investing & Trading Score: 10 | |
| Day Percent Change: 0.63% Day Change: 0.07 | |
| Week Change: -3.02% Year-to-date Change: -14.1% | |
| ROIC Links: Profile News Message Board | |
| Charts:- Daily , Weekly | |
| Add ROIC to Watchlist: View: Get Complete ROIC Trend Analysis ➞ | |
 | BOWL Bowlero Corp. |
| Sector: Services & Goods | |
| SubSector: Leisure | |
| MarketCap: 2000 Millions | |
| Recent Price: 12.13 Smart Investing & Trading Score: 58 | |
| Day Percent Change: 0.00% Day Change: 0.00 | |
| Week Change: -1.7% Year-to-date Change: -14.1% | |
| BOWL Links: Profile News Message Board | |
| Charts:- Daily , Weekly | |
| Add BOWL to Watchlist: View: Get Complete BOWL Trend Analysis ➞ | |
 | HOPE Hope Bancorp, Inc. |
| Sector: Financials | |
| SubSector: Regional - Pacific Banks | |
| MarketCap: 1099.29 Millions | |
| Recent Price: 10.37 Smart Investing & Trading Score: 20 | |
| Day Percent Change: 0.88% Day Change: 0.09 | |
| Week Change: -1.89% Year-to-date Change: -14.2% | |
| HOPE Links: Profile News Message Board | |
| Charts:- Daily , Weekly | |
| Add HOPE to Watchlist: View: Get Complete HOPE Trend Analysis ➞ | |
 | SAH Sonic Automotive, Inc. |
| Sector: Services & Goods | |
| SubSector: Auto Dealerships | |
| MarketCap: 581.321 Millions | |
| Recent Price: 48.22 Smart Investing & Trading Score: 18 | |
| Day Percent Change: -0.82% Day Change: -0.40 | |
| Week Change: -3.37% Year-to-date Change: -14.2% | |
| SAH Links: Profile News Message Board | |
| Charts:- Daily , Weekly | |
| Add SAH to Watchlist: View: Get Complete SAH Trend Analysis ➞ | |
 | IIIN Insteel Industries, Inc. |
| Sector: Materials | |
| SubSector: Steel & Iron | |
| MarketCap: 269.488 Millions | |
| Recent Price: 32.83 Smart Investing & Trading Score: 17 | |
| Day Percent Change: 0.24% Day Change: 0.08 | |
| Week Change: -4.62% Year-to-date Change: -14.3% | |
| IIIN Links: Profile News Message Board | |
| Charts:- Daily , Weekly | |
| Add IIIN to Watchlist: View: Get Complete IIIN Trend Analysis ➞ | |
 | LXU LSB Industries, Inc. |
| Sector: Materials | |
| SubSector: Chemicals - Major Diversified | |
| MarketCap: 51.7736 Millions | |
| Recent Price: 7.98 Smart Investing & Trading Score: 51 | |
| Day Percent Change: 0.38% Day Change: 0.03 | |
| Week Change: -2.21% Year-to-date Change: -14.3% | |
| LXU Links: Profile News Message Board | |
| Charts:- Daily , Weekly | |
| Add LXU to Watchlist: View: Get Complete LXU Trend Analysis ➞ | |
 | CNS Cohen & Steers, Inc. |
| Sector: Financials | |
| SubSector: Asset Management | |
| MarketCap: 2082.43 Millions | |
| Recent Price: 64.86 Smart Investing & Trading Score: 0 | |
| Day Percent Change: -3.01% Day Change: -2.01 | |
| Week Change: -7.26% Year-to-date Change: -14.4% | |
| CNS Links: Profile News Message Board | |
| Charts:- Daily , Weekly | |
| Add CNS to Watchlist: View: Get Complete CNS Trend Analysis ➞ | |
 | ALKS Alkermes plc |
| Sector: Health Care | |
| SubSector: Biotechnology | |
| MarketCap: 2311.95 Millions | |
| Recent Price: 23.75 Smart Investing & Trading Score: 10 | |
| Day Percent Change: -1.08% Day Change: -0.26 | |
| Week Change: -2.74% Year-to-date Change: -14.4% | |
| ALKS Links: Profile News Message Board | |
| Charts:- Daily , Weekly | |
| Add ALKS to Watchlist: View: Get Complete ALKS Trend Analysis ➞ | |
 | WISH ContextLogic Inc. |
| Sector: Services & Goods | |
| SubSector: Internet Retail | |
| MarketCap: 165 Millions | |
| Recent Price: 5.09 Smart Investing & Trading Score: 63 | |
| Day Percent Change: 2.52% Day Change: 0.13 | |
| Week Change: 1.8% Year-to-date Change: -14.4% | |
| WISH Links: Profile News Message Board | |
| Charts:- Daily , Weekly | |
| Add WISH to Watchlist: View: Get Complete WISH Trend Analysis ➞ | |
 | PKOH Park-Ohio Holdings Corp. |
| Sector: Services & Goods | |
| SubSector: Industrial Equipment Wholesale | |
| MarketCap: 214.358 Millions | |
| Recent Price: 23.08 Smart Investing & Trading Score: 10 | |
| Day Percent Change: -0.99% Day Change: -0.23 | |
| Week Change: -8.67% Year-to-date Change: -14.4% | |
| PKOH Links: Profile News Message Board | |
| Charts:- Daily , Weekly | |
| Add PKOH to Watchlist: View: Get Complete PKOH Trend Analysis ➞ | |
| Too many stocks? View smallcap stocks filtered by marketcap & sector |
| Marketcap: All SmallCap Stocks (default-no microcap), Large, Mid-Range, Small & MicroCap |
| Sector: Tech, Finance, Energy, Staples, Retail, Industrial, Materials, Utilities & Medical |
|
Best Stocks Today 12Stocks.com |
© 2024 12Stocks.com Terms & Conditions Privacy Contact Us
All Information Provided Only For Education And Not To Be Used For Investing or Trading. See Terms & Conditions


One More Thing ... Get Best Stocks Delivered Daily!
Never Ever Miss A Move With Our Top Ten Stocks Lists
Find Best Stocks In Any Market - Bull or Bear Market
Take A Peek At Our Top Ten Stocks Lists: Daily, Weekly, Year-to-Date & Top Trends
Find Best Stocks In Any Market - Bull or Bear Market
Take A Peek At Our Top Ten Stocks Lists: Daily, Weekly, Year-to-Date & Top Trends
Smallcap Stocks With Best Up Trends [0-bearish to 100-bullish]: Badger Meter[100], Cullinan Oncology[100], Oscar Health[100], NextNav [100], Geron [100], Richardson Electronics[100], Seneca Foods[100], Lantheus [100], Macatawa Bank[100], Regional Management[100], IMAX [100]
Best Smallcap Stocks Year-to-Date:
Agenus [511.18%], CareMax [417.53%], Janux [348.12%], Viking [248.9%], Alpine Immune[238.6%], Super Micro[230.42%], Arcutis Bio[203.72%], Longboard [184.12%], Vera [161.3%], Avidity Biosciences[159.18%], Hippo [128.32%] Best Smallcap Stocks This Week:
Macatawa Bank[44.47%], 23andMe Holding[33.3%], ProKidney [32%], Snap One[29.73%], Vertex Energy[23.08%], ALX Oncology[22.79%], Vanda [20.63%], Expensify [18.37%], Badger Meter[15.7%], Cullinan Oncology[13.89%], Humacyte [12.67%] Best Smallcap Stocks Daily:
23andMe Holding[65.91%], Vertex Energy[30.72%], Badger Meter[15.63%], Expensify [15.23%], Zura Bio[10.99%], Vaxxinity [10.05%], Vuzix [9.87%], Montrose Environmental[8.91%], Cipher Mining[8.65%], FiscalNote [8.61%], Barnes Group[8.48%]