
 Login Sign Up


| |||||
 |  | ||||

| 12Stocks.com Market Intelligence |
Best SmallCap Stocks
|
| In a hurry? Small Cap Stock Lists: Performance Trends Table, Stock Charts
Sort Small Cap stocks: Daily, Weekly, Year-to-Date, Market Cap & Trends. Filter Small Cap stocks list by sector: Show all, Tech, Finance, Energy, Staples, Retail, Industrial, Materials, Utilities and HealthCare Filter Small Cap stocks list by size: All Large Medium Small and MicroCap |
| 12Stocks.com Small Cap Stocks Performances & Trends Daily | |||||||||
|
|  The overall Smart Investing & Trading Score is 58 (0-bearish to 100-bullish) which puts Small Cap index in short term neutral trend. The Smart Investing & Trading Score from previous trading session is 63 and hence a deterioration of trend.
| ||||||||
Here are the Smart Investing & Trading Scores of the most requested small cap stocks at 12Stocks.com (click stock name for detailed review):
|


| 12Stocks.com: Investing in Smallcap Index with Stocks | |
|
The following table helps investors and traders sort through current performance and trends (as measured by Smart Investing & Trading Score) of various
stocks in the Smallcap Index. Quick View: Move mouse or cursor over stock symbol (ticker) to view short-term technical chart and over stock name to view long term chart. Click on  to add stock symbol to your watchlist and to add stock symbol to your watchlist and  to view watchlist. Click on any ticker or stock name for detailed market intelligence report for that stock. to view watchlist. Click on any ticker or stock name for detailed market intelligence report for that stock. |
12Stocks.com Performance of Stocks in Smallcap Index
| Ticker | Stock Name | Watchlist | Category | Recent Price | Smart Investing & Trading Score | Change % | YTD Change% |
| DHIL | Diamond Hill |   | Financials | 151.98 | 55 | 0.40% | -8.22% |
| AMSWA | American | | Technology | 10.37 | 10 | -1.33% | -8.23% |
| PMT | PennyMac Mortgage | | Financials | 13.72 | 39 | -1.37% | -8.23% |
| CRDO | Credo | | Technology | 17.95 | 32 | 2.22% | -8.23% |
| HROW | Harrow Health | | Health Care | 10.28 | 46 | -0.44% | -8.26% |
| GBTG | Global Business | | Technology | 5.99 | 60 | -0.17% | -8.27% |
| HVT | Haverty Furniture | | Services & Goods | 32.55 | 74 | -0.76% | -8.31% |
| NABL | N-able | | Technology | 12.19 | 17 | -0.49% | -8.38% |
| HOPE | Hope Bancorp | | Financials | 11.07 | 67 | 0.59% | -8.40% |
| SNBR | Sleep Number | | Consumer Staples | 13.58 | 68 | -6.99% | -8.43% |
| BTAI | BioXcel | | Health Care | 2.70 | 47 | -9.09% | -8.47% |
| FMBH | First Mid | | Financials | 31.70 | 52 | 0.19% | -8.54% |
| FLYW | Flywire | | Technology | 21.43 | 52 | 0.14% | -8.54% |
| EXPO | Exponent | | Services & Goods | 80.50 | 67 | 0.17% | -8.56% |
| PTCT | PTC | | Health Care | 25.19 | 28 | -0.87% | -8.60% |
| MBWM | Mercantile Bank | | Financials | 36.90 | 42 | -0.14% | -8.62% |
| UE | Urban Edge | | Financials | 16.72 | 62 | -0.59% | -8.63% |
| SNCY | Sun Country | | Industrials | 14.45 | 68 | -2.46% | -8.63% |
| PCYO | Pure Cycle | | Utilities | 9.56 | 67 | -1.09% | -8.64% |
| SEER | Seer | | Health Care | 1.78 | 42 | -1.66% | -8.72% |
| LADR | Ladder Capital | | Financials | 10.50 | 25 | -1.50% | -8.77% |
| CLAR | Clarus | | Consumer Staples | 6.29 | 61 | 2.28% | -8.77% |
| DIN | Dine Brands | | Services & Goods | 45.29 | 74 | 0.31% | -8.78% |
| CARA | Cara | | Health Care | 0.68 | 61 | -4.16% | -8.79% |
| HIFS | Hingham Institution | | Financials | 177.26 | 74 | 1.18% | -8.81% |


| Too many stocks? View smallcap stocks filtered by marketcap & sector |
| Marketcap: All SmallCap Stocks (default-no microcap), Large, Mid-Range, Small |
| Smallcap Sector: Tech, Finance, Energy, Staples, Retail, Industrial, Materials, & Medical |
|
Get the most comprehensive stock market coverage daily at 12Stocks.com ➞ Best Stocks Today ➞ Best Stocks Weekly ➞ Best Stocks Year-to-Date ➞ Best Stocks Trends ➞  Best Stocks Today 12Stocks.com Best Nasdaq Stocks ➞ Best S&P 500 Stocks ➞ Best Tech Stocks ➞ Best Biotech Stocks ➞ |
| Detailed Overview of SmallCap Stocks |
| SmallCap Technical Overview, Leaders & Laggards, Top SmallCap ETF Funds & Detailed SmallCap Stocks List, Charts, Trends & More |
| Smallcap: Technical Analysis, Trends & YTD Performance | |
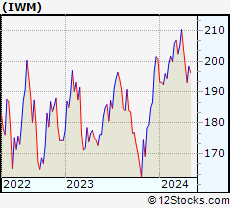
| SmallCap segment as represented by
IWM, an exchange-traded fund [ETF], holds basket of thousands of smallcap stocks from across all major sectors of the US stock market. The smallcap index (contains stocks like Riverbed & Sotheby's) is down by -1.51% and is currently underperforming the overall market by -7.17% year-to-date. Below is a quick view of technical charts and trends: | |
 IWM Weekly Chart |
|
| Long Term Trend: Good | |
| Medium Term Trend: Not Good | |
 IWM Daily Chart |
|
| Short Term Trend: Very Good | |
| Overall Trend Score: 58 | |
| YTD Performance: -1.51% | |
| **Trend Scores & Views Are Only For Educational Purposes And Not For Investing | |
| 12Stocks.com: Top Performing Small Cap Index Stocks | ||||||||||||||||||||||||||||||||||||||||||||||||
 The top performing Small Cap Index stocks year to date are
Now, more recently, over last week, the top performing Small Cap Index stocks on the move are


|
||||||||||||||||||||||||||||||||||||||||||||||||
| 12Stocks.com: Investing in Smallcap Index using Exchange Traded Funds | |
|
The following table shows list of key exchange traded funds (ETF) that
help investors track Smallcap index. The following list also includes leveraged ETF funds that track twice or thrice the daily returns of Smallcap indices. Short or inverse ETF funds move in the opposite direction to the index they track and are useful during market pullbacks or during bear markets. Quick View: Move mouse or cursor over ETF symbol (ticker) to view short-term technical chart and over ETF name to view long term chart. Click on ticker or stock name for detailed view. Click on to add stock symbol to your watchlist and to view watchlist. |
12Stocks.com List of ETFs that track Smallcap Index
| Ticker | ETF Name | Watchlist | Recent Price | Smart Investing & Trading Score | Change % | Week % | Year-to-date % |
| IWM | iShares Russell 2000 | | 197.68 | 58 | -0.45 | 2.35 | -1.51% |
| IJR | iShares Core S&P Small-Cap | | 105.71 | 85 | -0.24 | 2.41 | -2.35% |
| VTWO | Vanguard Russell 2000 ETF | | 79.95 | 48 | -0.42 | 2.39 | -1.42% |
| IWN | iShares Russell 2000 Value | | 151.28 | 75 | -0.30 | 2.37 | -2.61% |
| IWO | iShares Russell 2000 Growth | | 251.27 | 58 | -0.44 | 2.44 | -0.38% |
| IJS | iShares S&P Small-Cap 600 Value | | 97.71 | 45 | -0.43 | 2.2 | -5.2% |
| IJT | iShares S&P Small-Cap 600 Growth | | 125.60 | 48 | -0.10 | 2.77 | 0.37% |
| XSLV | PowerShares S&P SmallCap Low Volatil ETF | | 42.81 | 48 | -0.57 | 1.48 | -3.05% |
| SBB | ProShares Short SmallCap600 | | 16.37 | 33 | -0.02 | -2.79 | 2.76% |
| SMLV | SPDR SSGA US Small Cap Low Volatil ETF | | 108.43 | 73 | -0.31 | 2.21 | -3.63% |
| SAA | ProShares Ultra SmallCap600 | | 23.01 | 58 | -0.60 | 5.55 | -7.78% |
| SDD | ProShares UltraShort SmallCap600 | | 19.49 | 42 | 1.35 | -4.18 | 5.77% |
| 12Stocks.com: Charts, Trends, Fundamental Data and Performances of SmallCap Stocks | |
|
We now take in-depth look at all SmallCap stocks including charts, multi-period performances and overall trends (as measured by Smart Investing & Trading Score). One can sort SmallCap stocks (click link to choose) by Daily, Weekly and by Year-to-Date performances. Also, one can sort by size of the company or by market capitalization. |
| Select Your Default Chart Type: | |||||
| |||||
| Click on stock symbol or name for detailed view. Click on to add stock symbol to your watchlist and to view watchlist. Quick View: Move mouse or cursor over "Daily" to quickly view daily technical stock chart and over "Weekly" to view weekly technical stock chart. | |||||

 | DHIL Diamond Hill Investment Group, Inc. |
| Sector: Financials | |
| SubSector: Asset Management | |
| MarketCap: 316.203 Millions | |
| Recent Price: 151.98 Smart Investing & Trading Score: 55 | |
| Day Percent Change: 0.40% Day Change: 0.61 | |
| Week Change: 0.76% Year-to-date Change: -8.2% | |
| DHIL Links: Profile News Message Board | |
| Charts:- Daily , Weekly | |
| Add DHIL to Watchlist: View: Get Complete DHIL Trend Analysis ➞ | |
 | AMSWA American Software, Inc. |
| Sector: Technology | |
| SubSector: Application Software | |
| MarketCap: 389.862 Millions | |
| Recent Price: 10.37 Smart Investing & Trading Score: 10 | |
| Day Percent Change: -1.33% Day Change: -0.14 | |
| Week Change: -2.35% Year-to-date Change: -8.2% | |
| AMSWA Links: Profile News Message Board | |
| Charts:- Daily , Weekly | |
| Add AMSWA to Watchlist: View: Get Complete AMSWA Trend Analysis ➞ | |
 | PMT PennyMac Mortgage Investment Trust |
| Sector: Financials | |
| SubSector: Mortgage Investment | |
| MarketCap: 917.639 Millions | |
| Recent Price: 13.72 Smart Investing & Trading Score: 39 | |
| Day Percent Change: -1.37% Day Change: -0.19 | |
| Week Change: 1.18% Year-to-date Change: -8.2% | |
| PMT Links: Profile News Message Board | |
| Charts:- Daily , Weekly | |
| Add PMT to Watchlist: View: Get Complete PMT Trend Analysis ➞ | |
 | CRDO Credo Technology Group Holding Ltd |
| Sector: Technology | |
| SubSector: Communication Equipment | |
| MarketCap: 2590 Millions | |
| Recent Price: 17.95 Smart Investing & Trading Score: 32 | |
| Day Percent Change: 2.22% Day Change: 0.39 | |
| Week Change: 6.09% Year-to-date Change: -8.2% | |
| CRDO Links: Profile News Message Board | |
| Charts:- Daily , Weekly | |
| Add CRDO to Watchlist: View: Get Complete CRDO Trend Analysis ➞ | |
 | HROW Harrow Health, Inc. |
| Sector: Health Care | |
| SubSector: Drug Manufacturers - Other | |
| MarketCap: 104.033 Millions | |
| Recent Price: 10.28 Smart Investing & Trading Score: 46 | |
| Day Percent Change: -0.44% Day Change: -0.04 | |
| Week Change: -1.49% Year-to-date Change: -8.3% | |
| HROW Links: Profile News Message Board | |
| Charts:- Daily , Weekly | |
| Add HROW to Watchlist: View: Get Complete HROW Trend Analysis ➞ | |
 | GBTG Global Business Travel Group, Inc. |
| Sector: Technology | |
| SubSector: Software - Application | |
| MarketCap: 3440 Millions | |
| Recent Price: 5.99 Smart Investing & Trading Score: 60 | |
| Day Percent Change: -0.17% Day Change: -0.01 | |
| Week Change: -0.17% Year-to-date Change: -8.3% | |
| GBTG Links: Profile News Message Board | |
| Charts:- Daily , Weekly | |
| Add GBTG to Watchlist: View: Get Complete GBTG Trend Analysis ➞ | |
 | HVT Haverty Furniture Companies, Inc. |
| Sector: Services & Goods | |
| SubSector: Home Furnishing Stores | |
| MarketCap: 253.125 Millions | |
| Recent Price: 32.55 Smart Investing & Trading Score: 74 | |
| Day Percent Change: -0.76% Day Change: -0.25 | |
| Week Change: 4.46% Year-to-date Change: -8.3% | |
| HVT Links: Profile News Message Board | |
| Charts:- Daily , Weekly | |
| Add HVT to Watchlist: View: Get Complete HVT Trend Analysis ➞ | |
 | NABL N-able, Inc. |
| Sector: Technology | |
| SubSector: Information Technology Services | |
| MarketCap: 2590 Millions | |
| Recent Price: 12.19 Smart Investing & Trading Score: 17 | |
| Day Percent Change: -0.49% Day Change: -0.06 | |
| Week Change: 0% Year-to-date Change: -8.4% | |
| NABL Links: Profile News Message Board | |
| Charts:- Daily , Weekly | |
| Add NABL to Watchlist: View: Get Complete NABL Trend Analysis ➞ | |
 | HOPE Hope Bancorp, Inc. |
| Sector: Financials | |
| SubSector: Regional - Pacific Banks | |
| MarketCap: 1099.29 Millions | |
| Recent Price: 11.07 Smart Investing & Trading Score: 67 | |
| Day Percent Change: 0.59% Day Change: 0.06 | |
| Week Change: 3.22% Year-to-date Change: -8.4% | |
| HOPE Links: Profile News Message Board | |
| Charts:- Daily , Weekly | |
| Add HOPE to Watchlist: View: Get Complete HOPE Trend Analysis ➞ | |
 | SNBR Sleep Number Corporation |
| Sector: Consumer Staples | |
| SubSector: Home Furnishings & Fixtures | |
| MarketCap: 692.735 Millions | |
| Recent Price: 13.58 Smart Investing & Trading Score: 68 | |
| Day Percent Change: -6.99% Day Change: -1.02 | |
| Week Change: -0.22% Year-to-date Change: -8.4% | |
| SNBR Links: Profile News Message Board | |
| Charts:- Daily , Weekly | |
| Add SNBR to Watchlist: View: Get Complete SNBR Trend Analysis ➞ | |
 | BTAI BioXcel Therapeutics, Inc. |
| Sector: Health Care | |
| SubSector: Biotechnology | |
| MarketCap: 487.485 Millions | |
| Recent Price: 2.70 Smart Investing & Trading Score: 47 | |
| Day Percent Change: -9.09% Day Change: -0.27 | |
| Week Change: -2.53% Year-to-date Change: -8.5% | |
| BTAI Links: Profile News Message Board | |
| Charts:- Daily , Weekly | |
| Add BTAI to Watchlist: View: Get Complete BTAI Trend Analysis ➞ | |
 | FMBH First Mid Bancshares, Inc. |
| Sector: Financials | |
| SubSector: Regional - Midwest Banks | |
| MarketCap: 373.27 Millions | |
| Recent Price: 31.70 Smart Investing & Trading Score: 52 | |
| Day Percent Change: 0.19% Day Change: 0.06 | |
| Week Change: 1.83% Year-to-date Change: -8.5% | |
| FMBH Links: Profile News Message Board | |
| Charts:- Daily , Weekly | |
| Add FMBH to Watchlist: View: Get Complete FMBH Trend Analysis ➞ | |
 | FLYW Flywire Corporation |
| Sector: Technology | |
| SubSector: Software - Infrastructure | |
| MarketCap: 3390 Millions | |
| Recent Price: 21.43 Smart Investing & Trading Score: 52 | |
| Day Percent Change: 0.14% Day Change: 0.03 | |
| Week Change: 1.56% Year-to-date Change: -8.5% | |
| FLYW Links: Profile News Message Board | |
| Charts:- Daily , Weekly | |
| Add FLYW to Watchlist: View: Get Complete FLYW Trend Analysis ➞ | |
 | EXPO Exponent, Inc. |
| Sector: Services & Goods | |
| SubSector: Management Services | |
| MarketCap: 3605.95 Millions | |
| Recent Price: 80.50 Smart Investing & Trading Score: 67 | |
| Day Percent Change: 0.17% Day Change: 0.14 | |
| Week Change: 1.68% Year-to-date Change: -8.6% | |
| EXPO Links: Profile News Message Board | |
| Charts:- Daily , Weekly | |
| Add EXPO to Watchlist: View: Get Complete EXPO Trend Analysis ➞ | |
 | PTCT PTC Therapeutics, Inc. |
| Sector: Health Care | |
| SubSector: Biotechnology | |
| MarketCap: 2795.85 Millions | |
| Recent Price: 25.19 Smart Investing & Trading Score: 28 | |
| Day Percent Change: -0.87% Day Change: -0.22 | |
| Week Change: -0.51% Year-to-date Change: -8.6% | |
| PTCT Links: Profile News Message Board | |
| Charts:- Daily , Weekly | |
| Add PTCT to Watchlist: View: Get Complete PTCT Trend Analysis ➞ | |
 | MBWM Mercantile Bank Corporation |
| Sector: Financials | |
| SubSector: Regional - Midwest Banks | |
| MarketCap: 372.77 Millions | |
| Recent Price: 36.90 Smart Investing & Trading Score: 42 | |
| Day Percent Change: -0.14% Day Change: -0.05 | |
| Week Change: 2.3% Year-to-date Change: -8.6% | |
| MBWM Links: Profile News Message Board | |
| Charts:- Daily , Weekly | |
| Add MBWM to Watchlist: View: Get Complete MBWM Trend Analysis ➞ | |
 | UE Urban Edge Properties |
| Sector: Financials | |
| SubSector: REIT - Diversified | |
| MarketCap: 1112.33 Millions | |
| Recent Price: 16.72 Smart Investing & Trading Score: 62 | |
| Day Percent Change: -0.59% Day Change: -0.10 | |
| Week Change: 2.14% Year-to-date Change: -8.6% | |
| UE Links: Profile News Message Board | |
| Charts:- Daily , Weekly | |
| Add UE to Watchlist: View: Get Complete UE Trend Analysis ➞ | |
 | SNCY Sun Country Airlines Holdings, Inc. |
| Sector: Industrials | |
| SubSector: Airlines | |
| MarketCap: 1230 Millions | |
| Recent Price: 14.45 Smart Investing & Trading Score: 68 | |
| Day Percent Change: -2.46% Day Change: -0.37 | |
| Week Change: -2.82% Year-to-date Change: -8.6% | |
| SNCY Links: Profile News Message Board | |
| Charts:- Daily , Weekly | |
| Add SNCY to Watchlist: View: Get Complete SNCY Trend Analysis ➞ | |
 | PCYO Pure Cycle Corporation |
| Sector: Utilities | |
| SubSector: Water Utilities | |
| MarketCap: 247.102 Millions | |
| Recent Price: 9.56 Smart Investing & Trading Score: 67 | |
| Day Percent Change: -1.09% Day Change: -0.11 | |
| Week Change: 0.37% Year-to-date Change: -8.6% | |
| PCYO Links: Profile News Message Board | |
| Charts:- Daily , Weekly | |
| Add PCYO to Watchlist: View: Get Complete PCYO Trend Analysis ➞ | |
 | SEER Seer, Inc. |
| Sector: Health Care | |
| SubSector: Biotechnology | |
| MarketCap: 48287 Millions | |
| Recent Price: 1.78 Smart Investing & Trading Score: 42 | |
| Day Percent Change: -1.66% Day Change: -0.03 | |
| Week Change: 4.09% Year-to-date Change: -8.7% | |
| SEER Links: Profile News Message Board | |
| Charts:- Daily , Weekly | |
| Add SEER to Watchlist: View: Get Complete SEER Trend Analysis ➞ | |
 | LADR Ladder Capital Corp |
| Sector: Financials | |
| SubSector: Mortgage Investment | |
| MarketCap: 660.039 Millions | |
| Recent Price: 10.50 Smart Investing & Trading Score: 25 | |
| Day Percent Change: -1.50% Day Change: -0.16 | |
| Week Change: 0.19% Year-to-date Change: -8.8% | |
| LADR Links: Profile News Message Board | |
| Charts:- Daily , Weekly | |
| Add LADR to Watchlist: View: Get Complete LADR Trend Analysis ➞ | |
 | CLAR Clarus Corporation |
| Sector: Consumer Staples | |
| SubSector: Sporting Goods | |
| MarketCap: 290.144 Millions | |
| Recent Price: 6.29 Smart Investing & Trading Score: 61 | |
| Day Percent Change: 2.28% Day Change: 0.14 | |
| Week Change: 0.96% Year-to-date Change: -8.8% | |
| CLAR Links: Profile News Message Board | |
| Charts:- Daily , Weekly | |
| Add CLAR to Watchlist: View: Get Complete CLAR Trend Analysis ➞ | |
 | DIN Dine Brands Global, Inc. |
| Sector: Services & Goods | |
| SubSector: Restaurants | |
| MarketCap: 421.17 Millions | |
| Recent Price: 45.29 Smart Investing & Trading Score: 74 | |
| Day Percent Change: 0.31% Day Change: 0.14 | |
| Week Change: 4.48% Year-to-date Change: -8.8% | |
| DIN Links: Profile News Message Board | |
| Charts:- Daily , Weekly | |
| Add DIN to Watchlist: View: Get Complete DIN Trend Analysis ➞ | |
 | CARA Cara Therapeutics, Inc. |
| Sector: Health Care | |
| SubSector: Biotechnology | |
| MarketCap: 597.985 Millions | |
| Recent Price: 0.68 Smart Investing & Trading Score: 61 | |
| Day Percent Change: -4.16% Day Change: -0.03 | |
| Week Change: 2.53% Year-to-date Change: -8.8% | |
| CARA Links: Profile News Message Board | |
| Charts:- Daily , Weekly | |
| Add CARA to Watchlist: View: Get Complete CARA Trend Analysis ➞ | |
 | HIFS Hingham Institution for Savings |
| Sector: Financials | |
| SubSector: Savings & Loans | |
| MarketCap: 341.93 Millions | |
| Recent Price: 177.26 Smart Investing & Trading Score: 74 | |
| Day Percent Change: 1.18% Day Change: 2.07 | |
| Week Change: 3.89% Year-to-date Change: -8.8% | |
| HIFS Links: Profile News Message Board | |
| Charts:- Daily , Weekly | |
| Add HIFS to Watchlist: View: Get Complete HIFS Trend Analysis ➞ | |
| Too many stocks? View smallcap stocks filtered by marketcap & sector |
| Marketcap: All SmallCap Stocks (default-no microcap), Large, Mid-Range, Small & MicroCap |
| Sector: Tech, Finance, Energy, Staples, Retail, Industrial, Materials, Utilities & Medical |
|
Best Stocks Today 12Stocks.com |
© 2024 12Stocks.com Terms & Conditions Privacy Contact Us
All Information Provided Only For Education And Not To Be Used For Investing or Trading. See Terms & Conditions


One More Thing ... Get Best Stocks Delivered Daily!
Never Ever Miss A Move With Our Top Ten Stocks Lists
Find Best Stocks In Any Market - Bull or Bear Market
Take A Peek At Our Top Ten Stocks Lists: Daily, Weekly, Year-to-Date & Top Trends
Find Best Stocks In Any Market - Bull or Bear Market
Take A Peek At Our Top Ten Stocks Lists: Daily, Weekly, Year-to-Date & Top Trends
Smallcap Stocks With Best Up Trends [0-bearish to 100-bullish]: B. Riley[100], Ribbon [100], Group 1[100], Trustmark [100], MBIA [100], Integer [100], EchoStar [100], Vishay Inter[100], Comstock Resources[100], Jamf Holding[100], SunOpta [100]
Best Smallcap Stocks Year-to-Date:
CareMax [574.23%], Janux [352.07%], Viking [249.44%], Alpine Immune[239.13%], Longboard [223.4%], Avidity Biosciences[177.71%], Arcutis Bio[171.21%], Super Micro[165.69%], Vera [149.61%], Hippo [130.79%], Y-mAbs [123.75%] Best Smallcap Stocks This Week:
Matterport [166.09%], B. Riley[49.37%], Seres [30.29%], Riot Blockchain[30.07%], CareMax [27.24%], Ribbon [25.78%], ProKidney [23.28%], SoundHound AI[22.54%], Cipher Mining[22.14%], Hibbett Sports[21.56%], Cullinan Oncology[20.69%] Best Smallcap Stocks Daily:
B. Riley[37.48%], Ribbon [26.26%], Babcock & Wilcox Enterprises[15.57%], Cullinan Oncology[13.55%], Amneal [12.41%], Gritstone Oncology[11.01%], Comtech Tele[10.76%], Innodata [9.76%], Navitas Semiconductor[8.83%], Eyenovia [8.68%], K12 [8.64%]