
 Login Sign Up


| |||||
 |  | ||||

| 12Stocks.com Market Intelligence |
Best SmallCap Stocks
|
| In a hurry? Small Cap Stock Lists: Performance Trends Table, Stock Charts
Sort Small Cap stocks: Daily, Weekly, Year-to-Date, Market Cap & Trends. Filter Small Cap stocks list by sector: Show all, Tech, Finance, Energy, Staples, Retail, Industrial, Materials, Utilities and HealthCare Filter Small Cap stocks list by size: All Large Medium Small and MicroCap |
| 12Stocks.com Small Cap Stocks Performances & Trends Daily | |||||||||
|
|  The overall Smart Investing & Trading Score is 49 (0-bearish to 100-bullish) which puts Small Cap index in short term neutral trend. The Smart Investing & Trading Score from previous trading session is 14 and hence an improvement of trend.
| ||||||||
Here are the Smart Investing & Trading Scores of the most requested small cap stocks at 12Stocks.com (click stock name for detailed review):
|


| 12Stocks.com: Investing in Smallcap Index with Stocks | |
|
The following table helps investors and traders sort through current performance and trends (as measured by Smart Investing & Trading Score) of various
stocks in the Smallcap Index. Quick View: Move mouse or cursor over stock symbol (ticker) to view short-term technical chart and over stock name to view long term chart. Click on  to add stock symbol to your watchlist and to add stock symbol to your watchlist and  to view watchlist. Click on any ticker or stock name for detailed market intelligence report for that stock. to view watchlist. Click on any ticker or stock name for detailed market intelligence report for that stock. |
12Stocks.com Performance of Stocks in Smallcap Index
| Ticker | Stock Name | Watchlist | Category | Recent Price | Smart Investing & Trading Score | Change % | YTD Change% |
| UUUU | Energy Fuels |   | Materials | 5.59 | 42 | 2.95 | -22.25% |
| BRKL | Brookline Bancorp | | Financials | 8.74 | 42 | 2.94 | -19.89% |
| STEP | StepStone Group | | Financials | 36.53 | 71 | 2.93 | 14.73% |
| AMBA | Ambarella | | Technology | 46.89 | 74 | 2.92 | -23.49% |
| RWT | Redwood Trust | | Financials | 6.36 | 100 | 2.91 | -14.17% |
| COCO | Vita Coco | | Consumer Staples | 26.93 | 100 | 2.90 | 4.58% |
| MC | Moelis & | | Financials | 51.86 | 50 | 2.90 | -7.61% |
| MLAB | Mesa | | Technology | 113.37 | 100 | 2.90 | 8.21% |
| NBHC | National Bank | | Financials | 34.40 | 93 | 2.90 | -7.50% |
| BGS | B&G Foods | | Consumer Staples | 11.40 | 74 | 2.89 | 8.57% |
| PRTA | Prothena | | Health Care | 22.04 | 59 | 2.89 | -39.35% |
| AHCO | AdaptHealth | | Health Care | 10.35 | 90 | 2.88 | 41.98% |
| QUAD | Quad/Graphics | | Services & Goods | 4.66 | 42 | 2.87 | -14.02% |
| HRI | Herc | | Transports | 148.56 | 17 | 2.87 | -0.22% |
| TCBX | Third Coast | | Financials | 20.61 | 100 | 2.87 | 3.00% |
| BDN | Brandywine Realty | | Financials | 4.70 | 100 | 2.84 | -12.96% |
| RMBS | Rambus | | Technology | 54.25 | 0 | 2.84 | -20.51% |
| SXC | SunCoke Energy | | Materials | 10.13 | 10 | 2.84 | -5.68% |
| CUBI | Customers Bancorp | | Financials | 47.40 | 42 | 2.84 | -17.74% |
| INSE | Inspired Entertainment | | Services & Goods | 8.70 | 27 | 2.84 | -11.94% |
| CRSR | Corsair Gaming | | Technology | 11.58 | 67 | 2.84 | -17.93% |
| OMGA | Omega | | Health Care | 2.54 | 49 | 2.83 | -15.61% |
| BLX | Banco Latinoamericano | | Financials | 29.94 | 78 | 2.82 | 21.02% |
| STRA | Strategic Education | | Services & Goods | 117.97 | 88 | 2.81 | 27.71% |
| OSUR | OraSure | | Health Care | 5.48 | 50 | 2.81 | -33.17% |


| Too many stocks? View smallcap stocks filtered by marketcap & sector |
| Marketcap: All SmallCap Stocks (default-no microcap), Large, Mid-Range, Small |
| Smallcap Sector: Tech, Finance, Energy, Staples, Retail, Industrial, Materials, & Medical |
|
Get the most comprehensive stock market coverage daily at 12Stocks.com ➞ Best Stocks Today ➞ Best Stocks Weekly ➞ Best Stocks Year-to-Date ➞ Best Stocks Trends ➞  Best Stocks Today 12Stocks.com Best Nasdaq Stocks ➞ Best S&P 500 Stocks ➞ Best Tech Stocks ➞ Best Biotech Stocks ➞ |
| Detailed Overview of SmallCap Stocks |
| SmallCap Technical Overview, Leaders & Laggards, Top SmallCap ETF Funds & Detailed SmallCap Stocks List, Charts, Trends & More |
| Smallcap: Technical Analysis, Trends & YTD Performance | |
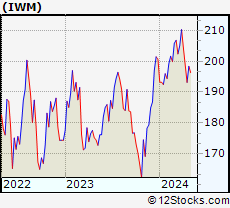
| SmallCap segment as represented by
IWM, an exchange-traded fund [ETF], holds basket of thousands of smallcap stocks from across all major sectors of the US stock market. The smallcap index (contains stocks like Riverbed & Sotheby's) is down by -0.39% and is currently underperforming the overall market by -6.01% year-to-date. Below is a quick view of technical charts and trends: | |
 IWM Weekly Chart |
|
| Long Term Trend: Not Good | |
| Medium Term Trend: Good | |
 IWM Daily Chart |
|
| Short Term Trend: Deteriorating | |
| Overall Trend Score: 49 | |
| YTD Performance: -0.39% | |
| **Trend Scores & Views Are Only For Educational Purposes And Not For Investing | |
| 12Stocks.com: Top Performing Small Cap Index Stocks | ||||||||||||||||||||||||||||||||||||||||||||||||
 The top performing Small Cap Index stocks year to date are
Now, more recently, over last week, the top performing Small Cap Index stocks on the move are


|
||||||||||||||||||||||||||||||||||||||||||||||||
| 12Stocks.com: Investing in Smallcap Index using Exchange Traded Funds | |
|
The following table shows list of key exchange traded funds (ETF) that
help investors track Smallcap index. The following list also includes leveraged ETF funds that track twice or thrice the daily returns of Smallcap indices. Short or inverse ETF funds move in the opposite direction to the index they track and are useful during market pullbacks or during bear markets. Quick View: Move mouse or cursor over ETF symbol (ticker) to view short-term technical chart and over ETF name to view long term chart. Click on ticker or stock name for detailed view. Click on to add stock symbol to your watchlist and to view watchlist. |
12Stocks.com List of ETFs that track Smallcap Index
| Ticker | ETF Name | Watchlist | Recent Price | Smart Investing & Trading Score | Change % | Week % | Year-to-date % |
| IWM | iShares Russell 2000 | | 199.92 | 49 | 1.84 | 0.77 | -0.39% |
| IJR | iShares Core S&P Small-Cap | | 106.33 | 50 | 1.52 | 0.64 | -1.77% |
| VTWO | Vanguard Russell 2000 ETF | | 80.85 | 42 | 1.88 | 0.79 | -0.31% |
| IWN | iShares Russell 2000 Value | | 152.88 | 75 | 2.04 | 1.15 | -1.58% |
| IWO | iShares Russell 2000 Growth | | 254.34 | 32 | 1.91 | 0.49 | 0.84% |
| IJS | iShares S&P Small-Cap 600 Value | | 98.02 | 43 | 1.68 | 0.85 | -4.9% |
| IJT | iShares S&P Small-Cap 600 Growth | | 126.72 | 63 | 1.42 | 0.5 | 1.26% |
| XSLV | PowerShares S&P SmallCap Low Volatil ETF | | 43.14 | 73 | 0.72 | 0.98 | -2.29% |
| SDD | ProShares UltraShort SmallCap600 | | 19.31 | 56 | -2.02 | -0.21 | 4.79% |
| SMLV | SPDR SSGA US Small Cap Low Volatil ETF | | 108.83 | 87 | 1.30 | 1.22 | -3.27% |
| SAA | ProShares Ultra SmallCap600 | | 22.93 | 42 | 1.56 | -0.46 | -8.08% |
| SBB | ProShares Short SmallCap600 | | 16.37 | 49 | -1.14 | -0.09 | 2.76% |
| 12Stocks.com: Charts, Trends, Fundamental Data and Performances of SmallCap Stocks | |
|
We now take in-depth look at all SmallCap stocks including charts, multi-period performances and overall trends (as measured by Smart Investing & Trading Score). One can sort SmallCap stocks (click link to choose) by Daily, Weekly and by Year-to-Date performances. Also, one can sort by size of the company or by market capitalization. |
| Select Your Default Chart Type: | |||||
| |||||
| Click on stock symbol or name for detailed view. Click on to add stock symbol to your watchlist and to view watchlist. Quick View: Move mouse or cursor over "Daily" to quickly view daily technical stock chart and over "Weekly" to view weekly technical stock chart. | |||||

 | UUUU Energy Fuels Inc. |
| Sector: Materials | |
| SubSector: Industrial Metals & Minerals | |
| MarketCap: 107.61 Millions | |
| Recent Price: 5.59 Smart Investing & Trading Score: 42 | |
| Day Percent Change: 2.95% Day Change: 0.16 | |
| Week Change: 3.52% Year-to-date Change: -22.3% | |
| UUUU Links: Profile News Message Board | |
| Charts:- Daily , Weekly | |
| Add UUUU to Watchlist: View: Get Complete UUUU Trend Analysis ➞ | |
 | BRKL Brookline Bancorp, Inc. |
| Sector: Financials | |
| SubSector: Savings & Loans | |
| MarketCap: 894.43 Millions | |
| Recent Price: 8.74 Smart Investing & Trading Score: 42 | |
| Day Percent Change: 2.94% Day Change: 0.25 | |
| Week Change: 4.86% Year-to-date Change: -19.9% | |
| BRKL Links: Profile News Message Board | |
| Charts:- Daily , Weekly | |
| Add BRKL to Watchlist: View: Get Complete BRKL Trend Analysis ➞ | |
 | STEP StepStone Group Inc. |
| Sector: Financials | |
| SubSector: Asset Management | |
| MarketCap: 30757 Millions | |
| Recent Price: 36.53 Smart Investing & Trading Score: 71 | |
| Day Percent Change: 2.93% Day Change: 1.04 | |
| Week Change: 0.22% Year-to-date Change: 14.7% | |
| STEP Links: Profile News Message Board | |
| Charts:- Daily , Weekly | |
| Add STEP to Watchlist: View: Get Complete STEP Trend Analysis ➞ | |
 | AMBA Ambarella, Inc. |
| Sector: Technology | |
| SubSector: Semiconductor Equipment & Materials | |
| MarketCap: 1509.38 Millions | |
| Recent Price: 46.89 Smart Investing & Trading Score: 74 | |
| Day Percent Change: 2.92% Day Change: 1.33 | |
| Week Change: 8.82% Year-to-date Change: -23.5% | |
| AMBA Links: Profile News Message Board | |
| Charts:- Daily , Weekly | |
| Add AMBA to Watchlist: View: Get Complete AMBA Trend Analysis ➞ | |
 | RWT Redwood Trust, Inc. |
| Sector: Financials | |
| SubSector: Mortgage Investment | |
| MarketCap: 674.739 Millions | |
| Recent Price: 6.36 Smart Investing & Trading Score: 100 | |
| Day Percent Change: 2.91% Day Change: 0.18 | |
| Week Change: 11.19% Year-to-date Change: -14.2% | |
| RWT Links: Profile News Message Board | |
| Charts:- Daily , Weekly | |
| Add RWT to Watchlist: View: Get Complete RWT Trend Analysis ➞ | |
 | COCO The Vita Coco Company, Inc. |
| Sector: Consumer Staples | |
| SubSector: Beverages - Non-Alcoholic | |
| MarketCap: 1510 Millions | |
| Recent Price: 26.93 Smart Investing & Trading Score: 100 | |
| Day Percent Change: 2.90% Day Change: 0.76 | |
| Week Change: 8.9% Year-to-date Change: 4.6% | |
| COCO Links: Profile News Message Board | |
| Charts:- Daily , Weekly | |
| Add COCO to Watchlist: View: Get Complete COCO Trend Analysis ➞ | |
 | MC Moelis & Company |
| Sector: Financials | |
| SubSector: Asset Management | |
| MarketCap: 1675.93 Millions | |
| Recent Price: 51.86 Smart Investing & Trading Score: 50 | |
| Day Percent Change: 2.90% Day Change: 1.46 | |
| Week Change: 4.24% Year-to-date Change: -7.6% | |
| MC Links: Profile News Message Board | |
| Charts:- Daily , Weekly | |
| Add MC to Watchlist: View: Get Complete MC Trend Analysis ➞ | |
 | MLAB Mesa Laboratories, Inc. |
| Sector: Technology | |
| SubSector: Scientific & Technical Instruments | |
| MarketCap: 935.453 Millions | |
| Recent Price: 113.37 Smart Investing & Trading Score: 100 | |
| Day Percent Change: 2.90% Day Change: 3.19 | |
| Week Change: 9.87% Year-to-date Change: 8.2% | |
| MLAB Links: Profile News Message Board | |
| Charts:- Daily , Weekly | |
| Add MLAB to Watchlist: View: Get Complete MLAB Trend Analysis ➞ | |
 | NBHC National Bank Holdings Corporation |
| Sector: Financials | |
| SubSector: Regional - Midwest Banks | |
| MarketCap: 766.87 Millions | |
| Recent Price: 34.40 Smart Investing & Trading Score: 93 | |
| Day Percent Change: 2.90% Day Change: 0.97 | |
| Week Change: 2.69% Year-to-date Change: -7.5% | |
| NBHC Links: Profile News Message Board | |
| Charts:- Daily , Weekly | |
| Add NBHC to Watchlist: View: Get Complete NBHC Trend Analysis ➞ | |
 | BGS B&G Foods, Inc. |
| Sector: Consumer Staples | |
| SubSector: Processed & Packaged Goods | |
| MarketCap: 1456.08 Millions | |
| Recent Price: 11.40 Smart Investing & Trading Score: 74 | |
| Day Percent Change: 2.89% Day Change: 0.32 | |
| Week Change: 3.07% Year-to-date Change: 8.6% | |
| BGS Links: Profile News Message Board | |
| Charts:- Daily , Weekly | |
| Add BGS to Watchlist: View: Get Complete BGS Trend Analysis ➞ | |
 | PRTA Prothena Corporation plc |
| Sector: Health Care | |
| SubSector: Biotechnology | |
| MarketCap: 357.985 Millions | |
| Recent Price: 22.04 Smart Investing & Trading Score: 59 | |
| Day Percent Change: 2.89% Day Change: 0.62 | |
| Week Change: 5.61% Year-to-date Change: -39.4% | |
| PRTA Links: Profile News Message Board | |
| Charts:- Daily , Weekly | |
| Add PRTA to Watchlist: View: Get Complete PRTA Trend Analysis ➞ | |
 | AHCO AdaptHealth Corp. |
| Sector: Health Care | |
| SubSector: Medical Appliances & Equipment | |
| MarketCap: 1084.8 Millions | |
| Recent Price: 10.35 Smart Investing & Trading Score: 90 | |
| Day Percent Change: 2.88% Day Change: 0.29 | |
| Week Change: 3.92% Year-to-date Change: 42.0% | |
| AHCO Links: Profile News Message Board | |
| Charts:- Daily , Weekly | |
| Add AHCO to Watchlist: View: Get Complete AHCO Trend Analysis ➞ | |
 | QUAD Quad/Graphics, Inc. |
| Sector: Services & Goods | |
| SubSector: Business Services | |
| MarketCap: 205.182 Millions | |
| Recent Price: 4.66 Smart Investing & Trading Score: 42 | |
| Day Percent Change: 2.87% Day Change: 0.13 | |
| Week Change: 3.1% Year-to-date Change: -14.0% | |
| QUAD Links: Profile News Message Board | |
| Charts:- Daily , Weekly | |
| Add QUAD to Watchlist: View: Get Complete QUAD Trend Analysis ➞ | |
 | HRI Herc Holdings Inc. |
| Sector: Transports | |
| SubSector: Rental & Leasing Services | |
| MarketCap: 469.344 Millions | |
| Recent Price: 148.56 Smart Investing & Trading Score: 17 | |
| Day Percent Change: 2.87% Day Change: 4.15 | |
| Week Change: -2.44% Year-to-date Change: -0.2% | |
| HRI Links: Profile News Message Board | |
| Charts:- Daily , Weekly | |
| Add HRI to Watchlist: View: Get Complete HRI Trend Analysis ➞ | |
 | TCBX Third Coast Bancshares, Inc. |
| Sector: Financials | |
| SubSector: Banks - Regional | |
| MarketCap: 212 Millions | |
| Recent Price: 20.61 Smart Investing & Trading Score: 100 | |
| Day Percent Change: 2.87% Day Change: 0.57 | |
| Week Change: 3.57% Year-to-date Change: 3.0% | |
| TCBX Links: Profile News Message Board | |
| Charts:- Daily , Weekly | |
| Add TCBX to Watchlist: View: Get Complete TCBX Trend Analysis ➞ | |
 | BDN Brandywine Realty Trust |
| Sector: Financials | |
| SubSector: REIT - Diversified | |
| MarketCap: 1688.13 Millions | |
| Recent Price: 4.70 Smart Investing & Trading Score: 100 | |
| Day Percent Change: 2.84% Day Change: 0.13 | |
| Week Change: 5.15% Year-to-date Change: -13.0% | |
| BDN Links: Profile News Message Board | |
| Charts:- Daily , Weekly | |
| Add BDN to Watchlist: View: Get Complete BDN Trend Analysis ➞ | |
 | RMBS Rambus Inc. |
| Sector: Technology | |
| SubSector: Semiconductor- Memory Chips | |
| MarketCap: 1296 Millions | |
| Recent Price: 54.25 Smart Investing & Trading Score: 0 | |
| Day Percent Change: 2.84% Day Change: 1.50 | |
| Week Change: -8.41% Year-to-date Change: -20.5% | |
| RMBS Links: Profile News Message Board | |
| Charts:- Daily , Weekly | |
| Add RMBS to Watchlist: View: Get Complete RMBS Trend Analysis ➞ | |
 | SXC SunCoke Energy, Inc. |
| Sector: Materials | |
| SubSector: Nonmetallic Mineral Mining | |
| MarketCap: 306.5 Millions | |
| Recent Price: 10.13 Smart Investing & Trading Score: 10 | |
| Day Percent Change: 2.84% Day Change: 0.28 | |
| Week Change: -4.16% Year-to-date Change: -5.7% | |
| SXC Links: Profile News Message Board | |
| Charts:- Daily , Weekly | |
| Add SXC to Watchlist: View: Get Complete SXC Trend Analysis ➞ | |
 | CUBI Customers Bancorp, Inc. |
| Sector: Financials | |
| SubSector: Regional - Northeast Banks | |
| MarketCap: 385.399 Millions | |
| Recent Price: 47.40 Smart Investing & Trading Score: 42 | |
| Day Percent Change: 2.84% Day Change: 1.31 | |
| Week Change: 1.24% Year-to-date Change: -17.7% | |
| CUBI Links: Profile News Message Board | |
| Charts:- Daily , Weekly | |
| Add CUBI to Watchlist: View: Get Complete CUBI Trend Analysis ➞ | |
 | INSE Inspired Entertainment, Inc. |
| Sector: Services & Goods | |
| SubSector: Gaming Activities | |
| MarketCap: 80.9289 Millions | |
| Recent Price: 8.70 Smart Investing & Trading Score: 27 | |
| Day Percent Change: 2.84% Day Change: 0.24 | |
| Week Change: -1.25% Year-to-date Change: -11.9% | |
| INSE Links: Profile News Message Board | |
| Charts:- Daily , Weekly | |
| Add INSE to Watchlist: View: Get Complete INSE Trend Analysis ➞ | |
 | CRSR Corsair Gaming, Inc. |
| Sector: Technology | |
| SubSector: Computer Hardware | |
| MarketCap: 32187 Millions | |
| Recent Price: 11.58 Smart Investing & Trading Score: 67 | |
| Day Percent Change: 2.84% Day Change: 0.32 | |
| Week Change: 2.48% Year-to-date Change: -17.9% | |
| CRSR Links: Profile News Message Board | |
| Charts:- Daily , Weekly | |
| Add CRSR to Watchlist: View: Get Complete CRSR Trend Analysis ➞ | |
 | OMGA Omega Therapeutics, Inc. |
| Sector: Health Care | |
| SubSector: Biotechnology | |
| MarketCap: 304 Millions | |
| Recent Price: 2.54 Smart Investing & Trading Score: 49 | |
| Day Percent Change: 2.83% Day Change: 0.07 | |
| Week Change: 11.89% Year-to-date Change: -15.6% | |
| OMGA Links: Profile News Message Board | |
| Charts:- Daily , Weekly | |
| Add OMGA to Watchlist: View: Get Complete OMGA Trend Analysis ➞ | |
 | BLX Banco Latinoamericano de Comercio Exterior, S.A |
| Sector: Financials | |
| SubSector: Foreign Money Center Banks | |
| MarketCap: 390.471 Millions | |
| Recent Price: 29.94 Smart Investing & Trading Score: 78 | |
| Day Percent Change: 2.82% Day Change: 0.82 | |
| Week Change: 1.22% Year-to-date Change: 21.0% | |
| BLX Links: Profile News Message Board | |
| Charts:- Daily , Weekly | |
| Add BLX to Watchlist: View: Get Complete BLX Trend Analysis ➞ | |
 | STRA Strategic Education, Inc. |
| Sector: Services & Goods | |
| SubSector: Education & Training Services | |
| MarketCap: 2621.56 Millions | |
| Recent Price: 117.97 Smart Investing & Trading Score: 88 | |
| Day Percent Change: 2.81% Day Change: 3.22 | |
| Week Change: -2.55% Year-to-date Change: 27.7% | |
| STRA Links: Profile News Message Board | |
| Charts:- Daily , Weekly | |
| Add STRA to Watchlist: View: Get Complete STRA Trend Analysis ➞ | |
 | OSUR OraSure Technologies, Inc. |
| Sector: Health Care | |
| SubSector: Medical Instruments & Supplies | |
| MarketCap: 468.26 Millions | |
| Recent Price: 5.48 Smart Investing & Trading Score: 50 | |
| Day Percent Change: 2.81% Day Change: 0.15 | |
| Week Change: 3.01% Year-to-date Change: -33.2% | |
| OSUR Links: Profile News Message Board | |
| Charts:- Daily , Weekly | |
| Add OSUR to Watchlist: View: Get Complete OSUR Trend Analysis ➞ | |
| Too many stocks? View smallcap stocks filtered by marketcap & sector |
| Marketcap: All SmallCap Stocks (default-no microcap), Large, Mid-Range, Small & MicroCap |
| Sector: Tech, Finance, Energy, Staples, Retail, Industrial, Materials, Utilities & Medical |
|
Best Stocks Today 12Stocks.com |
© 2024 12Stocks.com Terms & Conditions Privacy Contact Us
All Information Provided Only For Education And Not To Be Used For Investing or Trading. See Terms & Conditions


One More Thing ... Get Best Stocks Delivered Daily!
Never Ever Miss A Move With Our Top Ten Stocks Lists
Find Best Stocks In Any Market - Bull or Bear Market
Take A Peek At Our Top Ten Stocks Lists: Daily, Weekly, Year-to-Date & Top Trends
Find Best Stocks In Any Market - Bull or Bear Market
Take A Peek At Our Top Ten Stocks Lists: Daily, Weekly, Year-to-Date & Top Trends
Smallcap Stocks With Best Up Trends [0-bearish to 100-bullish]: Emergent BioSolutions[100], Aspen Aerogels[100], Carvana Co[100], Perdoceo Education[100], Gannett Co[100], Pitney Bowes[100], Benchmark Electronics[100], Origin Materials[100], FormFactor [100], Lantheus [100], Q2 [100]
Best Smallcap Stocks Year-to-Date:
Janux [440.16%], Viking [307.09%], Longboard [273.98%], Alpine Immune[239.29%], Bakkt [187.89%], Avidity Biosciences[182.96%], Vera [170.74%], Cullinan Oncology[169.74%], Super Micro[168.25%], Arcutis Bio[166.25%], Y-mAbs [152.93%] Best Smallcap Stocks This Week:
Deciphera [73.24%], Emergent BioSolutions[71.88%], Eyenovia [49.22%], Aspen Aerogels[48.14%], P3 Health[38.51%], Carvana Co[38.18%], Cue Biopharma[37.73%], Origin Materials[36.24%], TransMedics Group[35.14%], Seres [34.55%], Enovix [32.07%] Best Smallcap Stocks Daily:
Emergent BioSolutions[70.98%], Aspen Aerogels[56.70%], Carvana Co[33.77%], Perdoceo Education[31.46%], Enovix [31.06%], Office Properties[28.00%], Gannett Co[26.97%], Sunnova Energy[25.21%], Pitney Bowes[24.70%], Pulmonx [21.50%], CommScope Holding[20.95%]