
 Login Sign Up


| |||||
 |  | ||||

| 12Stocks.com Market Intelligence |
Best SmallCap Stocks
|
| In a hurry? Small Cap Stock Lists: Performance Trends Table, Stock Charts
Sort Small Cap stocks: Daily, Weekly, Year-to-Date, Market Cap & Trends. Filter Small Cap stocks list by sector: Show all, Tech, Finance, Energy, Staples, Retail, Industrial, Materials, Utilities and HealthCare Filter Small Cap stocks list by size: All Large Medium Small and MicroCap |
| 12Stocks.com Small Cap Stocks Performances & Trends Daily | |||||||||
|
|  The overall Smart Investing & Trading Score is 49 (0-bearish to 100-bullish) which puts Small Cap index in short term neutral trend. The Smart Investing & Trading Score from previous trading session is 14 and hence an improvement of trend.
| ||||||||
Here are the Smart Investing & Trading Scores of the most requested small cap stocks at 12Stocks.com (click stock name for detailed review):
|


| 12Stocks.com: Investing in Smallcap Index with Stocks | |
|
The following table helps investors and traders sort through current performance and trends (as measured by Smart Investing & Trading Score) of various
stocks in the Smallcap Index. Quick View: Move mouse or cursor over stock symbol (ticker) to view short-term technical chart and over stock name to view long term chart. Click on  to add stock symbol to your watchlist and to add stock symbol to your watchlist and  to view watchlist. Click on any ticker or stock name for detailed market intelligence report for that stock. to view watchlist. Click on any ticker or stock name for detailed market intelligence report for that stock. |
12Stocks.com Performance of Stocks in Smallcap Index
| Ticker | Stock Name | Watchlist | Category | Recent Price | Smart Investing & Trading Score | Change % | YTD Change% |
| FOR | Forestar Group |   | Financials | 33.80 | 39 | 4.55 | 2.21% |
| PMVP | PMV | | Health Care | 1.96 | 100 | 4.55 | -36.94% |
| MXL | MaxLinear | | Technology | 20.15 | 10 | 4.54 | -15.25% |
| TWOU | 2U | | Technology | 0.28 | 59 | 4.54 | -77.18% |
| KODK | Eastman Kodak | | Technology | 4.74 | 15 | 4.53 | 21.41% |
| RLAY | Relay | | Health Care | 7.40 | 67 | 4.52 | -32.73% |
| GBIO | Generation Bio | | Health Care | 3.25 | 63 | 4.50 | 96.97% |
| MYPS | PLAYSTUDIOS | | Services & Goods | 2.32 | 20 | 4.50 | -13.27% |
| XNCR | Xencor | | Health Care | 24.69 | 100 | 4.49 | 16.30% |
| MSGE | Madison Square | | Technology | 41.25 | 65 | 4.48 | 29.68% |
| TTEC | TTEC | | Technology | 7.86 | 37 | 4.45 | -63.73% |
| CVCO | Cavco Industries | | Industrials | 388.58 | 38 | 4.45 | 12.11% |
| EDIT | Editas Medicine | | Health Care | 5.87 | 42 | 4.45 | -42.05% |
| AMKR | Amkor | | Technology | 33.06 | 61 | 4.42 | -0.63% |
| PHAT | Phathom | | Health Care | 10.19 | 44 | 4.41 | 11.61% |
| INFN | Infinera | | Technology | 5.49 | 100 | 4.37 | 15.58% |
| TELL | Tellurian | | Energy | 0.44 | 24 | 4.37 | -41.48% |
| OM | Outset Medical | | Health Care | 3.13 | 74 | 4.33 | -42.14% |
| ALEC | Alector | | Health Care | 5.57 | 47 | 4.31 | -30.20% |
| ORIC | ORIC | | Health Care | 9.93 | 49 | 4.31 | 7.70% |
| LAW | CS Disco | | Technology | 7.98 | 41 | 4.31 | 4.45% |
| ACLS | Axcelis | | Technology | 111.22 | 74 | 4.29 | -14.24% |
| RYTM | Rhythm | | Health Care | 42.74 | 64 | 4.29 | -7.03% |
| SGH | SMART Global | | Technology | 19.30 | 18 | 4.27 | 1.95% |
| ACMR | ACM Research | | Technology | 27.64 | 22 | 4.26 | 41.45% |
| For chart view version of above stock list: Chart View ➞ 0 - 25 , 25 - 50 , 50 - 75 , 75 - 100 , 100 - 125 , 125 - 150 , 150 - 175 , 175 - 200 , 200 - 225 , 225 - 250 , 250 - 275 , 275 - 300 , 300 - 325 , 325 - 350 , 350 - 375 , 375 - 400 , 400 - 425 , 425 - 450 , 450 - 475 , 475 - 500 , 500 - 525 , 525 - 550 , 550 - 575 , 575 - 600 , 600 - 625 , 625 - 650 , 650 - 675 , 675 - 700 , 700 - 725 , 725 - 750 , 750 - 775 , 775 - 800 , 800 - 825 , 825 - 850 , 850 - 875 , 875 - 900 , 900 - 925 , 925 - 950 , 950 - 975 , 975 - 1000 , 1000 - 1025 , 1025 - 1050 , 1050 - 1075 , 1075 - 1100 , 1100 - 1125 , 1125 - 1150 , 1150 - 1175 , 1175 - 1200 , 1200 - 1225 , 1225 - 1250 , 1250 - 1275 , 1275 - 1300 , 1300 - 1325 , 1325 - 1350 , 1350 - 1375 , 1375 - 1400 , 1400 - 1425 , 1425 - 1450 , 1450 - 1475 , 1475 - 1500 , 1500 - 1525 , 1525 - 1550 , 1550 - 1575 , 1575 - 1600 | ||
 | Click To Change The Sort Order: By Market Cap or Company Size Performance: Year-to-date, Week and Day |  |
| Too many stocks? View smallcap stocks filtered by marketcap & sector |
| Marketcap: All SmallCap Stocks (default-no microcap), Large, Mid-Range, Small |
| Smallcap Sector: Tech, Finance, Energy, Staples, Retail, Industrial, Materials, & Medical |
|
Get the most comprehensive stock market coverage daily at 12Stocks.com ➞ Best Stocks Today ➞ Best Stocks Weekly ➞ Best Stocks Year-to-Date ➞ Best Stocks Trends ➞  Best Stocks Today 12Stocks.com Best Nasdaq Stocks ➞ Best S&P 500 Stocks ➞ Best Tech Stocks ➞ Best Biotech Stocks ➞ |
| Detailed Overview of SmallCap Stocks |
| SmallCap Technical Overview, Leaders & Laggards, Top SmallCap ETF Funds & Detailed SmallCap Stocks List, Charts, Trends & More |
| Smallcap: Technical Analysis, Trends & YTD Performance | |
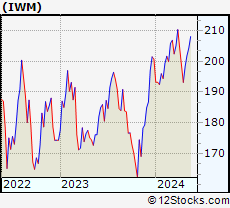
| SmallCap segment as represented by
IWM, an exchange-traded fund [ETF], holds basket of thousands of smallcap stocks from across all major sectors of the US stock market. The smallcap index (contains stocks like Riverbed & Sotheby's) is up by 1.11% and is currently underperforming the overall market by -5.68% year-to-date. Below is a quick view of technical charts and trends: | |
 IWM Weekly Chart |
|
| Long Term Trend: Not Good | |
| Medium Term Trend: Good | |
 IWM Daily Chart |
|
| Short Term Trend: Deteriorating | |
| Overall Trend Score: 49 | |
| YTD Performance: 1.11% | |
| **Trend Scores & Views Are Only For Educational Purposes And Not For Investing | |
| 12Stocks.com: Top Performing Small Cap Index Stocks | ||||||||||||||||||||||||||||||||||||||||||||||||
 The top performing Small Cap Index stocks year to date are
Now, more recently, over last week, the top performing Small Cap Index stocks on the move are


|
||||||||||||||||||||||||||||||||||||||||||||||||
| 12Stocks.com: Investing in Smallcap Index using Exchange Traded Funds | |
|
The following table shows list of key exchange traded funds (ETF) that
help investors track Smallcap index. The following list also includes leveraged ETF funds that track twice or thrice the daily returns of Smallcap indices. Short or inverse ETF funds move in the opposite direction to the index they track and are useful during market pullbacks or during bear markets. Quick View: Move mouse or cursor over ETF symbol (ticker) to view short-term technical chart and over ETF name to view long term chart. Click on ticker or stock name for detailed view. Click on to add stock symbol to your watchlist and to view watchlist. |
12Stocks.com List of ETFs that track Smallcap Index
| Ticker | ETF Name | Watchlist | Recent Price | Smart Investing & Trading Score | Change % | Week % | Year-to-date % |
| IWM | iShares Russell 2000 | | 202.94 | 49 | 1.51 | 2.29 | 1.11% |
| SDD | ProShares UltraShort SmallCap600 | | 18.35 | 56 | -4.97 | -5.17 | -0.42% |
| SBB | ProShares Short SmallCap600 | | 16.33 | 49 | -0.25 | -0.34 | 2.51% |
| SAA | ProShares Ultra SmallCap600 | | 23.93 | 42 | 4.36 | 3.88 | -4.07% |
| 12Stocks.com: Charts, Trends, Fundamental Data and Performances of SmallCap Stocks | |
|
We now take in-depth look at all SmallCap stocks including charts, multi-period performances and overall trends (as measured by Smart Investing & Trading Score). One can sort SmallCap stocks (click link to choose) by Daily, Weekly and by Year-to-Date performances. Also, one can sort by size of the company or by market capitalization. |
| Select Your Default Chart Type: | |||||
| |||||
| Click on stock symbol or name for detailed view. Click on to add stock symbol to your watchlist and to view watchlist. Quick View: Move mouse or cursor over "Daily" to quickly view daily technical stock chart and over "Weekly" to view weekly technical stock chart. | |||||

 | FOR Forestar Group Inc. |
| Sector: Financials | |
| SubSector: Real Estate Development | |
| MarketCap: 661.019 Millions | |
| Recent Price: 33.80 Smart Investing & Trading Score: 39 | |
| Day Percent Change: 4.55% Day Change: 1.47 | |
| Week Change: 7.88% Year-to-date Change: 2.2% | |
| FOR Links: Profile News Message Board | |
| Charts:- Daily , Weekly | |
| Add FOR to Watchlist: View: Get Complete FOR Trend Analysis ➞ | |
 | PMVP PMV Pharmaceuticals, Inc. |
| Sector: Health Care | |
| SubSector: Biotechnology | |
| MarketCap: 20187 Millions | |
| Recent Price: 1.96 Smart Investing & Trading Score: 100 | |
| Day Percent Change: 4.55% Day Change: 0.08 | |
| Week Change: 11.71% Year-to-date Change: -36.9% | |
| PMVP Links: Profile News Message Board | |
| Charts:- Daily , Weekly | |
| Add PMVP to Watchlist: View: Get Complete PMVP Trend Analysis ➞ | |
 | MXL MaxLinear, Inc. |
| Sector: Technology | |
| SubSector: Semiconductor - Integrated Circuits | |
| MarketCap: 751.31 Millions | |
| Recent Price: 20.15 Smart Investing & Trading Score: 10 | |
| Day Percent Change: 4.54% Day Change: 0.88 | |
| Week Change: -2.16% Year-to-date Change: -15.3% | |
| MXL Links: Profile News Message Board | |
| Charts:- Daily , Weekly | |
| Add MXL to Watchlist: View: Get Complete MXL Trend Analysis ➞ | |
 | TWOU 2U, Inc. |
| Sector: Technology | |
| SubSector: Application Software | |
| MarketCap: 1090.12 Millions | |
| Recent Price: 0.28 Smart Investing & Trading Score: 59 | |
| Day Percent Change: 4.54% Day Change: 0.01 | |
| Week Change: 16.81% Year-to-date Change: -77.2% | |
| TWOU Links: Profile News Message Board | |
| Charts:- Daily , Weekly | |
| Add TWOU to Watchlist: View: Get Complete TWOU Trend Analysis ➞ | |
 | KODK Eastman Kodak Company |
| Sector: Technology | |
| SubSector: Electronic Equipment | |
| MarketCap: 78.47 Millions | |
| Recent Price: 4.74 Smart Investing & Trading Score: 15 | |
| Day Percent Change: 4.53% Day Change: 0.21 | |
| Week Change: 4.76% Year-to-date Change: 21.4% | |
| KODK Links: Profile News Message Board | |
| Charts:- Daily , Weekly | |
| Add KODK to Watchlist: View: Get Complete KODK Trend Analysis ➞ | |
 | RLAY Relay Therapeutics, Inc. |
| Sector: Health Care | |
| SubSector: Biotechnology | |
| MarketCap: 45887 Millions | |
| Recent Price: 7.40 Smart Investing & Trading Score: 67 | |
| Day Percent Change: 4.52% Day Change: 0.32 | |
| Week Change: 16.17% Year-to-date Change: -32.7% | |
| RLAY Links: Profile News Message Board | |
| Charts:- Daily , Weekly | |
| Add RLAY to Watchlist: View: Get Complete RLAY Trend Analysis ➞ | |
 | GBIO Generation Bio Co. |
| Sector: Health Care | |
| SubSector: Biotechnology | |
| MarketCap: 17487 Millions | |
| Recent Price: 3.25 Smart Investing & Trading Score: 63 | |
| Day Percent Change: 4.50% Day Change: 0.14 | |
| Week Change: 12.07% Year-to-date Change: 97.0% | |
| GBIO Links: Profile News Message Board | |
| Charts:- Daily , Weekly | |
| Add GBIO to Watchlist: View: Get Complete GBIO Trend Analysis ➞ | |
 | MYPS PLAYSTUDIOS, Inc. |
| Sector: Services & Goods | |
| SubSector: Electronic Gaming & Multimedia | |
| MarketCap: 635 Millions | |
| Recent Price: 2.32 Smart Investing & Trading Score: 20 | |
| Day Percent Change: 4.50% Day Change: 0.10 | |
| Week Change: 3.34% Year-to-date Change: -13.3% | |
| MYPS Links: Profile News Message Board | |
| Charts:- Daily , Weekly | |
| Add MYPS to Watchlist: View: Get Complete MYPS Trend Analysis ➞ | |
 | XNCR Xencor, Inc. |
| Sector: Health Care | |
| SubSector: Biotechnology | |
| MarketCap: 1744.35 Millions | |
| Recent Price: 24.69 Smart Investing & Trading Score: 100 | |
| Day Percent Change: 4.49% Day Change: 1.06 | |
| Week Change: 23.57% Year-to-date Change: 16.3% | |
| XNCR Links: Profile News Message Board | |
| Charts:- Daily , Weekly | |
| Add XNCR to Watchlist: View: Get Complete XNCR Trend Analysis ➞ | |
 | MSGE Madison Square Garden Entertainment Corp. |
| Sector: Technology | |
| SubSector: Entertainment | |
| MarketCap: 18837 Millions | |
| Recent Price: 41.25 Smart Investing & Trading Score: 65 | |
| Day Percent Change: 4.48% Day Change: 1.77 | |
| Week Change: 4.64% Year-to-date Change: 29.7% | |
| MSGE Links: Profile News Message Board | |
| Charts:- Daily , Weekly | |
| Add MSGE to Watchlist: View: Get Complete MSGE Trend Analysis ➞ | |
 | TTEC TTEC Holdings, Inc. |
| Sector: Technology | |
| SubSector: Information Technology Services | |
| MarketCap: 1528.48 Millions | |
| Recent Price: 7.86 Smart Investing & Trading Score: 37 | |
| Day Percent Change: 4.45% Day Change: 0.33 | |
| Week Change: 1.81% Year-to-date Change: -63.7% | |
| TTEC Links: Profile News Message Board | |
| Charts:- Daily , Weekly | |
| Add TTEC to Watchlist: View: Get Complete TTEC Trend Analysis ➞ | |
 | CVCO Cavco Industries, Inc. |
| Sector: Industrials | |
| SubSector: Residential Construction | |
| MarketCap: 1375.86 Millions | |
| Recent Price: 388.58 Smart Investing & Trading Score: 38 | |
| Day Percent Change: 4.45% Day Change: 16.56 | |
| Week Change: 4.29% Year-to-date Change: 12.1% | |
| CVCO Links: Profile News Message Board | |
| Charts:- Daily , Weekly | |
| Add CVCO to Watchlist: View: Get Complete CVCO Trend Analysis ➞ | |
 | EDIT Editas Medicine, Inc. |
| Sector: Health Care | |
| SubSector: Biotechnology | |
| MarketCap: 1194.95 Millions | |
| Recent Price: 5.87 Smart Investing & Trading Score: 42 | |
| Day Percent Change: 4.45% Day Change: 0.25 | |
| Week Change: 10.34% Year-to-date Change: -42.1% | |
| EDIT Links: Profile News Message Board | |
| Charts:- Daily , Weekly | |
| Add EDIT to Watchlist: View: Get Complete EDIT Trend Analysis ➞ | |
 | AMKR Amkor Technology, Inc. |
| Sector: Technology | |
| SubSector: Semiconductor - Integrated Circuits | |
| MarketCap: 1966.2 Millions | |
| Recent Price: 33.06 Smart Investing & Trading Score: 61 | |
| Day Percent Change: 4.42% Day Change: 1.40 | |
| Week Change: 7.97% Year-to-date Change: -0.6% | |
| AMKR Links: Profile News Message Board | |
| Charts:- Daily , Weekly | |
| Add AMKR to Watchlist: View: Get Complete AMKR Trend Analysis ➞ | |
 | PHAT Phathom Pharmaceuticals, Inc. |
| Sector: Health Care | |
| SubSector: Biotechnology | |
| MarketCap: 728.785 Millions | |
| Recent Price: 10.19 Smart Investing & Trading Score: 44 | |
| Day Percent Change: 4.41% Day Change: 0.43 | |
| Week Change: 11% Year-to-date Change: 11.6% | |
| PHAT Links: Profile News Message Board | |
| Charts:- Daily , Weekly | |
| Add PHAT to Watchlist: View: Get Complete PHAT Trend Analysis ➞ | |
 | INFN Infinera Corporation |
| Sector: Technology | |
| SubSector: Communication Equipment | |
| MarketCap: 943 Millions | |
| Recent Price: 5.49 Smart Investing & Trading Score: 100 | |
| Day Percent Change: 4.37% Day Change: 0.23 | |
| Week Change: 7.65% Year-to-date Change: 15.6% | |
| INFN Links: Profile News Message Board | |
| Charts:- Daily , Weekly | |
| Add INFN to Watchlist: View: Get Complete INFN Trend Analysis ➞ | |
 | TELL Tellurian Inc. |
| Sector: Energy | |
| SubSector: Oil & Gas Drilling & Exploration | |
| MarketCap: 245.339 Millions | |
| Recent Price: 0.44 Smart Investing & Trading Score: 24 | |
| Day Percent Change: 4.37% Day Change: 0.02 | |
| Week Change: -5.27% Year-to-date Change: -41.5% | |
| TELL Links: Profile News Message Board | |
| Charts:- Daily , Weekly | |
| Add TELL to Watchlist: View: Get Complete TELL Trend Analysis ➞ | |
 | OM Outset Medical, Inc. |
| Sector: Health Care | |
| SubSector: Medical Devices | |
| MarketCap: 21787 Millions | |
| Recent Price: 3.13 Smart Investing & Trading Score: 74 | |
| Day Percent Change: 4.33% Day Change: 0.13 | |
| Week Change: 30.42% Year-to-date Change: -42.1% | |
| OM Links: Profile News Message Board | |
| Charts:- Daily , Weekly | |
| Add OM to Watchlist: View: Get Complete OM Trend Analysis ➞ | |
 | ALEC Alector, Inc. |
| Sector: Health Care | |
| SubSector: Biotechnology | |
| MarketCap: 2719.35 Millions | |
| Recent Price: 5.57 Smart Investing & Trading Score: 47 | |
| Day Percent Change: 4.31% Day Change: 0.23 | |
| Week Change: 6.1% Year-to-date Change: -30.2% | |
| ALEC Links: Profile News Message Board | |
| Charts:- Daily , Weekly | |
| Add ALEC to Watchlist: View: Get Complete ALEC Trend Analysis ➞ | |
 | ORIC ORIC Pharmaceuticals, Inc. |
| Sector: Health Care | |
| SubSector: Biotechnology | |
| MarketCap: 12787 Millions | |
| Recent Price: 9.93 Smart Investing & Trading Score: 49 | |
| Day Percent Change: 4.31% Day Change: 0.41 | |
| Week Change: 23.05% Year-to-date Change: 7.7% | |
| ORIC Links: Profile News Message Board | |
| Charts:- Daily , Weekly | |
| Add ORIC to Watchlist: View: Get Complete ORIC Trend Analysis ➞ | |
 | LAW CS Disco, Inc. |
| Sector: Technology | |
| SubSector: Software - Application | |
| MarketCap: 505 Millions | |
| Recent Price: 7.98 Smart Investing & Trading Score: 41 | |
| Day Percent Change: 4.31% Day Change: 0.33 | |
| Week Change: 1.79% Year-to-date Change: 4.5% | |
| LAW Links: Profile News Message Board | |
| Charts:- Daily , Weekly | |
| Add LAW to Watchlist: View: Get Complete LAW Trend Analysis ➞ | |
 | ACLS Axcelis Technologies, Inc. |
| Sector: Technology | |
| SubSector: Semiconductor Equipment & Materials | |
| MarketCap: 498.518 Millions | |
| Recent Price: 111.22 Smart Investing & Trading Score: 74 | |
| Day Percent Change: 4.29% Day Change: 4.58 | |
| Week Change: 7.92% Year-to-date Change: -14.2% | |
| ACLS Links: Profile News Message Board | |
| Charts:- Daily , Weekly | |
| Add ACLS to Watchlist: View: Get Complete ACLS Trend Analysis ➞ | |
 | RYTM Rhythm Pharmaceuticals, Inc. |
| Sector: Health Care | |
| SubSector: Biotechnology | |
| MarketCap: 643.685 Millions | |
| Recent Price: 42.74 Smart Investing & Trading Score: 64 | |
| Day Percent Change: 4.29% Day Change: 1.76 | |
| Week Change: 11.65% Year-to-date Change: -7.0% | |
| RYTM Links: Profile News Message Board | |
| Charts:- Daily , Weekly | |
| Add RYTM to Watchlist: View: Get Complete RYTM Trend Analysis ➞ | |
 | SGH SMART Global Holdings, Inc. |
| Sector: Technology | |
| SubSector: Semiconductor- Memory Chips | |
| MarketCap: 657.8 Millions | |
| Recent Price: 19.30 Smart Investing & Trading Score: 18 | |
| Day Percent Change: 4.27% Day Change: 0.79 | |
| Week Change: 5.23% Year-to-date Change: 2.0% | |
| SGH Links: Profile News Message Board | |
| Charts:- Daily , Weekly | |
| Add SGH to Watchlist: View: Get Complete SGH Trend Analysis ➞ | |
 | ACMR ACM Research, Inc. |
| Sector: Technology | |
| SubSector: Semiconductor Equipment & Materials | |
| MarketCap: 438.718 Millions | |
| Recent Price: 27.64 Smart Investing & Trading Score: 22 | |
| Day Percent Change: 4.26% Day Change: 1.13 | |
| Week Change: 2.22% Year-to-date Change: 41.5% | |
| ACMR Links: Profile News Message Board | |
| Charts:- Daily , Weekly | |
| Add ACMR to Watchlist: View: Get Complete ACMR Trend Analysis ➞ | |
| For tabular summary view of above stock list: Summary View ➞ 0 - 25 , 25 - 50 , 50 - 75 , 75 - 100 , 100 - 125 , 125 - 150 , 150 - 175 , 175 - 200 , 200 - 225 , 225 - 250 , 250 - 275 , 275 - 300 , 300 - 325 , 325 - 350 , 350 - 375 , 375 - 400 , 400 - 425 , 425 - 450 , 450 - 475 , 475 - 500 , 500 - 525 , 525 - 550 , 550 - 575 , 575 - 600 , 600 - 625 , 625 - 650 , 650 - 675 , 675 - 700 , 700 - 725 , 725 - 750 , 750 - 775 , 775 - 800 , 800 - 825 , 825 - 850 , 850 - 875 , 875 - 900 , 900 - 925 , 925 - 950 , 950 - 975 , 975 - 1000 , 1000 - 1025 , 1025 - 1050 , 1050 - 1075 , 1075 - 1100 , 1100 - 1125 , 1125 - 1150 , 1150 - 1175 , 1175 - 1200 , 1200 - 1225 , 1225 - 1250 , 1250 - 1275 , 1275 - 1300 , 1300 - 1325 , 1325 - 1350 , 1350 - 1375 , 1375 - 1400 , 1400 - 1425 , 1425 - 1450 , 1450 - 1475 , 1475 - 1500 , 1500 - 1525 , 1525 - 1550 , 1550 - 1575 , 1575 - 1600 | ||
| Click To Change The Sort Order: By Market Cap or Company Size Performance: Year-to-date, Week and Day | |
| Select Chart Type: | ||
| Too many stocks? View smallcap stocks filtered by marketcap & sector |
| Marketcap: All SmallCap Stocks (default-no microcap), Large, Mid-Range, Small & MicroCap |
| Sector: Tech, Finance, Energy, Staples, Retail, Industrial, Materials, Utilities & Medical |
|
Best Stocks Today 12Stocks.com |
© 2024 12Stocks.com Terms & Conditions Privacy Contact Us
All Information Provided Only For Education And Not To Be Used For Investing or Trading. See Terms & Conditions


One More Thing ... Get Best Stocks Delivered Daily!
Never Ever Miss A Move With Our Top Ten Stocks Lists
Find Best Stocks In Any Market - Bull or Bear Market
Take A Peek At Our Top Ten Stocks Lists: Daily, Weekly, Year-to-Date & Top Trends
Find Best Stocks In Any Market - Bull or Bear Market
Take A Peek At Our Top Ten Stocks Lists: Daily, Weekly, Year-to-Date & Top Trends
Smallcap Stocks With Best Up Trends [0-bearish to 100-bullish]: Origin Materials[100], Clearfield [100], Fluence Energy[100], Emergent BioSolutions[100], TPI Composites[100], ALLETE [100], E.W. Scripps[100], Conduent [100], Cutera [100], Bloom Energy[100], Super Group[100]
Best Smallcap Stocks Year-to-Date:
Janux [458.63%], Longboard [289.77%], Alpine Immune[239.36%], Avidity Biosciences[198.01%], Bakkt [194.84%], Vera [187.73%], Cullinan Oncology[177.78%], Super Micro[177.56%], Arcutis Bio[169.66%], Y-mAbs [154.69%], Sana [148.85%] Best Smallcap Stocks This Week:
Emergent BioSolutions[88.54%], Deciphera [73.28%], Origin Materials[59.41%], Eyenovia [59.18%], Enovix [54.87%], Codexis [46.8%], Cue Biopharma[41.39%], WideOpenWest [41.07%], TPI Composites[40.65%], Seres [39.39%], Carvana Co[39.19%] Best Smallcap Stocks Daily:
WideOpenWest [29.16%], Alignment Healthcare[24.23%], Ardelyx [23.42%], Twist Bioscience[23.18%], El Pollo[21.45%], IES [20.21%], Vaxxinity [17.64%], Enovix [17.26%], Origin Materials[17.01%], Codexis [16.92%], Adtalem Global[16.86%]