
 Login Sign Up


| |||||
 |  | ||||

| 12Stocks.com Market Intelligence |
Best SmallCap Stocks
|
| In a hurry? Small Cap Stock Lists: Performance Trends Table, Stock Charts
Sort Small Cap stocks: Daily, Weekly, Year-to-Date, Market Cap & Trends. Filter Small Cap stocks list by sector: Show all, Tech, Finance, Energy, Staples, Retail, Industrial, Materials, Utilities and HealthCare Filter Small Cap stocks list by size: All Large Medium Small and MicroCap |
| 12Stocks.com Small Cap Stocks Performances & Trends Daily | |||||||||
|
|  The overall Smart Investing & Trading Score is 49 (0-bearish to 100-bullish) which puts Small Cap index in short term neutral trend. The Smart Investing & Trading Score from previous trading session is 14 and hence an improvement of trend.
| ||||||||
Here are the Smart Investing & Trading Scores of the most requested small cap stocks at 12Stocks.com (click stock name for detailed review):
|


| 12Stocks.com: Investing in Smallcap Index with Stocks | |
|
The following table helps investors and traders sort through current performance and trends (as measured by Smart Investing & Trading Score) of various
stocks in the Smallcap Index. Quick View: Move mouse or cursor over stock symbol (ticker) to view short-term technical chart and over stock name to view long term chart. Click on  to add stock symbol to your watchlist and to add stock symbol to your watchlist and  to view watchlist. Click on any ticker or stock name for detailed market intelligence report for that stock. to view watchlist. Click on any ticker or stock name for detailed market intelligence report for that stock. |
12Stocks.com Performance of Stocks in Smallcap Index
| Ticker | Stock Name | Watchlist | Category | Recent Price | Smart Investing & Trading Score | Change % | YTD Change% |
| FIZZ | National Beverage |   | Consumer Staples | 46.90 | 67 | 4.34 | -5.67% |
| ATNI | ATN | | Technology | 21.03 | 32 | 4.32 | -46.04% |
| EGBN | Eagle Bancorp | | Financials | 19.79 | 52 | 4.32 | -34.34% |
| DXPE | DXP Enterprises | | Services & Goods | 51.81 | 68 | 4.31 | 53.74% |
| SMR | NuScale Power | | Industrials | 5.97 | 63 | 4.28 | 85.27% |
| SMRT | SmartRent | | Technology | 2.44 | 49 | 4.27 | -23.51% |
| FHTX | Foghorn | | Health Care | 6.11 | 49 | 4.27 | -4.75% |
| BNL | Broadstone Net | | Financials | 15.24 | 100 | 4.24 | -11.50% |
| WWW | Wolverine World | | Consumer Staples | 10.89 | 95 | 4.21 | 22.50% |
| MCB | Metropolitan Bank | | Financials | 42.63 | 88 | 4.20 | -23.02% |
| CMC | Commercial Metals | | Materials | 56.46 | 95 | 4.19 | 12.83% |
| BIPC | Brookfield Infrastructure | | Utilities | 32.54 | 74 | 4.19 | -7.77% |
| FL | Foot Locker | | Consumer Staples | 21.45 | 35 | 4.18 | -31.14% |
| TCBK | TriCo Bancshares | | Financials | 37.18 | 100 | 4.17 | -13.47% |
| FORR | Forrester Research | | Services & Goods | 18.34 | 30 | 4.15 | -31.59% |
| ANIK | Anika | | Health Care | 27.59 | 100 | 4.15 | 21.76% |
| ARWR | Arrowhead | | Health Care | 24.13 | 49 | 4.14 | -21.14% |
| PACB | Pacific Biosciences | | Health Care | 1.76 | 49 | 4.14 | -82.06% |
| GVA | Granite Construction | | Industrials | 57.26 | 95 | 4.13 | 12.58% |
| APPS | Digital Turbine | | Technology | 2.02 | 67 | 4.12 | -70.55% |
| CALM | Cal-Maine Foods | | Consumer Staples | 57.52 | 48 | 4.11 | 0.23% |
| UHG | United Homes | | Services & Goods | 6.84 | 74 | 4.11 | -18.47% |
| LBPH | Longboard | | Health Care | 22.85 | 95 | 4.10 | 273.98% |
| WALD | Waldencast | | Technology | 5.21 | 42 | 4.10 | -53.92% |
| UNFI | United Natural | | Consumer Staples | 9.41 | 59 | 4.09 | -42.02% |


| Too many stocks? View smallcap stocks filtered by marketcap & sector |
| Marketcap: All SmallCap Stocks (default-no microcap), Large, Mid-Range, Small |
| Smallcap Sector: Tech, Finance, Energy, Staples, Retail, Industrial, Materials, & Medical |
|
Get the most comprehensive stock market coverage daily at 12Stocks.com ➞ Best Stocks Today ➞ Best Stocks Weekly ➞ Best Stocks Year-to-Date ➞ Best Stocks Trends ➞  Best Stocks Today 12Stocks.com Best Nasdaq Stocks ➞ Best S&P 500 Stocks ➞ Best Tech Stocks ➞ Best Biotech Stocks ➞ |
| Detailed Overview of SmallCap Stocks |
| SmallCap Technical Overview, Leaders & Laggards, Top SmallCap ETF Funds & Detailed SmallCap Stocks List, Charts, Trends & More |
| Smallcap: Technical Analysis, Trends & YTD Performance | |
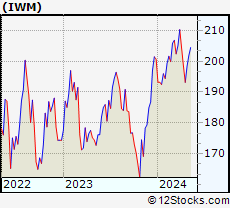
| SmallCap segment as represented by
IWM, an exchange-traded fund [ETF], holds basket of thousands of smallcap stocks from across all major sectors of the US stock market. The smallcap index (contains stocks like Riverbed & Sotheby's) is down by -0.39% and is currently underperforming the overall market by -6.01% year-to-date. Below is a quick view of technical charts and trends: | |
 IWM Weekly Chart |
|
| Long Term Trend: Not Good | |
| Medium Term Trend: Good | |
 IWM Daily Chart |
|
| Short Term Trend: Deteriorating | |
| Overall Trend Score: 49 | |
| YTD Performance: -0.39% | |
| **Trend Scores & Views Are Only For Educational Purposes And Not For Investing | |
| 12Stocks.com: Top Performing Small Cap Index Stocks | ||||||||||||||||||||||||||||||||||||||||||||||||
 The top performing Small Cap Index stocks year to date are
Now, more recently, over last week, the top performing Small Cap Index stocks on the move are


|
||||||||||||||||||||||||||||||||||||||||||||||||
| 12Stocks.com: Investing in Smallcap Index using Exchange Traded Funds | |
|
The following table shows list of key exchange traded funds (ETF) that
help investors track Smallcap index. The following list also includes leveraged ETF funds that track twice or thrice the daily returns of Smallcap indices. Short or inverse ETF funds move in the opposite direction to the index they track and are useful during market pullbacks or during bear markets. Quick View: Move mouse or cursor over ETF symbol (ticker) to view short-term technical chart and over ETF name to view long term chart. Click on ticker or stock name for detailed view. Click on to add stock symbol to your watchlist and to view watchlist. |
12Stocks.com List of ETFs that track Smallcap Index
| Ticker | ETF Name | Watchlist | Recent Price | Smart Investing & Trading Score | Change % | Week % | Year-to-date % |
| IWM | iShares Russell 2000 | | 199.92 | 49 | 1.84 | 0.77 | -0.39% |
| IJR | iShares Core S&P Small-Cap | | 106.33 | 50 | 1.52 | 0.64 | -1.77% |
| VTWO | Vanguard Russell 2000 ETF | | 80.85 | 42 | 1.88 | 0.79 | -0.31% |
| IWN | iShares Russell 2000 Value | | 152.88 | 75 | 2.04 | 1.15 | -1.58% |
| IWO | iShares Russell 2000 Growth | | 254.34 | 32 | 1.91 | 0.49 | 0.84% |
| IJS | iShares S&P Small-Cap 600 Value | | 98.02 | 43 | 1.68 | 0.85 | -4.9% |
| IJT | iShares S&P Small-Cap 600 Growth | | 126.72 | 63 | 1.42 | 0.5 | 1.26% |
| XSLV | PowerShares S&P SmallCap Low Volatil ETF | | 43.14 | 73 | 0.72 | 0.98 | -2.29% |
| SDD | ProShares UltraShort SmallCap600 | | 19.31 | 56 | -2.02 | -0.21 | 4.79% |
| SMLV | SPDR SSGA US Small Cap Low Volatil ETF | | 108.83 | 87 | 1.30 | 1.22 | -3.27% |
| SAA | ProShares Ultra SmallCap600 | | 22.93 | 42 | 1.56 | -0.46 | -8.08% |
| SBB | ProShares Short SmallCap600 | | 16.37 | 49 | -1.14 | -0.09 | 2.76% |
| 12Stocks.com: Charts, Trends, Fundamental Data and Performances of SmallCap Stocks | |
|
We now take in-depth look at all SmallCap stocks including charts, multi-period performances and overall trends (as measured by Smart Investing & Trading Score). One can sort SmallCap stocks (click link to choose) by Daily, Weekly and by Year-to-Date performances. Also, one can sort by size of the company or by market capitalization. |
| Select Your Default Chart Type: | |||||
| |||||
| Click on stock symbol or name for detailed view. Click on to add stock symbol to your watchlist and to view watchlist. Quick View: Move mouse or cursor over "Daily" to quickly view daily technical stock chart and over "Weekly" to view weekly technical stock chart. | |||||

 | FIZZ National Beverage Corp. |
| Sector: Consumer Staples | |
| SubSector: Beverages - Soft Drinks | |
| MarketCap: 2031.4 Millions | |
| Recent Price: 46.90 Smart Investing & Trading Score: 67 | |
| Day Percent Change: 4.34% Day Change: 1.95 | |
| Week Change: 7.67% Year-to-date Change: -5.7% | |
| FIZZ Links: Profile News Message Board | |
| Charts:- Daily , Weekly | |
| Add FIZZ to Watchlist: View: Get Complete FIZZ Trend Analysis ➞ | |
 | ATNI ATN International, Inc. |
| Sector: Technology | |
| SubSector: Telecom Services - Domestic | |
| MarketCap: 1014.77 Millions | |
| Recent Price: 21.03 Smart Investing & Trading Score: 32 | |
| Day Percent Change: 4.32% Day Change: 0.87 | |
| Week Change: 7.74% Year-to-date Change: -46.0% | |
| ATNI Links: Profile News Message Board | |
| Charts:- Daily , Weekly | |
| Add ATNI to Watchlist: View: Get Complete ATNI Trend Analysis ➞ | |
 | EGBN Eagle Bancorp, Inc. |
| Sector: Financials | |
| SubSector: Regional - Mid-Atlantic Banks | |
| MarketCap: 906.559 Millions | |
| Recent Price: 19.79 Smart Investing & Trading Score: 52 | |
| Day Percent Change: 4.32% Day Change: 0.82 | |
| Week Change: 1.96% Year-to-date Change: -34.3% | |
| EGBN Links: Profile News Message Board | |
| Charts:- Daily , Weekly | |
| Add EGBN to Watchlist: View: Get Complete EGBN Trend Analysis ➞ | |
 | DXPE DXP Enterprises, Inc. |
| Sector: Services & Goods | |
| SubSector: Industrial Equipment Wholesale | |
| MarketCap: 243.758 Millions | |
| Recent Price: 51.81 Smart Investing & Trading Score: 68 | |
| Day Percent Change: 4.31% Day Change: 2.14 | |
| Week Change: 1.79% Year-to-date Change: 53.7% | |
| DXPE Links: Profile News Message Board | |
| Charts:- Daily , Weekly | |
| Add DXPE to Watchlist: View: Get Complete DXPE Trend Analysis ➞ | |
 | SMR NuScale Power Corporation |
| Sector: Industrials | |
| SubSector: Specialty Industrial Machinery | |
| MarketCap: 1510 Millions | |
| Recent Price: 5.97 Smart Investing & Trading Score: 63 | |
| Day Percent Change: 4.28% Day Change: 0.24 | |
| Week Change: -1.4% Year-to-date Change: 85.3% | |
| SMR Links: Profile News Message Board | |
| Charts:- Daily , Weekly | |
| Add SMR to Watchlist: View: Get Complete SMR Trend Analysis ➞ | |
 | SMRT SmartRent, Inc. |
| Sector: Technology | |
| SubSector: Software - Application | |
| MarketCap: 733 Millions | |
| Recent Price: 2.44 Smart Investing & Trading Score: 49 | |
| Day Percent Change: 4.27% Day Change: 0.10 | |
| Week Change: 3.39% Year-to-date Change: -23.5% | |
| SMRT Links: Profile News Message Board | |
| Charts:- Daily , Weekly | |
| Add SMRT to Watchlist: View: Get Complete SMRT Trend Analysis ➞ | |
 | FHTX Foghorn Therapeutics Inc. |
| Sector: Health Care | |
| SubSector: Biotechnology | |
| MarketCap: 74487 Millions | |
| Recent Price: 6.11 Smart Investing & Trading Score: 49 | |
| Day Percent Change: 4.27% Day Change: 0.25 | |
| Week Change: 11.29% Year-to-date Change: -4.8% | |
| FHTX Links: Profile News Message Board | |
| Charts:- Daily , Weekly | |
| Add FHTX to Watchlist: View: Get Complete FHTX Trend Analysis ➞ | |
 | BNL Broadstone Net Lease, Inc. |
| Sector: Financials | |
| SubSector: REIT Diversified | |
| MarketCap: 27267 Millions | |
| Recent Price: 15.24 Smart Investing & Trading Score: 100 | |
| Day Percent Change: 4.24% Day Change: 0.62 | |
| Week Change: 6.35% Year-to-date Change: -11.5% | |
| BNL Links: Profile News Message Board | |
| Charts:- Daily , Weekly | |
| Add BNL to Watchlist: View: Get Complete BNL Trend Analysis ➞ | |
 | WWW Wolverine World Wide, Inc. |
| Sector: Consumer Staples | |
| SubSector: Textile - Apparel Footwear & Accessories | |
| MarketCap: 1390.7 Millions | |
| Recent Price: 10.89 Smart Investing & Trading Score: 95 | |
| Day Percent Change: 4.21% Day Change: 0.44 | |
| Week Change: -0.09% Year-to-date Change: 22.5% | |
| WWW Links: Profile News Message Board | |
| Charts:- Daily , Weekly | |
| Add WWW to Watchlist: View: Get Complete WWW Trend Analysis ➞ | |
 | MCB Metropolitan Bank Holding Corp. |
| Sector: Financials | |
| SubSector: Regional - Northeast Banks | |
| MarketCap: 212.999 Millions | |
| Recent Price: 42.63 Smart Investing & Trading Score: 88 | |
| Day Percent Change: 4.20% Day Change: 1.72 | |
| Week Change: 1.19% Year-to-date Change: -23.0% | |
| MCB Links: Profile News Message Board | |
| Charts:- Daily , Weekly | |
| Add MCB to Watchlist: View: Get Complete MCB Trend Analysis ➞ | |
 | CMC Commercial Metals Company |
| Sector: Materials | |
| SubSector: Steel & Iron | |
| MarketCap: 1724.78 Millions | |
| Recent Price: 56.46 Smart Investing & Trading Score: 95 | |
| Day Percent Change: 4.19% Day Change: 2.27 | |
| Week Change: 5.57% Year-to-date Change: 12.8% | |
| CMC Links: Profile News Message Board | |
| Charts:- Daily , Weekly | |
| Add CMC to Watchlist: View: Get Complete CMC Trend Analysis ➞ | |
 | BIPC Brookfield Infrastructure Corporation |
| Sector: Utilities | |
| SubSector: Utilities Regulated Gas | |
| MarketCap: 31197 Millions | |
| Recent Price: 32.54 Smart Investing & Trading Score: 74 | |
| Day Percent Change: 4.19% Day Change: 1.31 | |
| Week Change: 3.96% Year-to-date Change: -7.8% | |
| BIPC Links: Profile News Message Board | |
| Charts:- Daily , Weekly | |
| Add BIPC to Watchlist: View: Get Complete BIPC Trend Analysis ➞ | |
 | FL Foot Locker, Inc. |
| Sector: Consumer Staples | |
| SubSector: Textile - Apparel Footwear & Accessories | |
| MarketCap: 2463.6 Millions | |
| Recent Price: 21.45 Smart Investing & Trading Score: 35 | |
| Day Percent Change: 4.18% Day Change: 0.86 | |
| Week Change: -2.41% Year-to-date Change: -31.1% | |
| FL Links: Profile News Message Board | |
| Charts:- Daily , Weekly | |
| Add FL to Watchlist: View: Get Complete FL Trend Analysis ➞ | |
 | TCBK TriCo Bancshares |
| Sector: Financials | |
| SubSector: Regional - Pacific Banks | |
| MarketCap: 875.129 Millions | |
| Recent Price: 37.18 Smart Investing & Trading Score: 100 | |
| Day Percent Change: 4.17% Day Change: 1.49 | |
| Week Change: 9.84% Year-to-date Change: -13.5% | |
| TCBK Links: Profile News Message Board | |
| Charts:- Daily , Weekly | |
| Add TCBK to Watchlist: View: Get Complete TCBK Trend Analysis ➞ | |
 | FORR Forrester Research, Inc. |
| Sector: Services & Goods | |
| SubSector: Research Services | |
| MarketCap: 473.394 Millions | |
| Recent Price: 18.34 Smart Investing & Trading Score: 30 | |
| Day Percent Change: 4.15% Day Change: 0.73 | |
| Week Change: -2.29% Year-to-date Change: -31.6% | |
| FORR Links: Profile News Message Board | |
| Charts:- Daily , Weekly | |
| Add FORR to Watchlist: View: Get Complete FORR Trend Analysis ➞ | |
 | ANIK Anika Therapeutics, Inc. |
| Sector: Health Care | |
| SubSector: Biotechnology | |
| MarketCap: 438.385 Millions | |
| Recent Price: 27.59 Smart Investing & Trading Score: 100 | |
| Day Percent Change: 4.15% Day Change: 1.10 | |
| Week Change: 7.9% Year-to-date Change: 21.8% | |
| ANIK Links: Profile News Message Board | |
| Charts:- Daily , Weekly | |
| Add ANIK to Watchlist: View: Get Complete ANIK Trend Analysis ➞ | |
 | ARWR Arrowhead Pharmaceuticals, Inc. |
| Sector: Health Care | |
| SubSector: Biotechnology | |
| MarketCap: 3226.15 Millions | |
| Recent Price: 24.13 Smart Investing & Trading Score: 49 | |
| Day Percent Change: 4.14% Day Change: 0.96 | |
| Week Change: 9.09% Year-to-date Change: -21.1% | |
| ARWR Links: Profile News Message Board | |
| Charts:- Daily , Weekly | |
| Add ARWR to Watchlist: View: Get Complete ARWR Trend Analysis ➞ | |
 | PACB Pacific Biosciences of California, Inc. |
| Sector: Health Care | |
| SubSector: Biotechnology | |
| MarketCap: 470.685 Millions | |
| Recent Price: 1.76 Smart Investing & Trading Score: 49 | |
| Day Percent Change: 4.14% Day Change: 0.07 | |
| Week Change: 19.73% Year-to-date Change: -82.1% | |
| PACB Links: Profile News Message Board | |
| Charts:- Daily , Weekly | |
| Add PACB to Watchlist: View: Get Complete PACB Trend Analysis ➞ | |
 | GVA Granite Construction Incorporated |
| Sector: Industrials | |
| SubSector: Heavy Construction | |
| MarketCap: 725.895 Millions | |
| Recent Price: 57.26 Smart Investing & Trading Score: 95 | |
| Day Percent Change: 4.13% Day Change: 2.27 | |
| Week Change: 3.12% Year-to-date Change: 12.6% | |
| GVA Links: Profile News Message Board | |
| Charts:- Daily , Weekly | |
| Add GVA to Watchlist: View: Get Complete GVA Trend Analysis ➞ | |
 | APPS Digital Turbine, Inc. |
| Sector: Technology | |
| SubSector: Application Software | |
| MarketCap: 437.262 Millions | |
| Recent Price: 2.02 Smart Investing & Trading Score: 67 | |
| Day Percent Change: 4.12% Day Change: 0.08 | |
| Week Change: 10.99% Year-to-date Change: -70.6% | |
| APPS Links: Profile News Message Board | |
| Charts:- Daily , Weekly | |
| Add APPS to Watchlist: View: Get Complete APPS Trend Analysis ➞ | |
 | CALM Cal-Maine Foods, Inc. |
| Sector: Consumer Staples | |
| SubSector: Food - Major Diversified | |
| MarketCap: 2177.13 Millions | |
| Recent Price: 57.52 Smart Investing & Trading Score: 48 | |
| Day Percent Change: 4.11% Day Change: 2.27 | |
| Week Change: 1.14% Year-to-date Change: 0.2% | |
| CALM Links: Profile News Message Board | |
| Charts:- Daily , Weekly | |
| Add CALM to Watchlist: View: Get Complete CALM Trend Analysis ➞ | |
 | UHG United Homes Group, Inc. |
| Sector: Services & Goods | |
| SubSector: Residential Construction | |
| MarketCap: 566 Millions | |
| Recent Price: 6.84 Smart Investing & Trading Score: 74 | |
| Day Percent Change: 4.11% Day Change: 0.27 | |
| Week Change: 2.55% Year-to-date Change: -18.5% | |
| UHG Links: Profile News Message Board | |
| Charts:- Daily , Weekly | |
| Add UHG to Watchlist: View: Get Complete UHG Trend Analysis ➞ | |
 | LBPH Longboard Pharmaceuticals, Inc. |
| Sector: Health Care | |
| SubSector: Biotechnology | |
| MarketCap: 169 Millions | |
| Recent Price: 22.85 Smart Investing & Trading Score: 95 | |
| Day Percent Change: 4.10% Day Change: 0.90 | |
| Week Change: 15.87% Year-to-date Change: 274.0% | |
| LBPH Links: Profile News Message Board | |
| Charts:- Daily , Weekly | |
| Add LBPH to Watchlist: View: Get Complete LBPH Trend Analysis ➞ | |
 | WALD Waldencast plc |
| Sector: Technology | |
| SubSector: Software - Application | |
| MarketCap: 897 Millions | |
| Recent Price: 5.21 Smart Investing & Trading Score: 42 | |
| Day Percent Change: 4.10% Day Change: 0.21 | |
| Week Change: 1.07% Year-to-date Change: -53.9% | |
| WALD Links: Profile News Message Board | |
| Charts:- Daily , Weekly | |
| Add WALD to Watchlist: View: Get Complete WALD Trend Analysis ➞ | |
 | UNFI United Natural Foods, Inc. |
| Sector: Consumer Staples | |
| SubSector: Food Wholesale | |
| MarketCap: 746.329 Millions | |
| Recent Price: 9.41 Smart Investing & Trading Score: 59 | |
| Day Percent Change: 4.09% Day Change: 0.37 | |
| Week Change: 3.07% Year-to-date Change: -42.0% | |
| UNFI Links: Profile News Message Board | |
| Charts:- Daily , Weekly | |
| Add UNFI to Watchlist: View: Get Complete UNFI Trend Analysis ➞ | |
| Too many stocks? View smallcap stocks filtered by marketcap & sector |
| Marketcap: All SmallCap Stocks (default-no microcap), Large, Mid-Range, Small & MicroCap |
| Sector: Tech, Finance, Energy, Staples, Retail, Industrial, Materials, Utilities & Medical |
|
Best Stocks Today 12Stocks.com |
© 2024 12Stocks.com Terms & Conditions Privacy Contact Us
All Information Provided Only For Education And Not To Be Used For Investing or Trading. See Terms & Conditions


One More Thing ... Get Best Stocks Delivered Daily!
Never Ever Miss A Move With Our Top Ten Stocks Lists
Find Best Stocks In Any Market - Bull or Bear Market
Take A Peek At Our Top Ten Stocks Lists: Daily, Weekly, Year-to-Date & Top Trends
Find Best Stocks In Any Market - Bull or Bear Market
Take A Peek At Our Top Ten Stocks Lists: Daily, Weekly, Year-to-Date & Top Trends
Smallcap Stocks With Best Up Trends [0-bearish to 100-bullish]: Emergent BioSolutions[100], Aspen Aerogels[100], Carvana Co[100], Perdoceo Education[100], Gannett Co[100], Pitney Bowes[100], Benchmark Electronics[100], Origin Materials[100], FormFactor [100], Lantheus [100], Q2 [100]
Best Smallcap Stocks Year-to-Date:
Janux [440.16%], Viking [307.09%], Longboard [273.98%], Alpine Immune[239.29%], Bakkt [187.89%], Avidity Biosciences[182.96%], Vera [170.74%], Cullinan Oncology[169.74%], Super Micro[168.25%], Arcutis Bio[166.25%], Y-mAbs [152.93%] Best Smallcap Stocks This Week:
Deciphera [73.24%], Emergent BioSolutions[71.88%], Eyenovia [49.22%], Aspen Aerogels[48.14%], P3 Health[38.51%], Carvana Co[38.18%], Cue Biopharma[37.73%], Origin Materials[36.24%], TransMedics Group[35.14%], Seres [34.55%], Enovix [32.07%] Best Smallcap Stocks Daily:
Emergent BioSolutions[70.98%], Aspen Aerogels[56.70%], Carvana Co[33.77%], Perdoceo Education[31.46%], Enovix [31.06%], Office Properties[28.00%], Gannett Co[26.97%], Sunnova Energy[25.21%], Pitney Bowes[24.70%], Pulmonx [21.50%], CommScope Holding[20.95%]