
 Login Sign Up


| |||||
 |  | ||||

| 12Stocks.com Market Intelligence |
Best SmallCap Stocks
|
| In a hurry? Small Cap Stock Lists: Performance Trends Table, Stock Charts
Sort Small Cap stocks: Daily, Weekly, Year-to-Date, Market Cap & Trends. Filter Small Cap stocks list by sector: Show all, Tech, Finance, Energy, Staples, Retail, Industrial, Materials, Utilities and HealthCare Filter Small Cap stocks list by size: All Large Medium Small and MicroCap |
| 12Stocks.com Small Cap Stocks Performances & Trends Daily | |||||||||
|
|  The overall Smart Investing & Trading Score is 49 (0-bearish to 100-bullish) which puts Small Cap index in short term neutral trend. The Smart Investing & Trading Score from previous trading session is 14 and hence an improvement of trend.
| ||||||||
Here are the Smart Investing & Trading Scores of the most requested small cap stocks at 12Stocks.com (click stock name for detailed review):
|


| 12Stocks.com: Investing in Smallcap Index with Stocks | |
|
The following table helps investors and traders sort through current performance and trends (as measured by Smart Investing & Trading Score) of various
stocks in the Smallcap Index. Quick View: Move mouse or cursor over stock symbol (ticker) to view short-term technical chart and over stock name to view long term chart. Click on  to add stock symbol to your watchlist and to add stock symbol to your watchlist and  to view watchlist. Click on any ticker or stock name for detailed market intelligence report for that stock. to view watchlist. Click on any ticker or stock name for detailed market intelligence report for that stock. |
12Stocks.com Performance of Stocks in Smallcap Index
| Ticker | Stock Name | Watchlist | Category | Recent Price | Smart Investing & Trading Score | Change % | YTD Change% |
| JACK | Jack in |   | Services & Goods | 54.65 | 0 | -1.09 | -33.05% |
| YELP | Yelp | | Technology | 40.00 | 43 | -1.09 | -15.50% |
| RYTM | Rhythm | | Health Care | 40.98 | 64 | -1.09 | -10.85% |
| EAT | Brinker | | Services & Goods | 54.34 | 100 | -1.11 | 25.85% |
| AVAH | Aveanna Healthcare | | Health Care | 2.23 | 28 | -1.11 | -17.07% |
| PTLO | Portillos | | Services & Goods | 11.90 | 10 | -1.12 | -25.89% |
| CXM | Sprinklr | | Technology | 11.81 | 32 | -1.13 | -2.32% |
| VOR | Vor Biopharma | | Health Care | 1.75 | 30 | -1.13 | -21.17% |
| TMCI | Treace Medical | | Health Care | 10.72 | 35 | -1.15 | -15.86% |
| CPRX | Catalyst | | Health Care | 15.02 | 17 | -1.18 | -10.65% |
| APLE | Apple Hospitality | | Financials | 14.67 | 0 | -1.21 | -11.68% |
| DC | Dakota Gold | | Materials | 2.42 | 43 | -1.22 | -6.92% |
| XNCR | Xencor | | Health Care | 23.63 | 100 | -1.25 | 11.30% |
| PFIS | Peoples Financial | | Financials | 38.50 | 59 | -1.26 | -20.94% |
| MYGN | Myriad Genetics | | Services & Goods | 19.22 | 29 | -1.28 | 0.42% |
| PAYS | PaySign | | Services & Goods | 4.61 | 70 | -1.28 | 64.64% |
| DAWN | Day One | | Health Care | 17.43 | 93 | -1.30 | 18.65% |
| CUE | Cue Biopharma | | Health Care | 1.88 | 69 | -1.31 | -28.79% |
| VRCA | Verrica | | Health Care | 6.76 | 38 | -1.31 | -7.65% |
| ZETA | Zeta Global | | Technology | 12.44 | 65 | -1.31 | 40.91% |
| SAGE | Sage | | Health Care | 13.11 | 10 | -1.32 | -39.52% |
| PLMR | Palomar | | Financials | 77.97 | 46 | -1.35 | 40.49% |
| ATI | Allegheny | | Industrials | 58.05 | 93 | -1.36 | 27.67% |
| TCI | Transcontinental Realty | | Financials | 28.23 | 17 | -1.36 | -18.32% |
| MRNS | Marinus | | Health Care | 1.45 | 32 | -1.36 | -86.66% |


| Too many stocks? View smallcap stocks filtered by marketcap & sector |
| Marketcap: All SmallCap Stocks (default-no microcap), Large, Mid-Range, Small |
| Smallcap Sector: Tech, Finance, Energy, Staples, Retail, Industrial, Materials, & Medical |
|
Get the most comprehensive stock market coverage daily at 12Stocks.com ➞ Best Stocks Today ➞ Best Stocks Weekly ➞ Best Stocks Year-to-Date ➞ Best Stocks Trends ➞  Best Stocks Today 12Stocks.com Best Nasdaq Stocks ➞ Best S&P 500 Stocks ➞ Best Tech Stocks ➞ Best Biotech Stocks ➞ |
| Detailed Overview of SmallCap Stocks |
| SmallCap Technical Overview, Leaders & Laggards, Top SmallCap ETF Funds & Detailed SmallCap Stocks List, Charts, Trends & More |
| Smallcap: Technical Analysis, Trends & YTD Performance | |
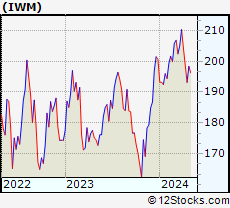
| SmallCap segment as represented by
IWM, an exchange-traded fund [ETF], holds basket of thousands of smallcap stocks from across all major sectors of the US stock market. The smallcap index (contains stocks like Riverbed & Sotheby's) is down by -0.39% and is currently underperforming the overall market by -6.01% year-to-date. Below is a quick view of technical charts and trends: | |
 IWM Weekly Chart |
|
| Long Term Trend: Not Good | |
| Medium Term Trend: Good | |
 IWM Daily Chart |
|
| Short Term Trend: Deteriorating | |
| Overall Trend Score: 49 | |
| YTD Performance: -0.39% | |
| **Trend Scores & Views Are Only For Educational Purposes And Not For Investing | |
| 12Stocks.com: Top Performing Small Cap Index Stocks | ||||||||||||||||||||||||||||||||||||||||||||||||
 The top performing Small Cap Index stocks year to date are
Now, more recently, over last week, the top performing Small Cap Index stocks on the move are


|
||||||||||||||||||||||||||||||||||||||||||||||||
| 12Stocks.com: Investing in Smallcap Index using Exchange Traded Funds | |
|
The following table shows list of key exchange traded funds (ETF) that
help investors track Smallcap index. The following list also includes leveraged ETF funds that track twice or thrice the daily returns of Smallcap indices. Short or inverse ETF funds move in the opposite direction to the index they track and are useful during market pullbacks or during bear markets. Quick View: Move mouse or cursor over ETF symbol (ticker) to view short-term technical chart and over ETF name to view long term chart. Click on ticker or stock name for detailed view. Click on to add stock symbol to your watchlist and to view watchlist. |
12Stocks.com List of ETFs that track Smallcap Index
| Ticker | ETF Name | Watchlist | Recent Price | Smart Investing & Trading Score | Change % | Week % | Year-to-date % |
| IWM | iShares Russell 2000 | | 199.92 | 49 | 1.84 | 0.77 | -0.39% |
| IJR | iShares Core S&P Small-Cap | | 106.33 | 50 | 1.52 | 0.64 | -1.77% |
| VTWO | Vanguard Russell 2000 ETF | | 80.85 | 42 | 1.88 | 0.79 | -0.31% |
| IWN | iShares Russell 2000 Value | | 152.88 | 75 | 2.04 | 1.15 | -1.58% |
| IWO | iShares Russell 2000 Growth | | 254.34 | 32 | 1.91 | 0.49 | 0.84% |
| IJS | iShares S&P Small-Cap 600 Value | | 98.02 | 43 | 1.68 | 0.85 | -4.9% |
| IJT | iShares S&P Small-Cap 600 Growth | | 126.72 | 63 | 1.42 | 0.5 | 1.26% |
| XSLV | PowerShares S&P SmallCap Low Volatil ETF | | 43.14 | 73 | 0.72 | 0.98 | -2.29% |
| SDD | ProShares UltraShort SmallCap600 | | 19.31 | 56 | -2.02 | -0.21 | 4.79% |
| SMLV | SPDR SSGA US Small Cap Low Volatil ETF | | 108.83 | 87 | 1.30 | 1.22 | -3.27% |
| SAA | ProShares Ultra SmallCap600 | | 22.93 | 42 | 1.56 | -0.46 | -8.08% |
| SBB | ProShares Short SmallCap600 | | 16.37 | 49 | -1.14 | -0.09 | 2.76% |
| 12Stocks.com: Charts, Trends, Fundamental Data and Performances of SmallCap Stocks | |
|
We now take in-depth look at all SmallCap stocks including charts, multi-period performances and overall trends (as measured by Smart Investing & Trading Score). One can sort SmallCap stocks (click link to choose) by Daily, Weekly and by Year-to-Date performances. Also, one can sort by size of the company or by market capitalization. |
| Select Your Default Chart Type: | |||||
| |||||
| Click on stock symbol or name for detailed view. Click on to add stock symbol to your watchlist and to view watchlist. Quick View: Move mouse or cursor over "Daily" to quickly view daily technical stock chart and over "Weekly" to view weekly technical stock chart. | |||||

 | JACK Jack in the Box Inc. |
| Sector: Services & Goods | |
| SubSector: Restaurants | |
| MarketCap: 633.87 Millions | |
| Recent Price: 54.65 Smart Investing & Trading Score: 0 | |
| Day Percent Change: -1.09% Day Change: -0.60 | |
| Week Change: -7.04% Year-to-date Change: -33.1% | |
| JACK Links: Profile News Message Board | |
| Charts:- Daily , Weekly | |
| Add JACK to Watchlist: View: Get Complete JACK Trend Analysis ➞ | |
 | YELP Yelp Inc. |
| Sector: Technology | |
| SubSector: Internet Information Providers | |
| MarketCap: 1430.1 Millions | |
| Recent Price: 40.00 Smart Investing & Trading Score: 43 | |
| Day Percent Change: -1.09% Day Change: -0.44 | |
| Week Change: -2.01% Year-to-date Change: -15.5% | |
| YELP Links: Profile News Message Board | |
| Charts:- Daily , Weekly | |
| Add YELP to Watchlist: View: Get Complete YELP Trend Analysis ➞ | |
 | RYTM Rhythm Pharmaceuticals, Inc. |
| Sector: Health Care | |
| SubSector: Biotechnology | |
| MarketCap: 643.685 Millions | |
| Recent Price: 40.98 Smart Investing & Trading Score: 64 | |
| Day Percent Change: -1.09% Day Change: -0.45 | |
| Week Change: 7.05% Year-to-date Change: -10.9% | |
| RYTM Links: Profile News Message Board | |
| Charts:- Daily , Weekly | |
| Add RYTM to Watchlist: View: Get Complete RYTM Trend Analysis ➞ | |
 | EAT Brinker International, Inc. |
| Sector: Services & Goods | |
| SubSector: Restaurants | |
| MarketCap: 435.97 Millions | |
| Recent Price: 54.34 Smart Investing & Trading Score: 100 | |
| Day Percent Change: -1.11% Day Change: -0.61 | |
| Week Change: 11.28% Year-to-date Change: 25.9% | |
| EAT Links: Profile News Message Board | |
| Charts:- Daily , Weekly | |
| Add EAT to Watchlist: View: Get Complete EAT Trend Analysis ➞ | |
 | AVAH Aveanna Healthcare Holdings Inc. |
| Sector: Health Care | |
| SubSector: Medical Care Facilities | |
| MarketCap: 305 Millions | |
| Recent Price: 2.23 Smart Investing & Trading Score: 28 | |
| Day Percent Change: -1.11% Day Change: -0.02 | |
| Week Change: 1.59% Year-to-date Change: -17.1% | |
| AVAH Links: Profile News Message Board | |
| Charts:- Daily , Weekly | |
| Add AVAH to Watchlist: View: Get Complete AVAH Trend Analysis ➞ | |
 | PTLO Portillos Inc. |
| Sector: Services & Goods | |
| SubSector: Restaurants | |
| MarketCap: 1590 Millions | |
| Recent Price: 11.90 Smart Investing & Trading Score: 10 | |
| Day Percent Change: -1.12% Day Change: -0.13 | |
| Week Change: -1.04% Year-to-date Change: -25.9% | |
| PTLO Links: Profile News Message Board | |
| Charts:- Daily , Weekly | |
| Add PTLO to Watchlist: View: Get Complete PTLO Trend Analysis ➞ | |
 | CXM Sprinklr, Inc. |
| Sector: Technology | |
| SubSector: Software - Application | |
| MarketCap: 3700 Millions | |
| Recent Price: 11.81 Smart Investing & Trading Score: 32 | |
| Day Percent Change: -1.13% Day Change: -0.13 | |
| Week Change: -1.05% Year-to-date Change: -2.3% | |
| CXM Links: Profile News Message Board | |
| Charts:- Daily , Weekly | |
| Add CXM to Watchlist: View: Get Complete CXM Trend Analysis ➞ | |
 | VOR Vor Biopharma Inc. |
| Sector: Health Care | |
| SubSector: Biotechnology | |
| MarketCap: 224 Millions | |
| Recent Price: 1.75 Smart Investing & Trading Score: 30 | |
| Day Percent Change: -1.13% Day Change: -0.02 | |
| Week Change: 3.55% Year-to-date Change: -21.2% | |
| VOR Links: Profile News Message Board | |
| Charts:- Daily , Weekly | |
| Add VOR to Watchlist: View: Get Complete VOR Trend Analysis ➞ | |
 | TMCI Treace Medical Concepts, Inc. |
| Sector: Health Care | |
| SubSector: Medical Devices | |
| MarketCap: 1550 Millions | |
| Recent Price: 10.72 Smart Investing & Trading Score: 35 | |
| Day Percent Change: -1.15% Day Change: -0.13 | |
| Week Change: 3.18% Year-to-date Change: -15.9% | |
| TMCI Links: Profile News Message Board | |
| Charts:- Daily , Weekly | |
| Add TMCI to Watchlist: View: Get Complete TMCI Trend Analysis ➞ | |
 | CPRX Catalyst Pharmaceuticals, Inc. |
| Sector: Health Care | |
| SubSector: Biotechnology | |
| MarketCap: 365.185 Millions | |
| Recent Price: 15.02 Smart Investing & Trading Score: 17 | |
| Day Percent Change: -1.18% Day Change: -0.18 | |
| Week Change: 0.87% Year-to-date Change: -10.7% | |
| CPRX Links: Profile News Message Board | |
| Charts:- Daily , Weekly | |
| Add CPRX to Watchlist: View: Get Complete CPRX Trend Analysis ➞ | |
 | APLE Apple Hospitality REIT, Inc. |
| Sector: Financials | |
| SubSector: REIT - Hotel/Motel | |
| MarketCap: 1515.74 Millions | |
| Recent Price: 14.67 Smart Investing & Trading Score: 0 | |
| Day Percent Change: -1.21% Day Change: -0.18 | |
| Week Change: -2.2% Year-to-date Change: -11.7% | |
| APLE Links: Profile News Message Board | |
| Charts:- Daily , Weekly | |
| Add APLE to Watchlist: View: Get Complete APLE Trend Analysis ➞ | |
 | DC Dakota Gold Corp. |
| Sector: Materials | |
| SubSector: Gold | |
| MarketCap: 218 Millions | |
| Recent Price: 2.42 Smart Investing & Trading Score: 43 | |
| Day Percent Change: -1.22% Day Change: -0.03 | |
| Week Change: -5.84% Year-to-date Change: -6.9% | |
| DC Links: Profile News Message Board | |
| Charts:- Daily , Weekly | |
| Add DC to Watchlist: View: Get Complete DC Trend Analysis ➞ | |
 | XNCR Xencor, Inc. |
| Sector: Health Care | |
| SubSector: Biotechnology | |
| MarketCap: 1744.35 Millions | |
| Recent Price: 23.63 Smart Investing & Trading Score: 100 | |
| Day Percent Change: -1.25% Day Change: -0.30 | |
| Week Change: 18.27% Year-to-date Change: 11.3% | |
| XNCR Links: Profile News Message Board | |
| Charts:- Daily , Weekly | |
| Add XNCR to Watchlist: View: Get Complete XNCR Trend Analysis ➞ | |
 | PFIS Peoples Financial Services Corp. |
| Sector: Financials | |
| SubSector: Regional - Northeast Banks | |
| MarketCap: 305.499 Millions | |
| Recent Price: 38.50 Smart Investing & Trading Score: 59 | |
| Day Percent Change: -1.26% Day Change: -0.49 | |
| Week Change: 0.57% Year-to-date Change: -20.9% | |
| PFIS Links: Profile News Message Board | |
| Charts:- Daily , Weekly | |
| Add PFIS to Watchlist: View: Get Complete PFIS Trend Analysis ➞ | |
 | MYGN Myriad Genetics, Inc. |
| Sector: Services & Goods | |
| SubSector: Research Services | |
| MarketCap: 1051.94 Millions | |
| Recent Price: 19.22 Smart Investing & Trading Score: 29 | |
| Day Percent Change: -1.28% Day Change: -0.25 | |
| Week Change: 5.72% Year-to-date Change: 0.4% | |
| MYGN Links: Profile News Message Board | |
| Charts:- Daily , Weekly | |
| Add MYGN to Watchlist: View: Get Complete MYGN Trend Analysis ➞ | |
 | PAYS PaySign, Inc. |
| Sector: Services & Goods | |
| SubSector: Business Services | |
| MarketCap: 213.882 Millions | |
| Recent Price: 4.61 Smart Investing & Trading Score: 70 | |
| Day Percent Change: -1.28% Day Change: -0.06 | |
| Week Change: 4.54% Year-to-date Change: 64.6% | |
| PAYS Links: Profile News Message Board | |
| Charts:- Daily , Weekly | |
| Add PAYS to Watchlist: View: Get Complete PAYS Trend Analysis ➞ | |
 | DAWN Day One Biopharmaceuticals, Inc. |
| Sector: Health Care | |
| SubSector: Biotechnology | |
| MarketCap: 1040 Millions | |
| Recent Price: 17.43 Smart Investing & Trading Score: 93 | |
| Day Percent Change: -1.30% Day Change: -0.23 | |
| Week Change: 16.9% Year-to-date Change: 18.7% | |
| DAWN Links: Profile News Message Board | |
| Charts:- Daily , Weekly | |
| Add DAWN to Watchlist: View: Get Complete DAWN Trend Analysis ➞ | |
 | CUE Cue Biopharma, Inc. |
| Sector: Health Care | |
| SubSector: Biotechnology | |
| MarketCap: 352.785 Millions | |
| Recent Price: 1.88 Smart Investing & Trading Score: 69 | |
| Day Percent Change: -1.31% Day Change: -0.03 | |
| Week Change: 37.73% Year-to-date Change: -28.8% | |
| CUE Links: Profile News Message Board | |
| Charts:- Daily , Weekly | |
| Add CUE to Watchlist: View: Get Complete CUE Trend Analysis ➞ | |
 | VRCA Verrica Pharmaceuticals Inc. |
| Sector: Health Care | |
| SubSector: Biotechnology | |
| MarketCap: 289.585 Millions | |
| Recent Price: 6.76 Smart Investing & Trading Score: 38 | |
| Day Percent Change: -1.31% Day Change: -0.09 | |
| Week Change: -1.6% Year-to-date Change: -7.7% | |
| VRCA Links: Profile News Message Board | |
| Charts:- Daily , Weekly | |
| Add VRCA to Watchlist: View: Get Complete VRCA Trend Analysis ➞ | |
 | ZETA Zeta Global Holdings Corp. |
| Sector: Technology | |
| SubSector: Software - Application | |
| MarketCap: 1780 Millions | |
| Recent Price: 12.44 Smart Investing & Trading Score: 65 | |
| Day Percent Change: -1.31% Day Change: -0.16 | |
| Week Change: -3.53% Year-to-date Change: 40.9% | |
| ZETA Links: Profile News Message Board | |
| Charts:- Daily , Weekly | |
| Add ZETA to Watchlist: View: Get Complete ZETA Trend Analysis ➞ | |
 | SAGE Sage Therapeutics, Inc. |
| Sector: Health Care | |
| SubSector: Biotechnology | |
| MarketCap: 1683.75 Millions | |
| Recent Price: 13.11 Smart Investing & Trading Score: 10 | |
| Day Percent Change: -1.32% Day Change: -0.17 | |
| Week Change: -4.27% Year-to-date Change: -39.5% | |
| SAGE Links: Profile News Message Board | |
| Charts:- Daily , Weekly | |
| Add SAGE to Watchlist: View: Get Complete SAGE Trend Analysis ➞ | |
 | PLMR Palomar Holdings, Inc. |
| Sector: Financials | |
| SubSector: Property & Casualty Insurance | |
| MarketCap: 1297.42 Millions | |
| Recent Price: 77.97 Smart Investing & Trading Score: 46 | |
| Day Percent Change: -1.35% Day Change: -1.07 | |
| Week Change: -1.92% Year-to-date Change: 40.5% | |
| PLMR Links: Profile News Message Board | |
| Charts:- Daily , Weekly | |
| Add PLMR to Watchlist: View: Get Complete PLMR Trend Analysis ➞ | |
 | ATI Allegheny Technologies Incorporated |
| Sector: Industrials | |
| SubSector: Metal Fabrication | |
| MarketCap: 913.35 Millions | |
| Recent Price: 58.05 Smart Investing & Trading Score: 93 | |
| Day Percent Change: -1.36% Day Change: -0.80 | |
| Week Change: 12.17% Year-to-date Change: 27.7% | |
| ATI Links: Profile News Message Board | |
| Charts:- Daily , Weekly | |
| Add ATI to Watchlist: View: Get Complete ATI Trend Analysis ➞ | |
 | TCI Transcontinental Realty Investors, Inc. |
| Sector: Financials | |
| SubSector: REIT - Diversified | |
| MarketCap: 158.653 Millions | |
| Recent Price: 28.23 Smart Investing & Trading Score: 17 | |
| Day Percent Change: -1.36% Day Change: -0.39 | |
| Week Change: -2.52% Year-to-date Change: -18.3% | |
| TCI Links: Profile News Message Board | |
| Charts:- Daily , Weekly | |
| Add TCI to Watchlist: View: Get Complete TCI Trend Analysis ➞ | |
 | MRNS Marinus Pharmaceuticals, Inc. |
| Sector: Health Care | |
| SubSector: Biotechnology | |
| MarketCap: 222.885 Millions | |
| Recent Price: 1.45 Smart Investing & Trading Score: 32 | |
| Day Percent Change: -1.36% Day Change: -0.02 | |
| Week Change: 3.2% Year-to-date Change: -86.7% | |
| MRNS Links: Profile News Message Board | |
| Charts:- Daily , Weekly | |
| Add MRNS to Watchlist: View: Get Complete MRNS Trend Analysis ➞ | |
| Too many stocks? View smallcap stocks filtered by marketcap & sector |
| Marketcap: All SmallCap Stocks (default-no microcap), Large, Mid-Range, Small & MicroCap |
| Sector: Tech, Finance, Energy, Staples, Retail, Industrial, Materials, Utilities & Medical |
|
Best Stocks Today 12Stocks.com |
© 2024 12Stocks.com Terms & Conditions Privacy Contact Us
All Information Provided Only For Education And Not To Be Used For Investing or Trading. See Terms & Conditions


One More Thing ... Get Best Stocks Delivered Daily!
Never Ever Miss A Move With Our Top Ten Stocks Lists
Find Best Stocks In Any Market - Bull or Bear Market
Take A Peek At Our Top Ten Stocks Lists: Daily, Weekly, Year-to-Date & Top Trends
Find Best Stocks In Any Market - Bull or Bear Market
Take A Peek At Our Top Ten Stocks Lists: Daily, Weekly, Year-to-Date & Top Trends
Smallcap Stocks With Best Up Trends [0-bearish to 100-bullish]: Emergent BioSolutions[100], Aspen Aerogels[100], Carvana Co[100], Perdoceo Education[100], Gannett Co[100], Pitney Bowes[100], Benchmark Electronics[100], Origin Materials[100], FormFactor [100], Lantheus [100], Q2 [100]
Best Smallcap Stocks Year-to-Date:
Janux [440.16%], Viking [307.09%], Longboard [273.98%], Alpine Immune[239.29%], Bakkt [187.89%], Avidity Biosciences[182.96%], Vera [170.74%], Cullinan Oncology[169.74%], Super Micro[168.25%], Arcutis Bio[166.25%], Y-mAbs [152.93%] Best Smallcap Stocks This Week:
Deciphera [73.24%], Emergent BioSolutions[71.88%], Eyenovia [49.22%], Aspen Aerogels[48.14%], P3 Health[38.51%], Carvana Co[38.18%], Cue Biopharma[37.73%], Origin Materials[36.24%], TransMedics Group[35.14%], Seres [34.55%], Enovix [32.07%] Best Smallcap Stocks Daily:
Emergent BioSolutions[70.98%], Aspen Aerogels[56.70%], Carvana Co[33.77%], Perdoceo Education[31.46%], Enovix [31.06%], Office Properties[28.00%], Gannett Co[26.97%], Sunnova Energy[25.21%], Pitney Bowes[24.70%], Pulmonx [21.50%], CommScope Holding[20.95%]