
 Login Sign Up


| |||||
 |  | ||||

| 12Stocks.com Market Intelligence |
Best SmallCap Stocks
|
| In a hurry? Small Cap Stock Lists: Performance Trends Table, Stock Charts
Sort Small Cap stocks: Daily, Weekly, Year-to-Date, Market Cap & Trends. Filter Small Cap stocks list by sector: Show all, Tech, Finance, Energy, Staples, Retail, Industrial, Materials, Utilities and HealthCare Filter Small Cap stocks list by size: All Large Medium Small and MicroCap |
| 12Stocks.com Small Cap Stocks Performances & Trends Daily | |||||||||
|
|  The overall Smart Investing & Trading Score is 49 (0-bearish to 100-bullish) which puts Small Cap index in short term neutral trend. The Smart Investing & Trading Score from previous trading session is 14 and hence an improvement of trend.
| ||||||||
Here are the Smart Investing & Trading Scores of the most requested small cap stocks at 12Stocks.com (click stock name for detailed review):
|


| 12Stocks.com: Investing in Smallcap Index with Stocks | |
|
The following table helps investors and traders sort through current performance and trends (as measured by Smart Investing & Trading Score) of various
stocks in the Smallcap Index. Quick View: Move mouse or cursor over stock symbol (ticker) to view short-term technical chart and over stock name to view long term chart. Click on  to add stock symbol to your watchlist and to add stock symbol to your watchlist and  to view watchlist. Click on any ticker or stock name for detailed market intelligence report for that stock. to view watchlist. Click on any ticker or stock name for detailed market intelligence report for that stock. |
12Stocks.com Performance of Stocks in Smallcap Index
| Ticker | Stock Name | Watchlist | Category | Recent Price | Smart Investing & Trading Score | Change % | YTD Change% |
| HEAR | Turtle Beach |   | Technology | 14.99 | 70 | 4.83 | 36.89% |
| ARRY | Array | | Technology | 13.06 | 90 | 4.82 | -22.26% |
| KOD | Kodiak Sciences | | Health Care | 3.70 | 44 | 4.82 | 21.71% |
| SPWR | SunPower | | Technology | 2.18 | 45 | 4.81 | -54.87% |
| QNST | QuinStreet | | Technology | 18.74 | 100 | 4.75 | 46.18% |
| EOLS | Evolus | | Health Care | 13.22 | 69 | 4.75 | 25.55% |
| AMRC | Ameresco | | Services & Goods | 21.45 | 85 | 4.69 | -32.27% |
| HRMY | Harmony Biosciences | | Health Care | 31.69 | 74 | 4.69 | -1.86% |
| PLRX | Pliant | | Health Care | 13.25 | 59 | 4.66 | -26.88% |
| TNK | Teekay Tankers | | Transports | 60.28 | 90 | 4.63 | 20.63% |
| LXFR | Luxfer | | Industrials | 11.07 | 100 | 4.63 | 23.83% |
| CMP | Compass Minerals | | Materials | 12.71 | 30 | 4.61 | -49.80% |
| SWI | SolarWinds | | Technology | 11.58 | 64 | 4.61 | -7.29% |
| YMAB | Y-mAbs | | Health Care | 17.25 | 95 | 4.61 | 152.93% |
| CDE | Coeur Mining | | Materials | 4.79 | 68 | 4.59 | 46.93% |
| PLAB | Photronics | | Technology | 28.14 | 49 | 4.57 | -10.30% |
| BEAM | Beam | | Health Care | 22.72 | 32 | 4.51 | -16.53% |
| BLBD | Blue Bird | | Consumer Staples | 34.30 | 51 | 4.48 | 27.23% |
| LINC | Loln Educational | | Services & Goods | 11.23 | 95 | 4.47 | 11.85% |
| AMCX | AMC s | | Services & Goods | 11.54 | 62 | 4.43 | -38.58% |
| WOW | WideOpenWest | | Technology | 3.79 | 74 | 4.41 | -6.42% |
| IRMD | IRadimed | | Health Care | 43.85 | 100 | 4.40 | -7.63% |
| AMKR | Amkor | | Technology | 31.66 | 61 | 4.39 | -4.84% |
| BOOM | DMC Global | | Industrials | 16.39 | 17 | 4.39 | -12.91% |
| TSQ | Townsquare Media | | Services & Goods | 12.47 | 95 | 4.35 | 18.09% |


| Too many stocks? View smallcap stocks filtered by marketcap & sector |
| Marketcap: All SmallCap Stocks (default-no microcap), Large, Mid-Range, Small |
| Smallcap Sector: Tech, Finance, Energy, Staples, Retail, Industrial, Materials, & Medical |
|
Get the most comprehensive stock market coverage daily at 12Stocks.com ➞ Best Stocks Today ➞ Best Stocks Weekly ➞ Best Stocks Year-to-Date ➞ Best Stocks Trends ➞  Best Stocks Today 12Stocks.com Best Nasdaq Stocks ➞ Best S&P 500 Stocks ➞ Best Tech Stocks ➞ Best Biotech Stocks ➞ |
| Detailed Overview of SmallCap Stocks |
| SmallCap Technical Overview, Leaders & Laggards, Top SmallCap ETF Funds & Detailed SmallCap Stocks List, Charts, Trends & More |
| Smallcap: Technical Analysis, Trends & YTD Performance | |
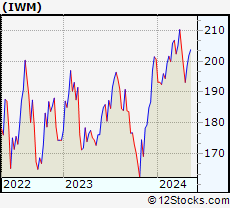
| SmallCap segment as represented by
IWM, an exchange-traded fund [ETF], holds basket of thousands of smallcap stocks from across all major sectors of the US stock market. The smallcap index (contains stocks like Riverbed & Sotheby's) is down by -0.39% and is currently underperforming the overall market by -6.01% year-to-date. Below is a quick view of technical charts and trends: | |
 IWM Weekly Chart |
|
| Long Term Trend: Not Good | |
| Medium Term Trend: Good | |
 IWM Daily Chart |
|
| Short Term Trend: Deteriorating | |
| Overall Trend Score: 49 | |
| YTD Performance: -0.39% | |
| **Trend Scores & Views Are Only For Educational Purposes And Not For Investing | |
| 12Stocks.com: Top Performing Small Cap Index Stocks | ||||||||||||||||||||||||||||||||||||||||||||||||
 The top performing Small Cap Index stocks year to date are
Now, more recently, over last week, the top performing Small Cap Index stocks on the move are


|
||||||||||||||||||||||||||||||||||||||||||||||||
| 12Stocks.com: Investing in Smallcap Index using Exchange Traded Funds | |
|
The following table shows list of key exchange traded funds (ETF) that
help investors track Smallcap index. The following list also includes leveraged ETF funds that track twice or thrice the daily returns of Smallcap indices. Short or inverse ETF funds move in the opposite direction to the index they track and are useful during market pullbacks or during bear markets. Quick View: Move mouse or cursor over ETF symbol (ticker) to view short-term technical chart and over ETF name to view long term chart. Click on ticker or stock name for detailed view. Click on to add stock symbol to your watchlist and to view watchlist. |
12Stocks.com List of ETFs that track Smallcap Index
| Ticker | ETF Name | Watchlist | Recent Price | Smart Investing & Trading Score | Change % | Week % | Year-to-date % |
| IWM | iShares Russell 2000 | | 199.92 | 49 | 1.84 | 0.77 | -0.39% |
| IJR | iShares Core S&P Small-Cap | | 106.33 | 50 | 1.52 | 0.64 | -1.77% |
| VTWO | Vanguard Russell 2000 ETF | | 80.85 | 42 | 1.88 | 0.79 | -0.31% |
| IWN | iShares Russell 2000 Value | | 152.88 | 75 | 2.04 | 1.15 | -1.58% |
| IWO | iShares Russell 2000 Growth | | 254.34 | 32 | 1.91 | 0.49 | 0.84% |
| IJS | iShares S&P Small-Cap 600 Value | | 98.02 | 43 | 1.68 | 0.85 | -4.9% |
| IJT | iShares S&P Small-Cap 600 Growth | | 126.72 | 63 | 1.42 | 0.5 | 1.26% |
| XSLV | PowerShares S&P SmallCap Low Volatil ETF | | 43.14 | 73 | 0.72 | 0.98 | -2.29% |
| SDD | ProShares UltraShort SmallCap600 | | 19.31 | 56 | -2.02 | -0.21 | 4.79% |
| SMLV | SPDR SSGA US Small Cap Low Volatil ETF | | 108.83 | 87 | 1.30 | 1.22 | -3.27% |
| SAA | ProShares Ultra SmallCap600 | | 22.93 | 42 | 1.56 | -0.46 | -8.08% |
| SBB | ProShares Short SmallCap600 | | 16.37 | 49 | -1.14 | -0.09 | 2.76% |
| 12Stocks.com: Charts, Trends, Fundamental Data and Performances of SmallCap Stocks | |
|
We now take in-depth look at all SmallCap stocks including charts, multi-period performances and overall trends (as measured by Smart Investing & Trading Score). One can sort SmallCap stocks (click link to choose) by Daily, Weekly and by Year-to-Date performances. Also, one can sort by size of the company or by market capitalization. |
| Select Your Default Chart Type: | |||||
| |||||
| Click on stock symbol or name for detailed view. Click on to add stock symbol to your watchlist and to view watchlist. Quick View: Move mouse or cursor over "Daily" to quickly view daily technical stock chart and over "Weekly" to view weekly technical stock chart. | |||||

 | HEAR Turtle Beach Corporation |
| Sector: Technology | |
| SubSector: Communication Equipment | |
| MarketCap: 73.0539 Millions | |
| Recent Price: 14.99 Smart Investing & Trading Score: 70 | |
| Day Percent Change: 4.83% Day Change: 0.69 | |
| Week Change: 6.01% Year-to-date Change: 36.9% | |
| HEAR Links: Profile News Message Board | |
| Charts:- Daily , Weekly | |
| Add HEAR to Watchlist: View: Get Complete HEAR Trend Analysis ➞ | |
 | ARRY Array Technologies, Inc. |
| Sector: Technology | |
| SubSector: Solar | |
| MarketCap: 45887 Millions | |
| Recent Price: 13.06 Smart Investing & Trading Score: 90 | |
| Day Percent Change: 4.82% Day Change: 0.60 | |
| Week Change: 5.32% Year-to-date Change: -22.3% | |
| ARRY Links: Profile News Message Board | |
| Charts:- Daily , Weekly | |
| Add ARRY to Watchlist: View: Get Complete ARRY Trend Analysis ➞ | |
 | KOD Kodiak Sciences Inc. |
| Sector: Health Care | |
| SubSector: Biotechnology | |
| MarketCap: 2132.15 Millions | |
| Recent Price: 3.70 Smart Investing & Trading Score: 44 | |
| Day Percent Change: 4.82% Day Change: 0.17 | |
| Week Change: 12.8% Year-to-date Change: 21.7% | |
| KOD Links: Profile News Message Board | |
| Charts:- Daily , Weekly | |
| Add KOD to Watchlist: View: Get Complete KOD Trend Analysis ➞ | |
 | SPWR SunPower Corporation |
| Sector: Technology | |
| SubSector: Semiconductor - Specialized | |
| MarketCap: 1202.6 Millions | |
| Recent Price: 2.18 Smart Investing & Trading Score: 45 | |
| Day Percent Change: 4.81% Day Change: 0.10 | |
| Week Change: 9.55% Year-to-date Change: -54.9% | |
| SPWR Links: Profile News Message Board | |
| Charts:- Daily , Weekly | |
| Add SPWR to Watchlist: View: Get Complete SPWR Trend Analysis ➞ | |
 | QNST QuinStreet, Inc. |
| Sector: Technology | |
| SubSector: Internet Software & Services | |
| MarketCap: 411.791 Millions | |
| Recent Price: 18.74 Smart Investing & Trading Score: 100 | |
| Day Percent Change: 4.75% Day Change: 0.85 | |
| Week Change: 8.26% Year-to-date Change: 46.2% | |
| QNST Links: Profile News Message Board | |
| Charts:- Daily , Weekly | |
| Add QNST to Watchlist: View: Get Complete QNST Trend Analysis ➞ | |
 | EOLS Evolus, Inc. |
| Sector: Health Care | |
| SubSector: Drugs - Generic | |
| MarketCap: 145.885 Millions | |
| Recent Price: 13.22 Smart Investing & Trading Score: 69 | |
| Day Percent Change: 4.75% Day Change: 0.60 | |
| Week Change: 15.66% Year-to-date Change: 25.6% | |
| EOLS Links: Profile News Message Board | |
| Charts:- Daily , Weekly | |
| Add EOLS to Watchlist: View: Get Complete EOLS Trend Analysis ➞ | |
 | AMRC Ameresco, Inc. |
| Sector: Services & Goods | |
| SubSector: Technical Services | |
| MarketCap: 898.91 Millions | |
| Recent Price: 21.45 Smart Investing & Trading Score: 85 | |
| Day Percent Change: 4.69% Day Change: 0.96 | |
| Week Change: -0.14% Year-to-date Change: -32.3% | |
| AMRC Links: Profile News Message Board | |
| Charts:- Daily , Weekly | |
| Add AMRC to Watchlist: View: Get Complete AMRC Trend Analysis ➞ | |
 | HRMY Harmony Biosciences Holdings, Inc. |
| Sector: Health Care | |
| SubSector: Biotechnology | |
| MarketCap: 24487 Millions | |
| Recent Price: 31.69 Smart Investing & Trading Score: 74 | |
| Day Percent Change: 4.69% Day Change: 1.42 | |
| Week Change: 8.08% Year-to-date Change: -1.9% | |
| HRMY Links: Profile News Message Board | |
| Charts:- Daily , Weekly | |
| Add HRMY to Watchlist: View: Get Complete HRMY Trend Analysis ➞ | |
 | PLRX Pliant Therapeutics, Inc. |
| Sector: Health Care | |
| SubSector: Biotechnology | |
| MarketCap: 96487 Millions | |
| Recent Price: 13.25 Smart Investing & Trading Score: 59 | |
| Day Percent Change: 4.66% Day Change: 0.59 | |
| Week Change: 12.19% Year-to-date Change: -26.9% | |
| PLRX Links: Profile News Message Board | |
| Charts:- Daily , Weekly | |
| Add PLRX to Watchlist: View: Get Complete PLRX Trend Analysis ➞ | |
 | TNK Teekay Tankers Ltd. |
| Sector: Transports | |
| SubSector: Shipping | |
| MarketCap: 584.714 Millions | |
| Recent Price: 60.28 Smart Investing & Trading Score: 90 | |
| Day Percent Change: 4.63% Day Change: 2.67 | |
| Week Change: 2.76% Year-to-date Change: 20.6% | |
| TNK Links: Profile News Message Board | |
| Charts:- Daily , Weekly | |
| Add TNK to Watchlist: View: Get Complete TNK Trend Analysis ➞ | |
 | LXFR Luxfer Holdings PLC |
| Sector: Industrials | |
| SubSector: Diversified Machinery | |
| MarketCap: 406.716 Millions | |
| Recent Price: 11.07 Smart Investing & Trading Score: 100 | |
| Day Percent Change: 4.63% Day Change: 0.49 | |
| Week Change: 13.77% Year-to-date Change: 23.8% | |
| LXFR Links: Profile News Message Board | |
| Charts:- Daily , Weekly | |
| Add LXFR to Watchlist: View: Get Complete LXFR Trend Analysis ➞ | |
 | CMP Compass Minerals International, Inc. |
| Sector: Materials | |
| SubSector: Industrial Metals & Minerals | |
| MarketCap: 1512.1 Millions | |
| Recent Price: 12.71 Smart Investing & Trading Score: 30 | |
| Day Percent Change: 4.61% Day Change: 0.56 | |
| Week Change: -2.53% Year-to-date Change: -49.8% | |
| CMP Links: Profile News Message Board | |
| Charts:- Daily , Weekly | |
| Add CMP to Watchlist: View: Get Complete CMP Trend Analysis ➞ | |
 | SWI SolarWinds Corporation |
| Sector: Technology | |
| SubSector: Application Software | |
| MarketCap: 4524.62 Millions | |
| Recent Price: 11.58 Smart Investing & Trading Score: 64 | |
| Day Percent Change: 4.61% Day Change: 0.51 | |
| Week Change: 4.14% Year-to-date Change: -7.3% | |
| SWI Links: Profile News Message Board | |
| Charts:- Daily , Weekly | |
| Add SWI to Watchlist: View: Get Complete SWI Trend Analysis ➞ | |
 | YMAB Y-mAbs Therapeutics, Inc. |
| Sector: Health Care | |
| SubSector: Biotechnology | |
| MarketCap: 899.585 Millions | |
| Recent Price: 17.25 Smart Investing & Trading Score: 95 | |
| Day Percent Change: 4.61% Day Change: 0.76 | |
| Week Change: 17.27% Year-to-date Change: 152.9% | |
| YMAB Links: Profile News Message Board | |
| Charts:- Daily , Weekly | |
| Add YMAB to Watchlist: View: Get Complete YMAB Trend Analysis ➞ | |
 | CDE Coeur Mining, Inc. |
| Sector: Materials | |
| SubSector: Gold | |
| MarketCap: 853.219 Millions | |
| Recent Price: 4.79 Smart Investing & Trading Score: 68 | |
| Day Percent Change: 4.59% Day Change: 0.21 | |
| Week Change: -3.04% Year-to-date Change: 46.9% | |
| CDE Links: Profile News Message Board | |
| Charts:- Daily , Weekly | |
| Add CDE to Watchlist: View: Get Complete CDE Trend Analysis ➞ | |
 | PLAB Photronics, Inc. |
| Sector: Technology | |
| SubSector: Semiconductor Equipment & Materials | |
| MarketCap: 709.018 Millions | |
| Recent Price: 28.14 Smart Investing & Trading Score: 49 | |
| Day Percent Change: 4.57% Day Change: 1.23 | |
| Week Change: -0.5% Year-to-date Change: -10.3% | |
| PLAB Links: Profile News Message Board | |
| Charts:- Daily , Weekly | |
| Add PLAB to Watchlist: View: Get Complete PLAB Trend Analysis ➞ | |
 | BEAM Beam Therapeutics Inc. |
| Sector: Health Care | |
| SubSector: Biotechnology | |
| MarketCap: 44987 Millions | |
| Recent Price: 22.72 Smart Investing & Trading Score: 32 | |
| Day Percent Change: 4.51% Day Change: 0.98 | |
| Week Change: 6.27% Year-to-date Change: -16.5% | |
| BEAM Links: Profile News Message Board | |
| Charts:- Daily , Weekly | |
| Add BEAM to Watchlist: View: Get Complete BEAM Trend Analysis ➞ | |
 | BLBD Blue Bird Corporation |
| Sector: Consumer Staples | |
| SubSector: Auto Manufacturers - Major | |
| MarketCap: 345.371 Millions | |
| Recent Price: 34.30 Smart Investing & Trading Score: 51 | |
| Day Percent Change: 4.48% Day Change: 1.47 | |
| Week Change: 0.97% Year-to-date Change: 27.2% | |
| BLBD Links: Profile News Message Board | |
| Charts:- Daily , Weekly | |
| Add BLBD to Watchlist: View: Get Complete BLBD Trend Analysis ➞ | |
 | LINC Lincoln Educational Services Corporation |
| Sector: Services & Goods | |
| SubSector: Education & Training Services | |
| MarketCap: 59.5006 Millions | |
| Recent Price: 11.23 Smart Investing & Trading Score: 95 | |
| Day Percent Change: 4.47% Day Change: 0.48 | |
| Week Change: 11.08% Year-to-date Change: 11.9% | |
| LINC Links: Profile News Message Board | |
| Charts:- Daily , Weekly | |
| Add LINC to Watchlist: View: Get Complete LINC Trend Analysis ➞ | |
 | AMCX AMC Networks Inc. |
| Sector: Services & Goods | |
| SubSector: Entertainment - Diversified | |
| MarketCap: 1477.37 Millions | |
| Recent Price: 11.54 Smart Investing & Trading Score: 62 | |
| Day Percent Change: 4.43% Day Change: 0.49 | |
| Week Change: 6.56% Year-to-date Change: -38.6% | |
| AMCX Links: Profile News Message Board | |
| Charts:- Daily , Weekly | |
| Add AMCX to Watchlist: View: Get Complete AMCX Trend Analysis ➞ | |
 | WOW WideOpenWest, Inc. |
| Sector: Technology | |
| SubSector: CATV Systems | |
| MarketCap: 328.932 Millions | |
| Recent Price: 3.79 Smart Investing & Trading Score: 74 | |
| Day Percent Change: 4.41% Day Change: 0.16 | |
| Week Change: 9.22% Year-to-date Change: -6.4% | |
| WOW Links: Profile News Message Board | |
| Charts:- Daily , Weekly | |
| Add WOW to Watchlist: View: Get Complete WOW Trend Analysis ➞ | |
 | IRMD IRadimed Corporation |
| Sector: Health Care | |
| SubSector: Medical Appliances & Equipment | |
| MarketCap: 207.78 Millions | |
| Recent Price: 43.85 Smart Investing & Trading Score: 100 | |
| Day Percent Change: 4.40% Day Change: 1.85 | |
| Week Change: 4.75% Year-to-date Change: -7.6% | |
| IRMD Links: Profile News Message Board | |
| Charts:- Daily , Weekly | |
| Add IRMD to Watchlist: View: Get Complete IRMD Trend Analysis ➞ | |
 | AMKR Amkor Technology, Inc. |
| Sector: Technology | |
| SubSector: Semiconductor - Integrated Circuits | |
| MarketCap: 1966.2 Millions | |
| Recent Price: 31.66 Smart Investing & Trading Score: 61 | |
| Day Percent Change: 4.39% Day Change: 1.33 | |
| Week Change: 3.4% Year-to-date Change: -4.8% | |
| AMKR Links: Profile News Message Board | |
| Charts:- Daily , Weekly | |
| Add AMKR to Watchlist: View: Get Complete AMKR Trend Analysis ➞ | |
 | BOOM DMC Global Inc. |
| Sector: Industrials | |
| SubSector: Metal Fabrication | |
| MarketCap: 359.15 Millions | |
| Recent Price: 16.39 Smart Investing & Trading Score: 17 | |
| Day Percent Change: 4.39% Day Change: 0.69 | |
| Week Change: -0.61% Year-to-date Change: -12.9% | |
| BOOM Links: Profile News Message Board | |
| Charts:- Daily , Weekly | |
| Add BOOM to Watchlist: View: Get Complete BOOM Trend Analysis ➞ | |
 | TSQ Townsquare Media, Inc. |
| Sector: Services & Goods | |
| SubSector: Broadcasting - Radio | |
| MarketCap: 101.795 Millions | |
| Recent Price: 12.47 Smart Investing & Trading Score: 95 | |
| Day Percent Change: 4.35% Day Change: 0.52 | |
| Week Change: 1.88% Year-to-date Change: 18.1% | |
| TSQ Links: Profile News Message Board | |
| Charts:- Daily , Weekly | |
| Add TSQ to Watchlist: View: Get Complete TSQ Trend Analysis ➞ | |
| Too many stocks? View smallcap stocks filtered by marketcap & sector |
| Marketcap: All SmallCap Stocks (default-no microcap), Large, Mid-Range, Small & MicroCap |
| Sector: Tech, Finance, Energy, Staples, Retail, Industrial, Materials, Utilities & Medical |
|
Best Stocks Today 12Stocks.com |
© 2024 12Stocks.com Terms & Conditions Privacy Contact Us
All Information Provided Only For Education And Not To Be Used For Investing or Trading. See Terms & Conditions


One More Thing ... Get Best Stocks Delivered Daily!
Never Ever Miss A Move With Our Top Ten Stocks Lists
Find Best Stocks In Any Market - Bull or Bear Market
Take A Peek At Our Top Ten Stocks Lists: Daily, Weekly, Year-to-Date & Top Trends
Find Best Stocks In Any Market - Bull or Bear Market
Take A Peek At Our Top Ten Stocks Lists: Daily, Weekly, Year-to-Date & Top Trends
Smallcap Stocks With Best Up Trends [0-bearish to 100-bullish]: Emergent BioSolutions[100], Aspen Aerogels[100], Carvana Co[100], Perdoceo Education[100], Gannett Co[100], Pitney Bowes[100], Benchmark Electronics[100], Origin Materials[100], FormFactor [100], Lantheus [100], Q2 [100]
Best Smallcap Stocks Year-to-Date:
Janux [440.16%], Viking [307.09%], Longboard [273.98%], Alpine Immune[239.29%], Bakkt [187.89%], Avidity Biosciences[182.96%], Vera [170.74%], Cullinan Oncology[169.74%], Super Micro[168.25%], Arcutis Bio[166.25%], Y-mAbs [152.93%] Best Smallcap Stocks This Week:
Deciphera [73.24%], Emergent BioSolutions[71.88%], Eyenovia [49.22%], Aspen Aerogels[48.14%], P3 Health[38.51%], Carvana Co[38.18%], Cue Biopharma[37.73%], Origin Materials[36.24%], TransMedics Group[35.14%], Seres [34.55%], Enovix [32.07%] Best Smallcap Stocks Daily:
Emergent BioSolutions[70.98%], Aspen Aerogels[56.70%], Carvana Co[33.77%], Perdoceo Education[31.46%], Enovix [31.06%], Office Properties[28.00%], Gannett Co[26.97%], Sunnova Energy[25.21%], Pitney Bowes[24.70%], Pulmonx [21.50%], CommScope Holding[20.95%]