
 Login Sign Up


| |||||
 |  | ||||

| 12Stocks.com Market Intelligence |
Best SmallCap Stocks
|
| In a hurry? Small Cap Stock Lists: Performance Trends Table, Stock Charts
Sort Small Cap stocks: Daily, Weekly, Year-to-Date, Market Cap & Trends. Filter Small Cap stocks list by sector: Show all, Tech, Finance, Energy, Staples, Retail, Industrial, Materials, Utilities and HealthCare Filter Small Cap stocks list by size: All Large Medium Small and MicroCap |
| 12Stocks.com Small Cap Stocks Performances & Trends Daily | |||||||||
|
|  The overall Smart Investing & Trading Score is 49 (0-bearish to 100-bullish) which puts Small Cap index in short term neutral trend. The Smart Investing & Trading Score from previous trading session is 14 and hence an improvement of trend.
| ||||||||
Here are the Smart Investing & Trading Scores of the most requested small cap stocks at 12Stocks.com (click stock name for detailed review):
|


| 12Stocks.com: Investing in Smallcap Index with Stocks | |
|
The following table helps investors and traders sort through current performance and trends (as measured by Smart Investing & Trading Score) of various
stocks in the Smallcap Index. Quick View: Move mouse or cursor over stock symbol (ticker) to view short-term technical chart and over stock name to view long term chart. Click on  to add stock symbol to your watchlist and to add stock symbol to your watchlist and  to view watchlist. Click on any ticker or stock name for detailed market intelligence report for that stock. to view watchlist. Click on any ticker or stock name for detailed market intelligence report for that stock. |
12Stocks.com Performance of Stocks in Smallcap Index
| Ticker | Stock Name | Watchlist | Category | Recent Price | Smart Investing & Trading Score | Change % | YTD Change% |
| HIBB | Hibbett Sports |   | Services & Goods | 86.39 | 83 | -0.11 | 19.96% |
| ZYME | Zymeworks | | Health Care | 8.99 | 49 | -0.11 | -13.47% |
| SXT | Sensient | | Materials | 74.41 | 100 | -0.12 | 12.74% |
| VEL | Velocity Financial | | Financials | 17.32 | 76 | -0.12 | 4.21% |
| HSHP | Himalaya Shipping | | Industrials | 8.46 | 100 | -0.12 | 25.33% |
| FWRG | First Watch | | Services & Goods | 25.29 | 90 | -0.12 | 26.89% |
| TK | Teekay | | Transports | 7.71 | 90 | -0.13 | 7.83% |
| IMKTA | Ingles Markets | | Services & Goods | 72.60 | 45 | -0.14 | -15.94% |
| LZ | LegalZoom.com | | Industrials | 12.14 | 24 | -0.16 | 6.91% |
| GNK | Genco Shipping | | Transports | 22.14 | 100 | -0.16 | 33.42% |
| MGEE | MGE Energy | | Utilities | 80.16 | 100 | -0.17 | 10.85% |
| HAYN | Haynes | | Industrials | 59.57 | 13 | -0.17 | 4.42% |
| FMBH | First Mid | | Financials | 32.23 | 100 | -0.17 | -7.00% |
| CNO | CNO Financial | | Financials | 27.12 | 90 | -0.18 | -2.80% |
| KWR | Quaker Chemical | | Materials | 192.34 | 57 | -0.19 | -9.88% |
| SFM | Sprouts Farmers | | Services & Goods | 71.86 | 100 | -0.19 | 49.37% |
| OBIO | Orchestra BioMed | | Health Care | 5.29 | 74 | -0.19 | -41.93% |
| USNA | USANA Health | | Health Care | 47.01 | 74 | -0.20 | -12.30% |
| BCPC | Balchem | | Materials | 145.99 | 49 | -0.20 | -1.86% |
| NHC | National HealthCare | | Health Care | 93.20 | 64 | -0.22 | 0.84% |
| KGS | Kodiak Gas | | Energy | 27.04 | 54 | -0.22 | 35.34% |
| ATSG | Air Transport | | Transports | 13.16 | 100 | -0.23 | -25.27% |
| HMN | Horace Mann | | Financials | 37.76 | 100 | -0.24 | 15.47% |
| NC | NACCO Industries | | Consumer Staples | 31.61 | 74 | -0.25 | -13.40% |
| SWI | SolarWinds | | Technology | 11.55 | 64 | -0.26 | -7.53% |
| For chart view version of above stock list: Chart View ➞ 0 - 25 , 25 - 50 , 50 - 75 , 75 - 100 , 100 - 125 , 125 - 150 , 150 - 175 , 175 - 200 , 200 - 225 , 225 - 250 , 250 - 275 , 275 - 300 , 300 - 325 , 325 - 350 , 350 - 375 , 375 - 400 , 400 - 425 , 425 - 450 , 450 - 475 , 475 - 500 , 500 - 525 , 525 - 550 , 550 - 575 , 575 - 600 , 600 - 625 , 625 - 650 , 650 - 675 , 675 - 700 , 700 - 725 , 725 - 750 , 750 - 775 , 775 - 800 , 800 - 825 , 825 - 850 , 850 - 875 , 875 - 900 , 900 - 925 , 925 - 950 , 950 - 975 , 975 - 1000 , 1000 - 1025 , 1025 - 1050 , 1050 - 1075 , 1075 - 1100 , 1100 - 1125 , 1125 - 1150 , 1150 - 1175 , 1175 - 1200 , 1200 - 1225 , 1225 - 1250 , 1250 - 1275 , 1275 - 1300 , 1300 - 1325 , 1325 - 1350 , 1350 - 1375 , 1375 - 1400 , 1400 - 1425 , 1425 - 1450 , 1450 - 1475 , 1475 - 1500 , 1500 - 1525 , 1525 - 1550 , 1550 - 1575 , 1575 - 1600 | ||
 | Click To Change The Sort Order: By Market Cap or Company Size Performance: Year-to-date, Week and Day |  |
| Too many stocks? View smallcap stocks filtered by marketcap & sector |
| Marketcap: All SmallCap Stocks (default-no microcap), Large, Mid-Range, Small |
| Smallcap Sector: Tech, Finance, Energy, Staples, Retail, Industrial, Materials, & Medical |
|
Get the most comprehensive stock market coverage daily at 12Stocks.com ➞ Best Stocks Today ➞ Best Stocks Weekly ➞ Best Stocks Year-to-Date ➞ Best Stocks Trends ➞  Best Stocks Today 12Stocks.com Best Nasdaq Stocks ➞ Best S&P 500 Stocks ➞ Best Tech Stocks ➞ Best Biotech Stocks ➞ |
| Detailed Overview of SmallCap Stocks |
| SmallCap Technical Overview, Leaders & Laggards, Top SmallCap ETF Funds & Detailed SmallCap Stocks List, Charts, Trends & More |
| Smallcap: Technical Analysis, Trends & YTD Performance | |
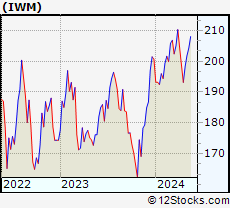
| SmallCap segment as represented by
IWM, an exchange-traded fund [ETF], holds basket of thousands of smallcap stocks from across all major sectors of the US stock market. The smallcap index (contains stocks like Riverbed & Sotheby's) is up by 1.11% and is currently underperforming the overall market by -5.68% year-to-date. Below is a quick view of technical charts and trends: | |
 IWM Weekly Chart |
|
| Long Term Trend: Not Good | |
| Medium Term Trend: Good | |
 IWM Daily Chart |
|
| Short Term Trend: Deteriorating | |
| Overall Trend Score: 49 | |
| YTD Performance: 1.11% | |
| **Trend Scores & Views Are Only For Educational Purposes And Not For Investing | |
| 12Stocks.com: Top Performing Small Cap Index Stocks | ||||||||||||||||||||||||||||||||||||||||||||||||
 The top performing Small Cap Index stocks year to date are
Now, more recently, over last week, the top performing Small Cap Index stocks on the move are


|
||||||||||||||||||||||||||||||||||||||||||||||||
| 12Stocks.com: Investing in Smallcap Index using Exchange Traded Funds | |
|
The following table shows list of key exchange traded funds (ETF) that
help investors track Smallcap index. The following list also includes leveraged ETF funds that track twice or thrice the daily returns of Smallcap indices. Short or inverse ETF funds move in the opposite direction to the index they track and are useful during market pullbacks or during bear markets. Quick View: Move mouse or cursor over ETF symbol (ticker) to view short-term technical chart and over ETF name to view long term chart. Click on ticker or stock name for detailed view. Click on to add stock symbol to your watchlist and to view watchlist. |
12Stocks.com List of ETFs that track Smallcap Index
| Ticker | ETF Name | Watchlist | Recent Price | Smart Investing & Trading Score | Change % | Week % | Year-to-date % |
| IWM | iShares Russell 2000 | | 202.94 | 49 | 1.51 | 2.29 | 1.11% |
| SDD | ProShares UltraShort SmallCap600 | | 18.35 | 56 | -4.97 | -5.17 | -0.42% |
| SBB | ProShares Short SmallCap600 | | 16.33 | 49 | -0.25 | -0.34 | 2.51% |
| SAA | ProShares Ultra SmallCap600 | | 23.93 | 42 | 4.36 | 3.88 | -4.07% |
| 12Stocks.com: Charts, Trends, Fundamental Data and Performances of SmallCap Stocks | |
|
We now take in-depth look at all SmallCap stocks including charts, multi-period performances and overall trends (as measured by Smart Investing & Trading Score). One can sort SmallCap stocks (click link to choose) by Daily, Weekly and by Year-to-Date performances. Also, one can sort by size of the company or by market capitalization. |
| Select Your Default Chart Type: | |||||
| |||||
| Click on stock symbol or name for detailed view. Click on to add stock symbol to your watchlist and to view watchlist. Quick View: Move mouse or cursor over "Daily" to quickly view daily technical stock chart and over "Weekly" to view weekly technical stock chart. | |||||

 | HIBB Hibbett Sports, Inc. |
| Sector: Services & Goods | |
| SubSector: Sporting Goods Stores | |
| MarketCap: 183 Millions | |
| Recent Price: 86.39 Smart Investing & Trading Score: 83 | |
| Day Percent Change: -0.11% Day Change: -0.09 | |
| Week Change: 0.28% Year-to-date Change: 20.0% | |
| HIBB Links: Profile News Message Board | |
| Charts:- Daily , Weekly | |
| Add HIBB to Watchlist: View: Get Complete HIBB Trend Analysis ➞ | |
 | ZYME Zymeworks Inc. |
| Sector: Health Care | |
| SubSector: Biotechnology | |
| MarketCap: 1373.55 Millions | |
| Recent Price: 8.99 Smart Investing & Trading Score: 49 | |
| Day Percent Change: -0.11% Day Change: -0.01 | |
| Week Change: 8.84% Year-to-date Change: -13.5% | |
| ZYME Links: Profile News Message Board | |
| Charts:- Daily , Weekly | |
| Add ZYME to Watchlist: View: Get Complete ZYME Trend Analysis ➞ | |
 | SXT Sensient Technologies Corporation |
| Sector: Materials | |
| SubSector: Specialty Chemicals | |
| MarketCap: 1961.37 Millions | |
| Recent Price: 74.41 Smart Investing & Trading Score: 100 | |
| Day Percent Change: -0.12% Day Change: -0.09 | |
| Week Change: 5.76% Year-to-date Change: 12.7% | |
| SXT Links: Profile News Message Board | |
| Charts:- Daily , Weekly | |
| Add SXT to Watchlist: View: Get Complete SXT Trend Analysis ➞ | |
 | VEL Velocity Financial, Inc. |
| Sector: Financials | |
| SubSector: Mortgage Finance | |
| MarketCap: 12157 Millions | |
| Recent Price: 17.32 Smart Investing & Trading Score: 76 | |
| Day Percent Change: -0.12% Day Change: -0.02 | |
| Week Change: 1.82% Year-to-date Change: 4.2% | |
| VEL Links: Profile News Message Board | |
| Charts:- Daily , Weekly | |
| Add VEL to Watchlist: View: Get Complete VEL Trend Analysis ➞ | |
 | HSHP Himalaya Shipping Ltd. |
| Sector: Industrials | |
| SubSector: Marine Shipping | |
| MarketCap: 179 Millions | |
| Recent Price: 8.46 Smart Investing & Trading Score: 100 | |
| Day Percent Change: -0.12% Day Change: -0.01 | |
| Week Change: 2.05% Year-to-date Change: 25.3% | |
| HSHP Links: Profile News Message Board | |
| Charts:- Daily , Weekly | |
| Add HSHP to Watchlist: View: Get Complete HSHP Trend Analysis ➞ | |
 | FWRG First Watch Restaurant Group, Inc. |
| Sector: Services & Goods | |
| SubSector: Restaurants | |
| MarketCap: 1000 Millions | |
| Recent Price: 25.29 Smart Investing & Trading Score: 90 | |
| Day Percent Change: -0.12% Day Change: -0.03 | |
| Week Change: 6.98% Year-to-date Change: 26.9% | |
| FWRG Links: Profile News Message Board | |
| Charts:- Daily , Weekly | |
| Add FWRG to Watchlist: View: Get Complete FWRG Trend Analysis ➞ | |
 | TK Teekay Corporation |
| Sector: Transports | |
| SubSector: Shipping | |
| MarketCap: 257.914 Millions | |
| Recent Price: 7.71 Smart Investing & Trading Score: 90 | |
| Day Percent Change: -0.13% Day Change: -0.01 | |
| Week Change: 2.8% Year-to-date Change: 7.8% | |
| TK Links: Profile News Message Board | |
| Charts:- Daily , Weekly | |
| Add TK to Watchlist: View: Get Complete TK Trend Analysis ➞ | |
 | IMKTA Ingles Markets, Incorporated |
| Sector: Services & Goods | |
| SubSector: Grocery Stores | |
| MarketCap: 827.075 Millions | |
| Recent Price: 72.60 Smart Investing & Trading Score: 45 | |
| Day Percent Change: -0.14% Day Change: -0.10 | |
| Week Change: -0.15% Year-to-date Change: -15.9% | |
| IMKTA Links: Profile News Message Board | |
| Charts:- Daily , Weekly | |
| Add IMKTA to Watchlist: View: Get Complete IMKTA Trend Analysis ➞ | |
 | LZ LegalZoom.com, Inc. |
| Sector: Industrials | |
| SubSector: Specialty Business Services | |
| MarketCap: 2330 Millions | |
| Recent Price: 12.14 Smart Investing & Trading Score: 24 | |
| Day Percent Change: -0.16% Day Change: -0.02 | |
| Week Change: -2.76% Year-to-date Change: 6.9% | |
| LZ Links: Profile News Message Board | |
| Charts:- Daily , Weekly | |
| Add LZ to Watchlist: View: Get Complete LZ Trend Analysis ➞ | |
 | GNK Genco Shipping & Trading Limited |
| Sector: Transports | |
| SubSector: Shipping | |
| MarketCap: 251.614 Millions | |
| Recent Price: 22.14 Smart Investing & Trading Score: 100 | |
| Day Percent Change: -0.16% Day Change: -0.04 | |
| Week Change: 2.71% Year-to-date Change: 33.4% | |
| GNK Links: Profile News Message Board | |
| Charts:- Daily , Weekly | |
| Add GNK to Watchlist: View: Get Complete GNK Trend Analysis ➞ | |
 | MGEE MGE Energy, Inc. |
| Sector: Utilities | |
| SubSector: Diversified Utilities | |
| MarketCap: 2608.3 Millions | |
| Recent Price: 80.16 Smart Investing & Trading Score: 100 | |
| Day Percent Change: -0.17% Day Change: -0.14 | |
| Week Change: 3.29% Year-to-date Change: 10.9% | |
| MGEE Links: Profile News Message Board | |
| Charts:- Daily , Weekly | |
| Add MGEE to Watchlist: View: Get Complete MGEE Trend Analysis ➞ | |
 | HAYN Haynes International, Inc. |
| Sector: Industrials | |
| SubSector: Metal Fabrication | |
| MarketCap: 245.75 Millions | |
| Recent Price: 59.57 Smart Investing & Trading Score: 13 | |
| Day Percent Change: -0.17% Day Change: -0.10 | |
| Week Change: -1.23% Year-to-date Change: 4.4% | |
| HAYN Links: Profile News Message Board | |
| Charts:- Daily , Weekly | |
| Add HAYN to Watchlist: View: Get Complete HAYN Trend Analysis ➞ | |
 | FMBH First Mid Bancshares, Inc. |
| Sector: Financials | |
| SubSector: Regional - Midwest Banks | |
| MarketCap: 373.27 Millions | |
| Recent Price: 32.23 Smart Investing & Trading Score: 100 | |
| Day Percent Change: -0.17% Day Change: -0.05 | |
| Week Change: 2.3% Year-to-date Change: -7.0% | |
| FMBH Links: Profile News Message Board | |
| Charts:- Daily , Weekly | |
| Add FMBH to Watchlist: View: Get Complete FMBH Trend Analysis ➞ | |
 | CNO CNO Financial Group, Inc. |
| Sector: Financials | |
| SubSector: Accident & Health Insurance | |
| MarketCap: 1746.9 Millions | |
| Recent Price: 27.12 Smart Investing & Trading Score: 90 | |
| Day Percent Change: -0.18% Day Change: -0.05 | |
| Week Change: 2.73% Year-to-date Change: -2.8% | |
| CNO Links: Profile News Message Board | |
| Charts:- Daily , Weekly | |
| Add CNO to Watchlist: View: Get Complete CNO Trend Analysis ➞ | |
 | KWR Quaker Chemical Corporation |
| Sector: Materials | |
| SubSector: Specialty Chemicals | |
| MarketCap: 2411.67 Millions | |
| Recent Price: 192.34 Smart Investing & Trading Score: 57 | |
| Day Percent Change: -0.19% Day Change: -0.36 | |
| Week Change: 1.11% Year-to-date Change: -9.9% | |
| KWR Links: Profile News Message Board | |
| Charts:- Daily , Weekly | |
| Add KWR to Watchlist: View: Get Complete KWR Trend Analysis ➞ | |
 | SFM Sprouts Farmers Market, Inc. |
| Sector: Services & Goods | |
| SubSector: Grocery Stores | |
| MarketCap: 2495.85 Millions | |
| Recent Price: 71.86 Smart Investing & Trading Score: 100 | |
| Day Percent Change: -0.19% Day Change: -0.14 | |
| Week Change: 7.29% Year-to-date Change: 49.4% | |
| SFM Links: Profile News Message Board | |
| Charts:- Daily , Weekly | |
| Add SFM to Watchlist: View: Get Complete SFM Trend Analysis ➞ | |
 | OBIO Orchestra BioMed Holdings, Inc. |
| Sector: Health Care | |
| SubSector: Biotechnology | |
| MarketCap: 271 Millions | |
| Recent Price: 5.29 Smart Investing & Trading Score: 74 | |
| Day Percent Change: -0.19% Day Change: -0.01 | |
| Week Change: 20.5% Year-to-date Change: -41.9% | |
| OBIO Links: Profile News Message Board | |
| Charts:- Daily , Weekly | |
| Add OBIO to Watchlist: View: Get Complete OBIO Trend Analysis ➞ | |
 | USNA USANA Health Sciences, Inc. |
| Sector: Health Care | |
| SubSector: Drug Related Products | |
| MarketCap: 1185.13 Millions | |
| Recent Price: 47.01 Smart Investing & Trading Score: 74 | |
| Day Percent Change: -0.20% Day Change: -0.09 | |
| Week Change: 8.13% Year-to-date Change: -12.3% | |
| USNA Links: Profile News Message Board | |
| Charts:- Daily , Weekly | |
| Add USNA to Watchlist: View: Get Complete USNA Trend Analysis ➞ | |
 | BCPC Balchem Corporation |
| Sector: Materials | |
| SubSector: Specialty Chemicals | |
| MarketCap: 3330.17 Millions | |
| Recent Price: 145.99 Smart Investing & Trading Score: 49 | |
| Day Percent Change: -0.20% Day Change: -0.29 | |
| Week Change: 4.83% Year-to-date Change: -1.9% | |
| BCPC Links: Profile News Message Board | |
| Charts:- Daily , Weekly | |
| Add BCPC to Watchlist: View: Get Complete BCPC Trend Analysis ➞ | |
 | NHC National HealthCare Corporation |
| Sector: Health Care | |
| SubSector: Long-Term Care Facilities | |
| MarketCap: 1164.86 Millions | |
| Recent Price: 93.20 Smart Investing & Trading Score: 64 | |
| Day Percent Change: -0.22% Day Change: -0.21 | |
| Week Change: 2.1% Year-to-date Change: 0.8% | |
| NHC Links: Profile News Message Board | |
| Charts:- Daily , Weekly | |
| Add NHC to Watchlist: View: Get Complete NHC Trend Analysis ➞ | |
 | KGS Kodiak Gas Services, LLC |
| Sector: Energy | |
| SubSector: Oil & Gas Equipment & Services | |
| MarketCap: 1220 Millions | |
| Recent Price: 27.04 Smart Investing & Trading Score: 54 | |
| Day Percent Change: -0.22% Day Change: -0.06 | |
| Week Change: -3.05% Year-to-date Change: 35.3% | |
| KGS Links: Profile News Message Board | |
| Charts:- Daily , Weekly | |
| Add KGS to Watchlist: View: Get Complete KGS Trend Analysis ➞ | |
 | ATSG Air Transport Services Group, Inc. |
| Sector: Transports | |
| SubSector: Air Delivery & Freight Services | |
| MarketCap: 1111.68 Millions | |
| Recent Price: 13.16 Smart Investing & Trading Score: 100 | |
| Day Percent Change: -0.23% Day Change: -0.03 | |
| Week Change: 1.94% Year-to-date Change: -25.3% | |
| ATSG Links: Profile News Message Board | |
| Charts:- Daily , Weekly | |
| Add ATSG to Watchlist: View: Get Complete ATSG Trend Analysis ➞ | |
 | HMN Horace Mann Educators Corporation |
| Sector: Financials | |
| SubSector: Property & Casualty Insurance | |
| MarketCap: 1545.52 Millions | |
| Recent Price: 37.76 Smart Investing & Trading Score: 100 | |
| Day Percent Change: -0.24% Day Change: -0.09 | |
| Week Change: 2.78% Year-to-date Change: 15.5% | |
| HMN Links: Profile News Message Board | |
| Charts:- Daily , Weekly | |
| Add HMN to Watchlist: View: Get Complete HMN Trend Analysis ➞ | |
 | NC NACCO Industries, Inc. |
| Sector: Consumer Staples | |
| SubSector: Home Furnishings & Fixtures | |
| MarketCap: 179.835 Millions | |
| Recent Price: 31.61 Smart Investing & Trading Score: 74 | |
| Day Percent Change: -0.25% Day Change: -0.08 | |
| Week Change: 12.29% Year-to-date Change: -13.4% | |
| NC Links: Profile News Message Board | |
| Charts:- Daily , Weekly | |
| Add NC to Watchlist: View: Get Complete NC Trend Analysis ➞ | |
 | SWI SolarWinds Corporation |
| Sector: Technology | |
| SubSector: Application Software | |
| MarketCap: 4524.62 Millions | |
| Recent Price: 11.55 Smart Investing & Trading Score: 64 | |
| Day Percent Change: -0.26% Day Change: -0.03 | |
| Week Change: 3.87% Year-to-date Change: -7.5% | |
| SWI Links: Profile News Message Board | |
| Charts:- Daily , Weekly | |
| Add SWI to Watchlist: View: Get Complete SWI Trend Analysis ➞ | |
| For tabular summary view of above stock list: Summary View ➞ 0 - 25 , 25 - 50 , 50 - 75 , 75 - 100 , 100 - 125 , 125 - 150 , 150 - 175 , 175 - 200 , 200 - 225 , 225 - 250 , 250 - 275 , 275 - 300 , 300 - 325 , 325 - 350 , 350 - 375 , 375 - 400 , 400 - 425 , 425 - 450 , 450 - 475 , 475 - 500 , 500 - 525 , 525 - 550 , 550 - 575 , 575 - 600 , 600 - 625 , 625 - 650 , 650 - 675 , 675 - 700 , 700 - 725 , 725 - 750 , 750 - 775 , 775 - 800 , 800 - 825 , 825 - 850 , 850 - 875 , 875 - 900 , 900 - 925 , 925 - 950 , 950 - 975 , 975 - 1000 , 1000 - 1025 , 1025 - 1050 , 1050 - 1075 , 1075 - 1100 , 1100 - 1125 , 1125 - 1150 , 1150 - 1175 , 1175 - 1200 , 1200 - 1225 , 1225 - 1250 , 1250 - 1275 , 1275 - 1300 , 1300 - 1325 , 1325 - 1350 , 1350 - 1375 , 1375 - 1400 , 1400 - 1425 , 1425 - 1450 , 1450 - 1475 , 1475 - 1500 , 1500 - 1525 , 1525 - 1550 , 1550 - 1575 , 1575 - 1600 | ||
| Click To Change The Sort Order: By Market Cap or Company Size Performance: Year-to-date, Week and Day | |
| Select Chart Type: | ||
| Too many stocks? View smallcap stocks filtered by marketcap & sector |
| Marketcap: All SmallCap Stocks (default-no microcap), Large, Mid-Range, Small & MicroCap |
| Sector: Tech, Finance, Energy, Staples, Retail, Industrial, Materials, Utilities & Medical |
|
Best Stocks Today 12Stocks.com |
© 2024 12Stocks.com Terms & Conditions Privacy Contact Us
All Information Provided Only For Education And Not To Be Used For Investing or Trading. See Terms & Conditions


One More Thing ... Get Best Stocks Delivered Daily!
Never Ever Miss A Move With Our Top Ten Stocks Lists
Find Best Stocks In Any Market - Bull or Bear Market
Take A Peek At Our Top Ten Stocks Lists: Daily, Weekly, Year-to-Date & Top Trends
Find Best Stocks In Any Market - Bull or Bear Market
Take A Peek At Our Top Ten Stocks Lists: Daily, Weekly, Year-to-Date & Top Trends
Smallcap Stocks With Best Up Trends [0-bearish to 100-bullish]: Origin Materials[100], Clearfield [100], Fluence Energy[100], Emergent BioSolutions[100], TPI Composites[100], ALLETE [100], E.W. Scripps[100], Conduent [100], Cutera [100], Bloom Energy[100], Super Group[100]
Best Smallcap Stocks Year-to-Date:
Janux [458.63%], Longboard [289.77%], Alpine Immune[239.36%], Avidity Biosciences[198.01%], Bakkt [194.84%], Vera [187.73%], Cullinan Oncology[177.78%], Super Micro[177.56%], Arcutis Bio[169.66%], Y-mAbs [154.69%], Sana [148.85%] Best Smallcap Stocks This Week:
Emergent BioSolutions[88.54%], Deciphera [73.28%], Origin Materials[59.41%], Eyenovia [59.18%], Enovix [54.87%], Codexis [46.8%], Cue Biopharma[41.39%], WideOpenWest [41.07%], TPI Composites[40.65%], Seres [39.39%], Carvana Co[39.19%] Best Smallcap Stocks Daily:
WideOpenWest [29.16%], Alignment Healthcare[24.23%], Ardelyx [23.42%], Twist Bioscience[23.18%], El Pollo[21.45%], IES [20.21%], Vaxxinity [17.64%], Enovix [17.26%], Origin Materials[17.01%], Codexis [16.92%], Adtalem Global[16.86%]