
 Login Sign Up


| |||||
 |  | ||||

| 12Stocks.com Market Intelligence |
Best SmallCap Stocks
|
| In a hurry? Small Cap Stock Lists: Performance Trends Table, Stock Charts
Sort Small Cap stocks: Daily, Weekly, Year-to-Date, Market Cap & Trends. Filter Small Cap stocks list by sector: Show all, Tech, Finance, Energy, Staples, Retail, Industrial, Materials, Utilities and HealthCare Filter Small Cap stocks list by size: All Large Medium Small and MicroCap |
| 12Stocks.com Small Cap Stocks Performances & Trends Daily | |||||||||
|
|  The overall Smart Investing & Trading Score is 49 (0-bearish to 100-bullish) which puts Small Cap index in short term neutral trend. The Smart Investing & Trading Score from previous trading session is 14 and hence an improvement of trend.
| ||||||||
Here are the Smart Investing & Trading Scores of the most requested small cap stocks at 12Stocks.com (click stock name for detailed review):
|


| 12Stocks.com: Investing in Smallcap Index with Stocks | |
|
The following table helps investors and traders sort through current performance and trends (as measured by Smart Investing & Trading Score) of various
stocks in the Smallcap Index. Quick View: Move mouse or cursor over stock symbol (ticker) to view short-term technical chart and over stock name to view long term chart. Click on  to add stock symbol to your watchlist and to add stock symbol to your watchlist and  to view watchlist. Click on any ticker or stock name for detailed market intelligence report for that stock. to view watchlist. Click on any ticker or stock name for detailed market intelligence report for that stock. |
12Stocks.com Performance of Stocks in Smallcap Index
| Ticker | Stock Name | Watchlist | Category | Recent Price | Smart Investing & Trading Score | Change % | YTD Change% |
| NARI | Inari Medical |   | Health Care | 41.99 | 74 | 0.94 | -35.34% |
| SAFT | Safety Insurance | | Financials | 81.00 | 62 | 0.93 | 6.59% |
| TSBK | Timberland Bancorp | | Financials | 26.01 | 80 | 0.93 | -17.32% |
| EWCZ | European Wax | | Consumer Staples | 11.88 | 59 | 0.93 | -12.26% |
| PROK | ProKidney | | Health Care | 2.18 | 63 | 0.93 | 24.93% |
| CRK | Comstock Resources | | Energy | 9.86 | 63 | 0.92 | 11.41% |
| MNKD | MannKind | | Health Care | 4.38 | 90 | 0.92 | 20.33% |
| CNK | Cinemark | | Services & Goods | 17.59 | 56 | 0.92 | 24.84% |
| FN | Fabrinet | | Technology | 174.19 | 35 | 0.92 | -8.48% |
| INVA | Innoviva | | Health Care | 15.37 | 52 | 0.92 | -4.18% |
| DNUT | Krispy Kreme | | Consumer Staples | 12.62 | 17 | 0.92 | -16.98% |
| MPB | Mid Penn | | Financials | 20.99 | 68 | 0.91 | -13.55% |
| IMVT | Immunovant | | Health Care | 28.78 | 42 | 0.91 | -31.69% |
| FTCI | FTC Solar | | Technology | 0.45 | 44 | 0.91 | -34.33% |
| INDB | Independent Bank | | Financials | 51.33 | 57 | 0.90 | -22.00% |
| ANIP | ANI | | Health Care | 67.11 | 47 | 0.89 | 21.71% |
| BSIG | BrightSphere | | Financials | 22.62 | 56 | 0.89 | 18.06% |
| WNC | Wabash National | | Consumer Staples | 22.89 | 10 | 0.88 | -10.66% |
| GABC | German American | | Financials | 31.96 | 63 | 0.88 | -1.39% |
| SST | System1 | | Industrials | 1.74 | 41 | 0.87 | -28.01% |
| ACRE | Ares Commercial | | Financials | 6.99 | 59 | 0.87 | -32.53% |
| NNOX | Nano X | | Health Care | 9.24 | 37 | 0.87 | 45.05% |
| INZY | Inozyme Pharma | | Health Care | 4.65 | 39 | 0.87 | 9.28% |
| BARK | BARK | | Services & Goods | 1.16 | 54 | 0.87 | 44.96% |
| MOND | Mondee | | Services & Goods | 2.32 | 88 | 0.87 | -16.55% |


| Too many stocks? View smallcap stocks filtered by marketcap & sector |
| Marketcap: All SmallCap Stocks (default-no microcap), Large, Mid-Range, Small |
| Smallcap Sector: Tech, Finance, Energy, Staples, Retail, Industrial, Materials, & Medical |
|
Get the most comprehensive stock market coverage daily at 12Stocks.com ➞ Best Stocks Today ➞ Best Stocks Weekly ➞ Best Stocks Year-to-Date ➞ Best Stocks Trends ➞  Best Stocks Today 12Stocks.com Best Nasdaq Stocks ➞ Best S&P 500 Stocks ➞ Best Tech Stocks ➞ Best Biotech Stocks ➞ |
| Detailed Overview of SmallCap Stocks |
| SmallCap Technical Overview, Leaders & Laggards, Top SmallCap ETF Funds & Detailed SmallCap Stocks List, Charts, Trends & More |
| Smallcap: Technical Analysis, Trends & YTD Performance | |
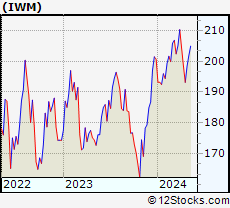
| SmallCap segment as represented by
IWM, an exchange-traded fund [ETF], holds basket of thousands of smallcap stocks from across all major sectors of the US stock market. The smallcap index (contains stocks like Riverbed & Sotheby's) is down by -0.39% and is currently underperforming the overall market by -6.01% year-to-date. Below is a quick view of technical charts and trends: | |
 IWM Weekly Chart |
|
| Long Term Trend: Not Good | |
| Medium Term Trend: Good | |
 IWM Daily Chart |
|
| Short Term Trend: Deteriorating | |
| Overall Trend Score: 49 | |
| YTD Performance: -0.39% | |
| **Trend Scores & Views Are Only For Educational Purposes And Not For Investing | |
| 12Stocks.com: Top Performing Small Cap Index Stocks | ||||||||||||||||||||||||||||||||||||||||||||||||
 The top performing Small Cap Index stocks year to date are
Now, more recently, over last week, the top performing Small Cap Index stocks on the move are


|
||||||||||||||||||||||||||||||||||||||||||||||||
| 12Stocks.com: Investing in Smallcap Index using Exchange Traded Funds | |
|
The following table shows list of key exchange traded funds (ETF) that
help investors track Smallcap index. The following list also includes leveraged ETF funds that track twice or thrice the daily returns of Smallcap indices. Short or inverse ETF funds move in the opposite direction to the index they track and are useful during market pullbacks or during bear markets. Quick View: Move mouse or cursor over ETF symbol (ticker) to view short-term technical chart and over ETF name to view long term chart. Click on ticker or stock name for detailed view. Click on to add stock symbol to your watchlist and to view watchlist. |
12Stocks.com List of ETFs that track Smallcap Index
| Ticker | ETF Name | Watchlist | Recent Price | Smart Investing & Trading Score | Change % | Week % | Year-to-date % |
| IWM | iShares Russell 2000 | | 199.92 | 49 | 1.84 | 0.77 | -0.39% |
| IJR | iShares Core S&P Small-Cap | | 106.33 | 50 | 1.52 | 0.64 | -1.77% |
| VTWO | Vanguard Russell 2000 ETF | | 80.85 | 42 | 1.88 | 0.79 | -0.31% |
| IWN | iShares Russell 2000 Value | | 152.88 | 75 | 2.04 | 1.15 | -1.58% |
| IWO | iShares Russell 2000 Growth | | 254.34 | 32 | 1.91 | 0.49 | 0.84% |
| IJS | iShares S&P Small-Cap 600 Value | | 98.02 | 43 | 1.68 | 0.85 | -4.9% |
| IJT | iShares S&P Small-Cap 600 Growth | | 126.72 | 63 | 1.42 | 0.5 | 1.26% |
| XSLV | PowerShares S&P SmallCap Low Volatil ETF | | 43.14 | 73 | 0.72 | 0.98 | -2.29% |
| SDD | ProShares UltraShort SmallCap600 | | 19.31 | 56 | -2.02 | -0.21 | 4.79% |
| SMLV | SPDR SSGA US Small Cap Low Volatil ETF | | 108.83 | 87 | 1.30 | 1.22 | -3.27% |
| SAA | ProShares Ultra SmallCap600 | | 22.93 | 42 | 1.56 | -0.46 | -8.08% |
| SBB | ProShares Short SmallCap600 | | 16.37 | 49 | -1.14 | -0.09 | 2.76% |
| 12Stocks.com: Charts, Trends, Fundamental Data and Performances of SmallCap Stocks | |
|
We now take in-depth look at all SmallCap stocks including charts, multi-period performances and overall trends (as measured by Smart Investing & Trading Score). One can sort SmallCap stocks (click link to choose) by Daily, Weekly and by Year-to-Date performances. Also, one can sort by size of the company or by market capitalization. |
| Select Your Default Chart Type: | |||||
| |||||
| Click on stock symbol or name for detailed view. Click on to add stock symbol to your watchlist and to view watchlist. Quick View: Move mouse or cursor over "Daily" to quickly view daily technical stock chart and over "Weekly" to view weekly technical stock chart. | |||||

 | NARI Inari Medical, Inc. |
| Sector: Health Care | |
| SubSector: Medical Devices | |
| MarketCap: 33287 Millions | |
| Recent Price: 41.99 Smart Investing & Trading Score: 74 | |
| Day Percent Change: 0.94% Day Change: 0.39 | |
| Week Change: 9.29% Year-to-date Change: -35.3% | |
| NARI Links: Profile News Message Board | |
| Charts:- Daily , Weekly | |
| Add NARI to Watchlist: View: Get Complete NARI Trend Analysis ➞ | |
 | SAFT Safety Insurance Group, Inc. |
| Sector: Financials | |
| SubSector: Property & Casualty Insurance | |
| MarketCap: 1145.12 Millions | |
| Recent Price: 81.00 Smart Investing & Trading Score: 62 | |
| Day Percent Change: 0.93% Day Change: 0.75 | |
| Week Change: 2.77% Year-to-date Change: 6.6% | |
| SAFT Links: Profile News Message Board | |
| Charts:- Daily , Weekly | |
| Add SAFT to Watchlist: View: Get Complete SAFT Trend Analysis ➞ | |
 | TSBK Timberland Bancorp, Inc. |
| Sector: Financials | |
| SubSector: Savings & Loans | |
| MarketCap: 155.03 Millions | |
| Recent Price: 26.01 Smart Investing & Trading Score: 80 | |
| Day Percent Change: 0.93% Day Change: 0.24 | |
| Week Change: 3.01% Year-to-date Change: -17.3% | |
| TSBK Links: Profile News Message Board | |
| Charts:- Daily , Weekly | |
| Add TSBK to Watchlist: View: Get Complete TSBK Trend Analysis ➞ | |
 | EWCZ European Wax Center, Inc. |
| Sector: Consumer Staples | |
| SubSector: Household & Personal Products | |
| MarketCap: 1180 Millions | |
| Recent Price: 11.88 Smart Investing & Trading Score: 59 | |
| Day Percent Change: 0.93% Day Change: 0.11 | |
| Week Change: 2.06% Year-to-date Change: -12.3% | |
| EWCZ Links: Profile News Message Board | |
| Charts:- Daily , Weekly | |
| Add EWCZ to Watchlist: View: Get Complete EWCZ Trend Analysis ➞ | |
 | PROK ProKidney Corp. |
| Sector: Health Care | |
| SubSector: Biotechnology | |
| MarketCap: 2470 Millions | |
| Recent Price: 2.18 Smart Investing & Trading Score: 63 | |
| Day Percent Change: 0.93% Day Change: 0.02 | |
| Week Change: 3.07% Year-to-date Change: 24.9% | |
| PROK Links: Profile News Message Board | |
| Charts:- Daily , Weekly | |
| Add PROK to Watchlist: View: Get Complete PROK Trend Analysis ➞ | |
 | CRK Comstock Resources, Inc. |
| Sector: Energy | |
| SubSector: Independent Oil & Gas | |
| MarketCap: 959.793 Millions | |
| Recent Price: 9.86 Smart Investing & Trading Score: 63 | |
| Day Percent Change: 0.92% Day Change: 0.09 | |
| Week Change: -4.46% Year-to-date Change: 11.4% | |
| CRK Links: Profile News Message Board | |
| Charts:- Daily , Weekly | |
| Add CRK to Watchlist: View: Get Complete CRK Trend Analysis ➞ | |
 | MNKD MannKind Corporation |
| Sector: Health Care | |
| SubSector: Biotechnology | |
| MarketCap: 250.885 Millions | |
| Recent Price: 4.38 Smart Investing & Trading Score: 90 | |
| Day Percent Change: 0.92% Day Change: 0.04 | |
| Week Change: 3.55% Year-to-date Change: 20.3% | |
| MNKD Links: Profile News Message Board | |
| Charts:- Daily , Weekly | |
| Add MNKD to Watchlist: View: Get Complete MNKD Trend Analysis ➞ | |
 | CNK Cinemark Holdings, Inc. |
| Sector: Services & Goods | |
| SubSector: Movie Production, Theaters | |
| MarketCap: 1776.29 Millions | |
| Recent Price: 17.59 Smart Investing & Trading Score: 56 | |
| Day Percent Change: 0.92% Day Change: 0.16 | |
| Week Change: -0.34% Year-to-date Change: 24.8% | |
| CNK Links: Profile News Message Board | |
| Charts:- Daily , Weekly | |
| Add CNK to Watchlist: View: Get Complete CNK Trend Analysis ➞ | |
 | FN Fabrinet |
| Sector: Technology | |
| SubSector: Electronic Equipment | |
| MarketCap: 1876 Millions | |
| Recent Price: 174.19 Smart Investing & Trading Score: 35 | |
| Day Percent Change: 0.92% Day Change: 1.58 | |
| Week Change: -0.72% Year-to-date Change: -8.5% | |
| FN Links: Profile News Message Board | |
| Charts:- Daily , Weekly | |
| Add FN to Watchlist: View: Get Complete FN Trend Analysis ➞ | |
 | INVA Innoviva, Inc. |
| Sector: Health Care | |
| SubSector: Biotechnology | |
| MarketCap: 1023.15 Millions | |
| Recent Price: 15.37 Smart Investing & Trading Score: 52 | |
| Day Percent Change: 0.92% Day Change: 0.14 | |
| Week Change: 0.72% Year-to-date Change: -4.2% | |
| INVA Links: Profile News Message Board | |
| Charts:- Daily , Weekly | |
| Add INVA to Watchlist: View: Get Complete INVA Trend Analysis ➞ | |
 | DNUT Krispy Kreme, Inc. |
| Sector: Consumer Staples | |
| SubSector: Grocery Stores | |
| MarketCap: 2480 Millions | |
| Recent Price: 12.62 Smart Investing & Trading Score: 17 | |
| Day Percent Change: 0.92% Day Change: 0.12 | |
| Week Change: -2.96% Year-to-date Change: -17.0% | |
| DNUT Links: Profile News Message Board | |
| Charts:- Daily , Weekly | |
| Add DNUT to Watchlist: View: Get Complete DNUT Trend Analysis ➞ | |
 | MPB Mid Penn Bancorp, Inc. |
| Sector: Financials | |
| SubSector: Regional - Northeast Banks | |
| MarketCap: 187.699 Millions | |
| Recent Price: 20.99 Smart Investing & Trading Score: 68 | |
| Day Percent Change: 0.91% Day Change: 0.19 | |
| Week Change: 0.62% Year-to-date Change: -13.6% | |
| MPB Links: Profile News Message Board | |
| Charts:- Daily , Weekly | |
| Add MPB to Watchlist: View: Get Complete MPB Trend Analysis ➞ | |
 | IMVT Immunovant, Inc. |
| Sector: Health Care | |
| SubSector: Biotechnology | |
| MarketCap: 552.885 Millions | |
| Recent Price: 28.78 Smart Investing & Trading Score: 42 | |
| Day Percent Change: 0.91% Day Change: 0.26 | |
| Week Change: 5.93% Year-to-date Change: -31.7% | |
| IMVT Links: Profile News Message Board | |
| Charts:- Daily , Weekly | |
| Add IMVT to Watchlist: View: Get Complete IMVT Trend Analysis ➞ | |
 | FTCI FTC Solar, Inc. |
| Sector: Technology | |
| SubSector: Solar | |
| MarketCap: 345 Millions | |
| Recent Price: 0.45 Smart Investing & Trading Score: 44 | |
| Day Percent Change: 0.91% Day Change: 0.00 | |
| Week Change: 5.64% Year-to-date Change: -34.3% | |
| FTCI Links: Profile News Message Board | |
| Charts:- Daily , Weekly | |
| Add FTCI to Watchlist: View: Get Complete FTCI Trend Analysis ➞ | |
 | INDB Independent Bank Corp. |
| Sector: Financials | |
| SubSector: Regional - Northeast Banks | |
| MarketCap: 2347.09 Millions | |
| Recent Price: 51.33 Smart Investing & Trading Score: 57 | |
| Day Percent Change: 0.90% Day Change: 0.46 | |
| Week Change: -2.66% Year-to-date Change: -22.0% | |
| INDB Links: Profile News Message Board | |
| Charts:- Daily , Weekly | |
| Add INDB to Watchlist: View: Get Complete INDB Trend Analysis ➞ | |
 | ANIP ANI Pharmaceuticals, Inc. |
| Sector: Health Care | |
| SubSector: Biotechnology | |
| MarketCap: 489.285 Millions | |
| Recent Price: 67.11 Smart Investing & Trading Score: 47 | |
| Day Percent Change: 0.89% Day Change: 0.59 | |
| Week Change: 2.68% Year-to-date Change: 21.7% | |
| ANIP Links: Profile News Message Board | |
| Charts:- Daily , Weekly | |
| Add ANIP to Watchlist: View: Get Complete ANIP Trend Analysis ➞ | |
 | BSIG BrightSphere Investment Group Inc. |
| Sector: Financials | |
| SubSector: Asset Management | |
| MarketCap: 430.103 Millions | |
| Recent Price: 22.62 Smart Investing & Trading Score: 56 | |
| Day Percent Change: 0.89% Day Change: 0.20 | |
| Week Change: 0.04% Year-to-date Change: 18.1% | |
| BSIG Links: Profile News Message Board | |
| Charts:- Daily , Weekly | |
| Add BSIG to Watchlist: View: Get Complete BSIG Trend Analysis ➞ | |
 | WNC Wabash National Corporation |
| Sector: Consumer Staples | |
| SubSector: Trucks & Other Vehicles | |
| MarketCap: 482.597 Millions | |
| Recent Price: 22.89 Smart Investing & Trading Score: 10 | |
| Day Percent Change: 0.88% Day Change: 0.20 | |
| Week Change: -6.99% Year-to-date Change: -10.7% | |
| WNC Links: Profile News Message Board | |
| Charts:- Daily , Weekly | |
| Add WNC to Watchlist: View: Get Complete WNC Trend Analysis ➞ | |
 | GABC German American Bancorp, Inc. |
| Sector: Financials | |
| SubSector: Regional - Midwest Banks | |
| MarketCap: 731.47 Millions | |
| Recent Price: 31.96 Smart Investing & Trading Score: 63 | |
| Day Percent Change: 0.88% Day Change: 0.28 | |
| Week Change: -0.9% Year-to-date Change: -1.4% | |
| GABC Links: Profile News Message Board | |
| Charts:- Daily , Weekly | |
| Add GABC to Watchlist: View: Get Complete GABC Trend Analysis ➞ | |
 | SST System1, Inc. |
| Sector: Industrials | |
| SubSector: Specialty Business Services | |
| MarketCap: 504 Millions | |
| Recent Price: 1.74 Smart Investing & Trading Score: 41 | |
| Day Percent Change: 0.87% Day Change: 0.02 | |
| Week Change: 0.29% Year-to-date Change: -28.0% | |
| SST Links: Profile News Message Board | |
| Charts:- Daily , Weekly | |
| Add SST to Watchlist: View: Get Complete SST Trend Analysis ➞ | |
 | ACRE Ares Commercial Real Estate Corporation |
| Sector: Financials | |
| SubSector: Mortgage Investment | |
| MarketCap: 242.339 Millions | |
| Recent Price: 6.99 Smart Investing & Trading Score: 59 | |
| Day Percent Change: 0.87% Day Change: 0.06 | |
| Week Change: 2.04% Year-to-date Change: -32.5% | |
| ACRE Links: Profile News Message Board | |
| Charts:- Daily , Weekly | |
| Add ACRE to Watchlist: View: Get Complete ACRE Trend Analysis ➞ | |
 | NNOX Nano X Imaging Ltd. |
| Sector: Health Care | |
| SubSector: Medical Devices | |
| MarketCap: 22587 Millions | |
| Recent Price: 9.24 Smart Investing & Trading Score: 37 | |
| Day Percent Change: 0.87% Day Change: 0.08 | |
| Week Change: 3.13% Year-to-date Change: 45.1% | |
| NNOX Links: Profile News Message Board | |
| Charts:- Daily , Weekly | |
| Add NNOX to Watchlist: View: Get Complete NNOX Trend Analysis ➞ | |
 | INZY Inozyme Pharma, Inc. |
| Sector: Health Care | |
| SubSector: Biotechnology | |
| MarketCap: 53487 Millions | |
| Recent Price: 4.65 Smart Investing & Trading Score: 39 | |
| Day Percent Change: 0.87% Day Change: 0.04 | |
| Week Change: 4.73% Year-to-date Change: 9.3% | |
| INZY Links: Profile News Message Board | |
| Charts:- Daily , Weekly | |
| Add INZY to Watchlist: View: Get Complete INZY Trend Analysis ➞ | |
 | BARK BARK, Inc. |
| Sector: Services & Goods | |
| SubSector: Specialty Retail | |
| MarketCap: 234 Millions | |
| Recent Price: 1.16 Smart Investing & Trading Score: 54 | |
| Day Percent Change: 0.87% Day Change: 0.01 | |
| Week Change: 5.45% Year-to-date Change: 45.0% | |
| BARK Links: Profile News Message Board | |
| Charts:- Daily , Weekly | |
| Add BARK to Watchlist: View: Get Complete BARK Trend Analysis ➞ | |
 | MOND Mondee Holdings, Inc. |
| Sector: Services & Goods | |
| SubSector: Travel Services | |
| MarketCap: 744 Millions | |
| Recent Price: 2.32 Smart Investing & Trading Score: 88 | |
| Day Percent Change: 0.87% Day Change: 0.02 | |
| Week Change: 6.42% Year-to-date Change: -16.6% | |
| MOND Links: Profile News Message Board | |
| Charts:- Daily , Weekly | |
| Add MOND to Watchlist: View: Get Complete MOND Trend Analysis ➞ | |
| Too many stocks? View smallcap stocks filtered by marketcap & sector |
| Marketcap: All SmallCap Stocks (default-no microcap), Large, Mid-Range, Small & MicroCap |
| Sector: Tech, Finance, Energy, Staples, Retail, Industrial, Materials, Utilities & Medical |
|
Best Stocks Today 12Stocks.com |
© 2024 12Stocks.com Terms & Conditions Privacy Contact Us
All Information Provided Only For Education And Not To Be Used For Investing or Trading. See Terms & Conditions


One More Thing ... Get Best Stocks Delivered Daily!
Never Ever Miss A Move With Our Top Ten Stocks Lists
Find Best Stocks In Any Market - Bull or Bear Market
Take A Peek At Our Top Ten Stocks Lists: Daily, Weekly, Year-to-Date & Top Trends
Find Best Stocks In Any Market - Bull or Bear Market
Take A Peek At Our Top Ten Stocks Lists: Daily, Weekly, Year-to-Date & Top Trends
Smallcap Stocks With Best Up Trends [0-bearish to 100-bullish]: Emergent BioSolutions[100], Aspen Aerogels[100], Carvana Co[100], Perdoceo Education[100], Gannett Co[100], Pitney Bowes[100], Benchmark Electronics[100], Origin Materials[100], FormFactor [100], Lantheus [100], Q2 [100]
Best Smallcap Stocks Year-to-Date:
Janux [440.16%], Viking [307.09%], Longboard [273.98%], Alpine Immune[239.29%], Bakkt [187.89%], Avidity Biosciences[182.96%], Vera [170.74%], Cullinan Oncology[169.74%], Super Micro[168.25%], Arcutis Bio[166.25%], Y-mAbs [152.93%] Best Smallcap Stocks This Week:
Deciphera [73.24%], Emergent BioSolutions[71.88%], Eyenovia [49.22%], Aspen Aerogels[48.14%], P3 Health[38.51%], Carvana Co[38.18%], Cue Biopharma[37.73%], Origin Materials[36.24%], TransMedics Group[35.14%], Seres [34.55%], Enovix [32.07%] Best Smallcap Stocks Daily:
Emergent BioSolutions[70.98%], Aspen Aerogels[56.70%], Carvana Co[33.77%], Perdoceo Education[31.46%], Enovix [31.06%], Office Properties[28.00%], Gannett Co[26.97%], Sunnova Energy[25.21%], Pitney Bowes[24.70%], Pulmonx [21.50%], CommScope Holding[20.95%]