
 Login Sign Up


| |||||
 |  | ||||

| 12Stocks.com Market Intelligence |
Best SmallCap Stocks
|
| In a hurry? Small Cap Stock Lists: Performance Trends Table, Stock Charts
Sort Small Cap stocks: Daily, Weekly, Year-to-Date, Market Cap & Trends. Filter Small Cap stocks list by sector: Show all, Tech, Finance, Energy, Staples, Retail, Industrial, Materials, Utilities and HealthCare Filter Small Cap stocks list by size: All Large Medium Small and MicroCap |
| 12Stocks.com Small Cap Stocks Performances & Trends Daily | |||||||||
|
|  The overall Smart Investing & Trading Score is 82 (0-bearish to 100-bullish) which puts Small Cap index in short term bullish trend. The Smart Investing & Trading Score from previous trading session is 69 and hence an improvement of trend.
| ||||||||
Here are the Smart Investing & Trading Scores of the most requested small cap stocks at 12Stocks.com (click stock name for detailed review):
|


| 12Stocks.com: Investing in Smallcap Index with Stocks | |
|
The following table helps investors and traders sort through current performance and trends (as measured by Smart Investing & Trading Score) of various
stocks in the Smallcap Index. Quick View: Move mouse or cursor over stock symbol (ticker) to view short-term technical chart and over stock name to view long term chart. Click on  to add stock symbol to your watchlist and to add stock symbol to your watchlist and  to view watchlist. Click on any ticker or stock name for detailed market intelligence report for that stock. to view watchlist. Click on any ticker or stock name for detailed market intelligence report for that stock. |
12Stocks.com Performance of Stocks in Smallcap Index
| Ticker | Stock Name | Watchlist | Category | Recent Price | Smart Investing & Trading Score | Change % | YTD Change% |
| RLAY | Relay |   | Health Care | 6.92 | 62 | -1.42 | -37.09% |
| ANNX | Annexon | | Health Care | 4.82 | 47 | -1.43 | 5.70% |
| ACRV | Acrivon | | Health Care | 8.95 | 68 | -1.43 | 80.08% |
| LIVN | LivaNova | | Health Care | 63.21 | 95 | -1.47 | 22.17% |
| RVMD | Revolution Medicines | | Health Care | 39.61 | 88 | -1.47 | 38.11% |
| ALEC | Alector | | Health Care | 5.31 | 50 | -1.48 | -33.46% |
| ANAB | AnaptysBio | | Health Care | 26.18 | 88 | -1.49 | 22.25% |
| GRTS | Gritstone Oncology | | Health Care | 0.95 | 59 | -1.49 | -53.51% |
| PLSE | Pulse Biosciences | | Health Care | 7.70 | 52 | -1.53 | -37.09% |
| SCLX | Scilex Holding | | Health Care | 0.86 | 35 | -1.53 | -56.12% |
| IMRX | Immuneering | | Health Care | 1.60 | 42 | -1.54 | -78.99% |
| AVXL | Anavex Life | | Health Care | 3.79 | 52 | -1.56 | -59.29% |
| ZIMV | ZimVie | | Health Care | 15.74 | 57 | -1.56 | -11.17% |
| EDIT | Editas Medicine | | Health Care | 5.58 | 57 | -1.59 | -44.92% |
| TNYA | Tenaya | | Health Care | 4.63 | 37 | -1.59 | 45.75% |
| TGTX | TG | | Health Care | 15.93 | 55 | -1.61 | -6.73% |
| ORGO | Organogenesis | | Health Care | 2.45 | 20 | -1.61 | -40.10% |
| BMEA | Biomea Fusion | | Health Care | 12.08 | 57 | -1.67 | -17.49% |
| VIR | Vir | | Health Care | 10.22 | 74 | -1.68 | 1.54% |
| NUVL | Nuvalent | | Health Care | 69.63 | 25 | -1.68 | -5.25% |
| AXGN | AxoGen | | Health Care | 5.69 | 0 | -1.73 | -16.69% |
| CYH | Community Health | | Health Care | 3.36 | 75 | -1.75 | 7.35% |
| RCKT | Rocket | | Health Care | 23.06 | 50 | -1.75 | -23.06% |
| ARCT | Arcturus | | Health Care | 26.79 | 42 | -1.76 | -15.03% |
| SUPN | Supernus | | Health Care | 30.28 | 78 | -1.78 | 4.63% |
| For chart view version of above stock list: Chart View ➞ 0 - 25 , 25 - 50 , 50 - 75 , 75 - 100 , 100 - 125 , 125 - 150 , 150 - 175 , 175 - 200 , 200 - 225 , 225 - 250 , 250 - 275 , 275 - 300 , 300 - 325 , 325 - 350 | ||
 | Click To Change The Sort Order: By Market Cap or Company Size Performance: Year-to-date, Week and Day |  |
| Too many stocks? View smallcap stocks filtered by marketcap & sector |
| Marketcap: All SmallCap Stocks (default-no microcap), Large, Mid-Range, Small |
| Smallcap Sector: Tech, Finance, Energy, Staples, Retail, Industrial, Materials, & Medical |
|
Get the most comprehensive stock market coverage daily at 12Stocks.com ➞ Best Stocks Today ➞ Best Stocks Weekly ➞ Best Stocks Year-to-Date ➞ Best Stocks Trends ➞  Best Stocks Today 12Stocks.com Best Nasdaq Stocks ➞ Best S&P 500 Stocks ➞ Best Tech Stocks ➞ Best Biotech Stocks ➞ |
| Detailed Overview of SmallCap Stocks |
| SmallCap Technical Overview, Leaders & Laggards, Top SmallCap ETF Funds & Detailed SmallCap Stocks List, Charts, Trends & More |
| Smallcap: Technical Analysis, Trends & YTD Performance | |
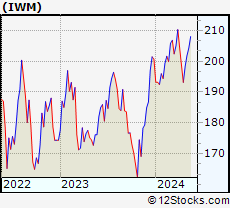
| SmallCap segment as represented by
IWM, an exchange-traded fund [ETF], holds basket of thousands of smallcap stocks from across all major sectors of the US stock market. The smallcap index (contains stocks like Riverbed & Sotheby's) is up by 1.65% and is currently underperforming the overall market by -5.9% year-to-date. Below is a quick view of technical charts and trends: | |
 IWM Weekly Chart |
|
| Long Term Trend: Very Good | |
| Medium Term Trend: Very Good | |
 IWM Daily Chart |
|
| Short Term Trend: Very Good | |
| Overall Trend Score: 82 | |
| YTD Performance: 1.65% | |
| **Trend Scores & Views Are Only For Educational Purposes And Not For Investing | |
| 12Stocks.com: Top Performing Small Cap Index Stocks | ||||||||||||||||||||||||||||||||||||||||||||||||
 The top performing Small Cap Index stocks year to date are
Now, more recently, over last week, the top performing Small Cap Index stocks on the move are


|
||||||||||||||||||||||||||||||||||||||||||||||||
| 12Stocks.com: Investing in Smallcap Index using Exchange Traded Funds | |
|
The following table shows list of key exchange traded funds (ETF) that
help investors track Smallcap index. The following list also includes leveraged ETF funds that track twice or thrice the daily returns of Smallcap indices. Short or inverse ETF funds move in the opposite direction to the index they track and are useful during market pullbacks or during bear markets. Quick View: Move mouse or cursor over ETF symbol (ticker) to view short-term technical chart and over ETF name to view long term chart. Click on ticker or stock name for detailed view. Click on to add stock symbol to your watchlist and to view watchlist. |
12Stocks.com List of ETFs that track Smallcap Index
| Ticker | ETF Name | Watchlist | Recent Price | Smart Investing & Trading Score | Change % | Week % | Year-to-date % |
| IWM | iShares Russell 2000 | | 204.03 | 82 | 1.05 | 1.05 | 1.65% |
| VTWO | Vanguard Russell 2000 ETF | | 82.61 | 82 | 1.23 | 1.23 | 1.86% |
| IJT | iShares S&P Small-Cap 600 Growth | | 128.77 | 95 | 0.79 | 0.79 | 2.9% |
| IJS | iShares S&P Small-Cap 600 Value | | 99.56 | 69 | 0.86 | 0.86 | -3.4% |
| SDD | ProShares UltraShort SmallCap600 | | 18.48 | 10 | -1.94 | -1.94 | 0.29% |
| XSLV | PowerShares S&P SmallCap Low Volatil ETF | | 43.48 | 87 | 0.60 | 0.6 | -1.52% |
| SAA | ProShares Ultra SmallCap600 | | 24.00 | 82 | 1.74 | 1.74 | -3.81% |
| SBB | ProShares Short SmallCap600 | | 16.05 | 13 | -0.68 | -0.68 | 0.75% |
| SMLV | SPDR SSGA US Small Cap Low Volatil ETF | | 109.69 | 87 | 0.00 | 0 | -2.52% |
| 12Stocks.com: Charts, Trends, Fundamental Data and Performances of SmallCap Stocks | |
|
We now take in-depth look at all SmallCap stocks including charts, multi-period performances and overall trends (as measured by Smart Investing & Trading Score). One can sort SmallCap stocks (click link to choose) by Daily, Weekly and by Year-to-Date performances. Also, one can sort by size of the company or by market capitalization. |
| Select Your Default Chart Type: | |||||
| |||||
| Click on stock symbol or name for detailed view. Click on to add stock symbol to your watchlist and to view watchlist. Quick View: Move mouse or cursor over "Daily" to quickly view daily technical stock chart and over "Weekly" to view weekly technical stock chart. | |||||

 | RLAY Relay Therapeutics, Inc. |
| Sector: Health Care | |
| SubSector: Biotechnology | |
| MarketCap: 45887 Millions | |
| Recent Price: 6.92 Smart Investing & Trading Score: 62 | |
| Day Percent Change: -1.42% Day Change: -0.10 | |
| Week Change: -1.42% Year-to-date Change: -37.1% | |
| RLAY Links: Profile News Message Board | |
| Charts:- Daily , Weekly | |
| Add RLAY to Watchlist: View: Get Complete RLAY Trend Analysis ➞ | |
 | ANNX Annexon, Inc. |
| Sector: Health Care | |
| SubSector: Biotechnology | |
| MarketCap: 94487 Millions | |
| Recent Price: 4.82 Smart Investing & Trading Score: 47 | |
| Day Percent Change: -1.43% Day Change: -0.07 | |
| Week Change: -1.43% Year-to-date Change: 5.7% | |
| ANNX Links: Profile News Message Board | |
| Charts:- Daily , Weekly | |
| Add ANNX to Watchlist: View: Get Complete ANNX Trend Analysis ➞ | |
 | ACRV Acrivon Therapeutics, Inc. |
| Sector: Health Care | |
| SubSector: Biotechnology | |
| MarketCap: 286 Millions | |
| Recent Price: 8.95 Smart Investing & Trading Score: 68 | |
| Day Percent Change: -1.43% Day Change: -0.13 | |
| Week Change: -1.43% Year-to-date Change: 80.1% | |
| ACRV Links: Profile News Message Board | |
| Charts:- Daily , Weekly | |
| Add ACRV to Watchlist: View: Get Complete ACRV Trend Analysis ➞ | |
 | LIVN LivaNova PLC |
| Sector: Health Care | |
| SubSector: Medical Appliances & Equipment | |
| MarketCap: 2060.5 Millions | |
| Recent Price: 63.21 Smart Investing & Trading Score: 95 | |
| Day Percent Change: -1.47% Day Change: -0.94 | |
| Week Change: -1.47% Year-to-date Change: 22.2% | |
| LIVN Links: Profile News Message Board | |
| Charts:- Daily , Weekly | |
| Add LIVN to Watchlist: View: Get Complete LIVN Trend Analysis ➞ | |
 | RVMD Revolution Medicines, Inc. |
| Sector: Health Care | |
| SubSector: Biotechnology | |
| MarketCap: 28087 Millions | |
| Recent Price: 39.61 Smart Investing & Trading Score: 88 | |
| Day Percent Change: -1.47% Day Change: -0.59 | |
| Week Change: -1.47% Year-to-date Change: 38.1% | |
| RVMD Links: Profile News Message Board | |
| Charts:- Daily , Weekly | |
| Add RVMD to Watchlist: View: Get Complete RVMD Trend Analysis ➞ | |
 | ALEC Alector, Inc. |
| Sector: Health Care | |
| SubSector: Biotechnology | |
| MarketCap: 2719.35 Millions | |
| Recent Price: 5.31 Smart Investing & Trading Score: 50 | |
| Day Percent Change: -1.48% Day Change: -0.08 | |
| Week Change: -1.48% Year-to-date Change: -33.5% | |
| ALEC Links: Profile News Message Board | |
| Charts:- Daily , Weekly | |
| Add ALEC to Watchlist: View: Get Complete ALEC Trend Analysis ➞ | |
 | ANAB AnaptysBio, Inc. |
| Sector: Health Care | |
| SubSector: Biotechnology | |
| MarketCap: 405.985 Millions | |
| Recent Price: 26.18 Smart Investing & Trading Score: 88 | |
| Day Percent Change: -1.49% Day Change: -0.39 | |
| Week Change: -1.49% Year-to-date Change: 22.3% | |
| ANAB Links: Profile News Message Board | |
| Charts:- Daily , Weekly | |
| Add ANAB to Watchlist: View: Get Complete ANAB Trend Analysis ➞ | |
 | GRTS Gritstone Oncology, Inc. |
| Sector: Health Care | |
| SubSector: Biotechnology | |
| MarketCap: 240.085 Millions | |
| Recent Price: 0.95 Smart Investing & Trading Score: 59 | |
| Day Percent Change: -1.49% Day Change: -0.01 | |
| Week Change: -1.49% Year-to-date Change: -53.5% | |
| GRTS Links: Profile News Message Board | |
| Charts:- Daily , Weekly | |
| Add GRTS to Watchlist: View: Get Complete GRTS Trend Analysis ➞ | |
 | PLSE Pulse Biosciences, Inc. |
| Sector: Health Care | |
| SubSector: Medical Instruments & Supplies | |
| MarketCap: 131.96 Millions | |
| Recent Price: 7.70 Smart Investing & Trading Score: 52 | |
| Day Percent Change: -1.53% Day Change: -0.12 | |
| Week Change: -1.53% Year-to-date Change: -37.1% | |
| PLSE Links: Profile News Message Board | |
| Charts:- Daily , Weekly | |
| Add PLSE to Watchlist: View: Get Complete PLSE Trend Analysis ➞ | |
 | SCLX Scilex Holding Company |
| Sector: Health Care | |
| SubSector: Drug Manufacturers - General | |
| MarketCap: 927 Millions | |
| Recent Price: 0.86 Smart Investing & Trading Score: 35 | |
| Day Percent Change: -1.53% Day Change: -0.01 | |
| Week Change: -1.53% Year-to-date Change: -56.1% | |
| SCLX Links: Profile News Message Board | |
| Charts:- Daily , Weekly | |
| Add SCLX to Watchlist: View: Get Complete SCLX Trend Analysis ➞ | |
 | IMRX Immuneering Corporation |
| Sector: Health Care | |
| SubSector: Biotechnology | |
| MarketCap: 303 Millions | |
| Recent Price: 1.60 Smart Investing & Trading Score: 42 | |
| Day Percent Change: -1.54% Day Change: -0.03 | |
| Week Change: -1.54% Year-to-date Change: -79.0% | |
| IMRX Links: Profile News Message Board | |
| Charts:- Daily , Weekly | |
| Add IMRX to Watchlist: View: Get Complete IMRX Trend Analysis ➞ | |
 | AVXL Anavex Life Sciences Corp. |
| Sector: Health Care | |
| SubSector: Biotechnology | |
| MarketCap: 175.985 Millions | |
| Recent Price: 3.79 Smart Investing & Trading Score: 52 | |
| Day Percent Change: -1.56% Day Change: -0.06 | |
| Week Change: -1.56% Year-to-date Change: -59.3% | |
| AVXL Links: Profile News Message Board | |
| Charts:- Daily , Weekly | |
| Add AVXL to Watchlist: View: Get Complete AVXL Trend Analysis ➞ | |
 | ZIMV ZimVie Inc. |
| Sector: Health Care | |
| SubSector: Medical Devices | |
| MarketCap: 303 Millions | |
| Recent Price: 15.74 Smart Investing & Trading Score: 57 | |
| Day Percent Change: -1.56% Day Change: -0.25 | |
| Week Change: -1.56% Year-to-date Change: -11.2% | |
| ZIMV Links: Profile News Message Board | |
| Charts:- Daily , Weekly | |
| Add ZIMV to Watchlist: View: Get Complete ZIMV Trend Analysis ➞ | |
 | EDIT Editas Medicine, Inc. |
| Sector: Health Care | |
| SubSector: Biotechnology | |
| MarketCap: 1194.95 Millions | |
| Recent Price: 5.58 Smart Investing & Trading Score: 57 | |
| Day Percent Change: -1.59% Day Change: -0.09 | |
| Week Change: -1.59% Year-to-date Change: -44.9% | |
| EDIT Links: Profile News Message Board | |
| Charts:- Daily , Weekly | |
| Add EDIT to Watchlist: View: Get Complete EDIT Trend Analysis ➞ | |
 | TNYA Tenaya Therapeutics, Inc. |
| Sector: Health Care | |
| SubSector: Biotechnology | |
| MarketCap: 395 Millions | |
| Recent Price: 4.63 Smart Investing & Trading Score: 37 | |
| Day Percent Change: -1.59% Day Change: -0.08 | |
| Week Change: -1.59% Year-to-date Change: 45.8% | |
| TNYA Links: Profile News Message Board | |
| Charts:- Daily , Weekly | |
| Add TNYA to Watchlist: View: Get Complete TNYA Trend Analysis ➞ | |
 | TGTX TG Therapeutics, Inc. |
| Sector: Health Care | |
| SubSector: Biotechnology | |
| MarketCap: 1022.85 Millions | |
| Recent Price: 15.93 Smart Investing & Trading Score: 55 | |
| Day Percent Change: -1.61% Day Change: -0.26 | |
| Week Change: -1.61% Year-to-date Change: -6.7% | |
| TGTX Links: Profile News Message Board | |
| Charts:- Daily , Weekly | |
| Add TGTX to Watchlist: View: Get Complete TGTX Trend Analysis ➞ | |
 | ORGO Organogenesis Holdings Inc. |
| Sector: Health Care | |
| SubSector: Drugs - Generic | |
| MarketCap: 239.685 Millions | |
| Recent Price: 2.45 Smart Investing & Trading Score: 20 | |
| Day Percent Change: -1.61% Day Change: -0.04 | |
| Week Change: -1.61% Year-to-date Change: -40.1% | |
| ORGO Links: Profile News Message Board | |
| Charts:- Daily , Weekly | |
| Add ORGO to Watchlist: View: Get Complete ORGO Trend Analysis ➞ | |
 | BMEA Biomea Fusion, Inc. |
| Sector: Health Care | |
| SubSector: Biotechnology | |
| MarketCap: 818 Millions | |
| Recent Price: 12.08 Smart Investing & Trading Score: 57 | |
| Day Percent Change: -1.67% Day Change: -0.21 | |
| Week Change: -1.67% Year-to-date Change: -17.5% | |
| BMEA Links: Profile News Message Board | |
| Charts:- Daily , Weekly | |
| Add BMEA to Watchlist: View: Get Complete BMEA Trend Analysis ➞ | |
 | VIR Vir Biotechnology, Inc. |
| Sector: Health Care | |
| SubSector: Biotechnology | |
| MarketCap: 3916.75 Millions | |
| Recent Price: 10.22 Smart Investing & Trading Score: 74 | |
| Day Percent Change: -1.68% Day Change: -0.18 | |
| Week Change: -1.68% Year-to-date Change: 1.5% | |
| VIR Links: Profile News Message Board | |
| Charts:- Daily , Weekly | |
| Add VIR to Watchlist: View: Get Complete VIR Trend Analysis ➞ | |
 | NUVL Nuvalent, Inc. |
| Sector: Health Care | |
| SubSector: Biotechnology | |
| MarketCap: 2400 Millions | |
| Recent Price: 69.63 Smart Investing & Trading Score: 25 | |
| Day Percent Change: -1.68% Day Change: -1.19 | |
| Week Change: -1.68% Year-to-date Change: -5.3% | |
| NUVL Links: Profile News Message Board | |
| Charts:- Daily , Weekly | |
| Add NUVL to Watchlist: View: Get Complete NUVL Trend Analysis ➞ | |
 | AXGN AxoGen, Inc. |
| Sector: Health Care | |
| SubSector: Medical Appliances & Equipment | |
| MarketCap: 349.28 Millions | |
| Recent Price: 5.69 Smart Investing & Trading Score: 0 | |
| Day Percent Change: -1.73% Day Change: -0.10 | |
| Week Change: -1.73% Year-to-date Change: -16.7% | |
| AXGN Links: Profile News Message Board | |
| Charts:- Daily , Weekly | |
| Add AXGN to Watchlist: View: Get Complete AXGN Trend Analysis ➞ | |
 | CYH Community Health Systems, Inc. |
| Sector: Health Care | |
| SubSector: Hospitals | |
| MarketCap: 371.546 Millions | |
| Recent Price: 3.36 Smart Investing & Trading Score: 75 | |
| Day Percent Change: -1.75% Day Change: -0.06 | |
| Week Change: -1.75% Year-to-date Change: 7.4% | |
| CYH Links: Profile News Message Board | |
| Charts:- Daily , Weekly | |
| Add CYH to Watchlist: View: Get Complete CYH Trend Analysis ➞ | |
 | RCKT Rocket Pharmaceuticals, Inc. |
| Sector: Health Care | |
| SubSector: Biotechnology | |
| MarketCap: 899.585 Millions | |
| Recent Price: 23.06 Smart Investing & Trading Score: 50 | |
| Day Percent Change: -1.75% Day Change: -0.41 | |
| Week Change: -1.75% Year-to-date Change: -23.1% | |
| RCKT Links: Profile News Message Board | |
| Charts:- Daily , Weekly | |
| Add RCKT to Watchlist: View: Get Complete RCKT Trend Analysis ➞ | |
 | ARCT Arcturus Therapeutics Holdings Inc. |
| Sector: Health Care | |
| SubSector: Biotechnology | |
| MarketCap: 241.385 Millions | |
| Recent Price: 26.79 Smart Investing & Trading Score: 42 | |
| Day Percent Change: -1.76% Day Change: -0.48 | |
| Week Change: -1.76% Year-to-date Change: -15.0% | |
| ARCT Links: Profile News Message Board | |
| Charts:- Daily , Weekly | |
| Add ARCT to Watchlist: View: Get Complete ARCT Trend Analysis ➞ | |
 | SUPN Supernus Pharmaceuticals, Inc. |
| Sector: Health Care | |
| SubSector: Drugs - Generic | |
| MarketCap: 833.585 Millions | |
| Recent Price: 30.28 Smart Investing & Trading Score: 78 | |
| Day Percent Change: -1.78% Day Change: -0.55 | |
| Week Change: -1.78% Year-to-date Change: 4.6% | |
| SUPN Links: Profile News Message Board | |
| Charts:- Daily , Weekly | |
| Add SUPN to Watchlist: View: Get Complete SUPN Trend Analysis ➞ | |
| For tabular summary view of above stock list: Summary View ➞ 0 - 25 , 25 - 50 , 50 - 75 , 75 - 100 , 100 - 125 , 125 - 150 , 150 - 175 , 175 - 200 , 200 - 225 , 225 - 250 , 250 - 275 , 275 - 300 , 300 - 325 , 325 - 350 | ||
| Click To Change The Sort Order: By Market Cap or Company Size Performance: Year-to-date, Week and Day | |
| Select Chart Type: | ||
| Too many stocks? View smallcap stocks filtered by marketcap & sector |
| Marketcap: All SmallCap Stocks (default-no microcap), Large, Mid-Range, Small & MicroCap |
| Sector: Tech, Finance, Energy, Staples, Retail, Industrial, Materials, Utilities & Medical |
|
Best Stocks Today 12Stocks.com |
© 2024 12Stocks.com Terms & Conditions Privacy Contact Us
All Information Provided Only For Education And Not To Be Used For Investing or Trading. See Terms & Conditions


One More Thing ... Get Best Stocks Delivered Daily!
Never Ever Miss A Move With Our Top Ten Stocks Lists
Find Best Stocks In Any Market - Bull or Bear Market
Take A Peek At Our Top Ten Stocks Lists: Daily, Weekly, Year-to-Date & Top Trends
Find Best Stocks In Any Market - Bull or Bear Market
Take A Peek At Our Top Ten Stocks Lists: Daily, Weekly, Year-to-Date & Top Trends
Smallcap Stocks With Best Up Trends [0-bearish to 100-bullish]: Perficient [100], Outset Medical[100], Emergent BioSolutions[100], Dakota Gold[100], Twist Bioscience[100], TPI Composites[100], biote [100], Willdan Group[100], IES [100], Wolverine World[100], PMV [100]
Best Smallcap Stocks Year-to-Date:
Janux [456.49%], Longboard [243.86%], Alpine Immune[239.13%], Bakkt [200.9%], Avidity Biosciences[185.12%], Super Micro[183.18%], Vera [177.45%], Cullinan Oncology[170.38%], Y-mAbs [148.97%], Sana [146.43%], Arcutis Bio[140.71%] Best Smallcap Stocks This Week:
Perficient [52.9%], Outset Medical[36.58%], BioCryst [18.43%], P3 Health[18.33%], Pacific Biosciences[15.57%], Emergent BioSolutions[13.11%], SelectQuote [12.25%], ThredUp [12.24%], Genelux [12.13%], Virgin Galactic[11.81%], Nuvectis Pharma[11.79%] Best Smallcap Stocks Daily:
Perficient [52.90%], Outset Medical[36.58%], BioCryst [18.43%], P3 Health[18.33%], Pacific Biosciences[15.57%], Emergent BioSolutions[13.11%], SelectQuote [12.25%], ThredUp [12.24%], Genelux [12.13%], Virgin Galactic[11.81%], Nuvectis Pharma[11.79%]