
 Login Sign Up


| |||||
 |  | ||||

| 12Stocks.com Market Intelligence |
Best SmallCap Stocks
|
| In a hurry? Small Cap Stock Lists: Performance Trends Table, Stock Charts
Sort Small Cap stocks: Daily, Weekly, Year-to-Date, Market Cap & Trends. Filter Small Cap stocks list by sector: Show all, Tech, Finance, Energy, Staples, Retail, Industrial, Materials, Utilities and HealthCare Filter Small Cap stocks list by size: All Large Medium Small and MicroCap |
| 12Stocks.com Small Cap Stocks Performances & Trends Daily | |||||||||
|
|  The overall Smart Investing & Trading Score is 69 (0-bearish to 100-bullish) which puts Small Cap index in short term neutral to bullish trend. The Smart Investing & Trading Score from previous trading session is 49 and hence an improvement of trend.
| ||||||||
Here are the Smart Investing & Trading Scores of the most requested small cap stocks at 12Stocks.com (click stock name for detailed review):
|


| 12Stocks.com: Investing in Smallcap Index with Stocks | |
|
The following table helps investors and traders sort through current performance and trends (as measured by Smart Investing & Trading Score) of various
stocks in the Smallcap Index. Quick View: Move mouse or cursor over stock symbol (ticker) to view short-term technical chart and over stock name to view long term chart. Click on  to add stock symbol to your watchlist and to add stock symbol to your watchlist and  to view watchlist. Click on any ticker or stock name for detailed market intelligence report for that stock. to view watchlist. Click on any ticker or stock name for detailed market intelligence report for that stock. |
12Stocks.com Performance of Stocks in Smallcap Index
| Ticker | Stock Name | Watchlist | Category | Recent Price | Smart Investing & Trading Score | Change % | YTD Change% |
| GKOS | Glaukos |   | Health Care | 110.15 | 100 | 3.42 | 38.57% |
| CABA | Cabaletta Bio | | Health Care | 12.80 | 42 | 3.31 | -43.61% |
| IRTC | iRhythm | | Health Care | 105.97 | 0 | 3.20 | -1.00% |
| LNTH | Lantheus | | Health Care | 77.92 | 100 | 3.16 | 25.68% |
| AHCO | AdaptHealth | | Health Care | 10.57 | 70 | 3.02 | 44.99% |
| OSCR | Oscar Health | | Health Care | 18.52 | 85 | 3.00 | 103.40% |
| CRBU | Caribou Biosciences | | Health Care | 3.81 | 42 | 2.97 | -33.19% |
| AKRO | Akero | | Health Care | 20.24 | 20 | 2.95 | -13.32% |
| IOVA | Iovance Bio | | Health Care | 14.03 | 69 | 2.90 | 72.51% |
| ZURA | Zura Bio | | Health Care | 4.64 | 95 | 2.88 | -0.96% |
| CARA | Cara | | Health Care | 0.80 | 59 | 2.80 | 7.67% |
| AVAH | Aveanna Healthcare | | Health Care | 2.33 | 42 | 2.64 | -13.54% |
| SVRA | Savara | | Health Care | 4.83 | 49 | 2.55 | 2.66% |
| FLGT | Fulgent Genetics | | Health Care | 22.03 | 74 | 2.47 | -23.80% |
| ALXO | ALX Oncology | | Health Care | 15.74 | 63 | 2.47 | 5.78% |
| WRBY | Warby Parker | | Health Care | 12.83 | 37 | 2.31 | -9.04% |
| FGEN | FibroGen | | Health Care | 1.17 | 35 | 2.19 | 31.45% |
| BMEA | Biomea Fusion | | Health Care | 12.55 | 49 | 2.16 | -14.28% |
| STRO | Sutro Biopharma | | Health Care | 3.91 | 39 | 2.09 | -8.86% |
| SILK | Silk Road | | Health Care | 20.70 | 100 | 2.05 | 68.66% |
| HALO | Halozyme | | Health Care | 40.67 | 82 | 1.90 | 10.04% |
| NATR | Nature s | | Health Care | 19.42 | 34 | 1.89 | 12.32% |
| TMCI | Treace Medical | | Health Care | 11.05 | 42 | 1.84 | -13.27% |
| MNKD | MannKind | | Health Care | 4.47 | 90 | 1.82 | 22.80% |
| INMD | InMode | | Health Care | 17.96 | 59 | 1.81 | -19.24% |
| For chart view version of above stock list: Chart View ➞ 0 - 25 , 25 - 50 , 50 - 75 , 75 - 100 , 100 - 125 , 125 - 150 , 150 - 175 , 175 - 200 , 200 - 225 , 225 - 250 , 250 - 275 , 275 - 300 , 300 - 325 | ||
 | Click To Change The Sort Order: By Market Cap or Company Size Performance: Year-to-date, Week and Day |  |
| Too many stocks? View smallcap stocks filtered by marketcap & sector |
| Marketcap: All SmallCap Stocks (default-no microcap), Large, Mid-Range, Small |
| Smallcap Sector: Tech, Finance, Energy, Staples, Retail, Industrial, Materials, & Medical |
|
Get the most comprehensive stock market coverage daily at 12Stocks.com ➞ Best Stocks Today ➞ Best Stocks Weekly ➞ Best Stocks Year-to-Date ➞ Best Stocks Trends ➞  Best Stocks Today 12Stocks.com Best Nasdaq Stocks ➞ Best S&P 500 Stocks ➞ Best Tech Stocks ➞ Best Biotech Stocks ➞ |
| Detailed Overview of SmallCap Stocks |
| SmallCap Technical Overview, Leaders & Laggards, Top SmallCap ETF Funds & Detailed SmallCap Stocks List, Charts, Trends & More |
| Smallcap: Technical Analysis, Trends & YTD Performance | |
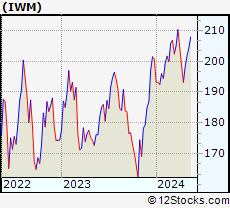
| SmallCap segment as represented by
IWM, an exchange-traded fund [ETF], holds basket of thousands of smallcap stocks from across all major sectors of the US stock market. The smallcap index (contains stocks like Riverbed & Sotheby's) is up by 1.89% and is currently underperforming the overall market by -5.64% year-to-date. Below is a quick view of technical charts and trends: | |
 IWM Weekly Chart |
|
| Long Term Trend: Not Good | |
| Medium Term Trend: Very Good | |
 IWM Daily Chart |
|
| Short Term Trend: Very Good | |
| Overall Trend Score: 69 | |
| YTD Performance: 1.89% | |
| **Trend Scores & Views Are Only For Educational Purposes And Not For Investing | |
| 12Stocks.com: Top Performing Small Cap Index Stocks | ||||||||||||||||||||||||||||||||||||||||||||||||
 The top performing Small Cap Index stocks year to date are
Now, more recently, over last week, the top performing Small Cap Index stocks on the move are


|
||||||||||||||||||||||||||||||||||||||||||||||||
| 12Stocks.com: Investing in Smallcap Index using Exchange Traded Funds | |
|
The following table shows list of key exchange traded funds (ETF) that
help investors track Smallcap index. The following list also includes leveraged ETF funds that track twice or thrice the daily returns of Smallcap indices. Short or inverse ETF funds move in the opposite direction to the index they track and are useful during market pullbacks or during bear markets. Quick View: Move mouse or cursor over ETF symbol (ticker) to view short-term technical chart and over ETF name to view long term chart. Click on ticker or stock name for detailed view. Click on to add stock symbol to your watchlist and to view watchlist. |
12Stocks.com List of ETFs that track Smallcap Index
| Ticker | ETF Name | Watchlist | Recent Price | Smart Investing & Trading Score | Change % | Week % | Year-to-date % |
| IWM | iShares Russell 2000 | | 204.51 | 69 | 1.29 | 1.29 | 1.89% |
| VTWO | Vanguard Russell 2000 ETF | | 82.61 | 69 | 1.23 | 1.23 | 1.86% |
| IJT | iShares S&P Small-Cap 600 Growth | | 128.77 | 95 | 0.79 | 0.79 | 2.9% |
| IJS | iShares S&P Small-Cap 600 Value | | 99.56 | 64 | 0.86 | 0.86 | -3.4% |
| SDD | ProShares UltraShort SmallCap600 | | 18.48 | 23 | -1.94 | -1.94 | 0.29% |
| XSLV | PowerShares S&P SmallCap Low Volatil ETF | | 43.48 | 87 | 0.60 | 0.6 | -1.52% |
| SAA | ProShares Ultra SmallCap600 | | 24.00 | 69 | 1.74 | 1.74 | -3.81% |
| SBB | ProShares Short SmallCap600 | | 16.05 | 13 | -0.68 | -0.68 | 0.75% |
| SMLV | SPDR SSGA US Small Cap Low Volatil ETF | | 109.69 | 87 | 0.00 | 0 | -2.52% |
| 12Stocks.com: Charts, Trends, Fundamental Data and Performances of SmallCap Stocks | |
|
We now take in-depth look at all SmallCap stocks including charts, multi-period performances and overall trends (as measured by Smart Investing & Trading Score). One can sort SmallCap stocks (click link to choose) by Daily, Weekly and by Year-to-Date performances. Also, one can sort by size of the company or by market capitalization. |
| Select Your Default Chart Type: | |||||
| |||||
| Click on stock symbol or name for detailed view. Click on to add stock symbol to your watchlist and to view watchlist. Quick View: Move mouse or cursor over "Daily" to quickly view daily technical stock chart and over "Weekly" to view weekly technical stock chart. | |||||

 | GKOS Glaukos Corporation |
| Sector: Health Care | |
| SubSector: Medical Instruments & Supplies | |
| MarketCap: 1103.6 Millions | |
| Recent Price: 110.15 Smart Investing & Trading Score: 100 | |
| Day Percent Change: 3.42% Day Change: 3.64 | |
| Week Change: 3.42% Year-to-date Change: 38.6% | |
| GKOS Links: Profile News Message Board | |
| Charts:- Daily , Weekly | |
| Add GKOS to Watchlist: View: Get Complete GKOS Trend Analysis ➞ | |
 | CABA Cabaletta Bio, Inc. |
| Sector: Health Care | |
| SubSector: Biotechnology | |
| MarketCap: 222.085 Millions | |
| Recent Price: 12.80 Smart Investing & Trading Score: 42 | |
| Day Percent Change: 3.31% Day Change: 0.41 | |
| Week Change: 3.31% Year-to-date Change: -43.6% | |
| CABA Links: Profile News Message Board | |
| Charts:- Daily , Weekly | |
| Add CABA to Watchlist: View: Get Complete CABA Trend Analysis ➞ | |
 | IRTC iRhythm Technologies, Inc. |
| Sector: Health Care | |
| SubSector: Medical Instruments & Supplies | |
| MarketCap: 2167.9 Millions | |
| Recent Price: 105.97 Smart Investing & Trading Score: 0 | |
| Day Percent Change: 3.20% Day Change: 3.28 | |
| Week Change: 3.2% Year-to-date Change: -1.0% | |
| IRTC Links: Profile News Message Board | |
| Charts:- Daily , Weekly | |
| Add IRTC to Watchlist: View: Get Complete IRTC Trend Analysis ➞ | |
 | LNTH Lantheus Holdings, Inc. |
| Sector: Health Care | |
| SubSector: Medical Appliances & Equipment | |
| MarketCap: 467.18 Millions | |
| Recent Price: 77.92 Smart Investing & Trading Score: 100 | |
| Day Percent Change: 3.16% Day Change: 2.39 | |
| Week Change: 3.16% Year-to-date Change: 25.7% | |
| LNTH Links: Profile News Message Board | |
| Charts:- Daily , Weekly | |
| Add LNTH to Watchlist: View: Get Complete LNTH Trend Analysis ➞ | |
 | AHCO AdaptHealth Corp. |
| Sector: Health Care | |
| SubSector: Medical Appliances & Equipment | |
| MarketCap: 1084.8 Millions | |
| Recent Price: 10.57 Smart Investing & Trading Score: 70 | |
| Day Percent Change: 3.02% Day Change: 0.31 | |
| Week Change: 3.02% Year-to-date Change: 45.0% | |
| AHCO Links: Profile News Message Board | |
| Charts:- Daily , Weekly | |
| Add AHCO to Watchlist: View: Get Complete AHCO Trend Analysis ➞ | |
 | OSCR Oscar Health, Inc. |
| Sector: Health Care | |
| SubSector: Healthcare Plans | |
| MarketCap: 1790 Millions | |
| Recent Price: 18.52 Smart Investing & Trading Score: 85 | |
| Day Percent Change: 3.00% Day Change: 0.54 | |
| Week Change: 3% Year-to-date Change: 103.4% | |
| OSCR Links: Profile News Message Board | |
| Charts:- Daily , Weekly | |
| Add OSCR to Watchlist: View: Get Complete OSCR Trend Analysis ➞ | |
 | CRBU Caribou Biosciences, Inc. |
| Sector: Health Care | |
| SubSector: Biotechnology | |
| MarketCap: 258 Millions | |
| Recent Price: 3.81 Smart Investing & Trading Score: 42 | |
| Day Percent Change: 2.97% Day Change: 0.11 | |
| Week Change: 2.97% Year-to-date Change: -33.2% | |
| CRBU Links: Profile News Message Board | |
| Charts:- Daily , Weekly | |
| Add CRBU to Watchlist: View: Get Complete CRBU Trend Analysis ➞ | |
 | AKRO Akero Therapeutics, Inc. |
| Sector: Health Care | |
| SubSector: Biotechnology | |
| MarketCap: 675.085 Millions | |
| Recent Price: 20.24 Smart Investing & Trading Score: 20 | |
| Day Percent Change: 2.95% Day Change: 0.58 | |
| Week Change: 2.95% Year-to-date Change: -13.3% | |
| AKRO Links: Profile News Message Board | |
| Charts:- Daily , Weekly | |
| Add AKRO to Watchlist: View: Get Complete AKRO Trend Analysis ➞ | |
 | IOVA Iovance Biotherapeutics, Inc. |
| Sector: Health Care | |
| SubSector: Biotechnology | |
| MarketCap: 3533.35 Millions | |
| Recent Price: 14.03 Smart Investing & Trading Score: 69 | |
| Day Percent Change: 2.90% Day Change: 0.39 | |
| Week Change: 2.9% Year-to-date Change: 72.5% | |
| IOVA Links: Profile News Message Board | |
| Charts:- Daily , Weekly | |
| Add IOVA to Watchlist: View: Get Complete IOVA Trend Analysis ➞ | |
 | ZURA Zura Bio Limited |
| Sector: Health Care | |
| SubSector: Biotechnology | |
| MarketCap: 242 Millions | |
| Recent Price: 4.64 Smart Investing & Trading Score: 95 | |
| Day Percent Change: 2.88% Day Change: 0.13 | |
| Week Change: 2.88% Year-to-date Change: -1.0% | |
| ZURA Links: Profile News Message Board | |
| Charts:- Daily , Weekly | |
| Add ZURA to Watchlist: View: Get Complete ZURA Trend Analysis ➞ | |
 | CARA Cara Therapeutics, Inc. |
| Sector: Health Care | |
| SubSector: Biotechnology | |
| MarketCap: 597.985 Millions | |
| Recent Price: 0.80 Smart Investing & Trading Score: 59 | |
| Day Percent Change: 2.80% Day Change: 0.02 | |
| Week Change: 2.8% Year-to-date Change: 7.7% | |
| CARA Links: Profile News Message Board | |
| Charts:- Daily , Weekly | |
| Add CARA to Watchlist: View: Get Complete CARA Trend Analysis ➞ | |
 | AVAH Aveanna Healthcare Holdings Inc. |
| Sector: Health Care | |
| SubSector: Medical Care Facilities | |
| MarketCap: 305 Millions | |
| Recent Price: 2.33 Smart Investing & Trading Score: 42 | |
| Day Percent Change: 2.64% Day Change: 0.06 | |
| Week Change: 2.64% Year-to-date Change: -13.5% | |
| AVAH Links: Profile News Message Board | |
| Charts:- Daily , Weekly | |
| Add AVAH to Watchlist: View: Get Complete AVAH Trend Analysis ➞ | |
 | SVRA Savara Inc. |
| Sector: Health Care | |
| SubSector: Biotechnology | |
| MarketCap: 80.3785 Millions | |
| Recent Price: 4.83 Smart Investing & Trading Score: 49 | |
| Day Percent Change: 2.55% Day Change: 0.12 | |
| Week Change: 2.55% Year-to-date Change: 2.7% | |
| SVRA Links: Profile News Message Board | |
| Charts:- Daily , Weekly | |
| Add SVRA to Watchlist: View: Get Complete SVRA Trend Analysis ➞ | |
 | FLGT Fulgent Genetics, Inc. |
| Sector: Health Care | |
| SubSector: Medical Laboratories & Research | |
| MarketCap: 222.2 Millions | |
| Recent Price: 22.03 Smart Investing & Trading Score: 74 | |
| Day Percent Change: 2.47% Day Change: 0.53 | |
| Week Change: 2.47% Year-to-date Change: -23.8% | |
| FLGT Links: Profile News Message Board | |
| Charts:- Daily , Weekly | |
| Add FLGT to Watchlist: View: Get Complete FLGT Trend Analysis ➞ | |
 | ALXO ALX Oncology Holdings Inc. |
| Sector: Health Care | |
| SubSector: Biotechnology | |
| MarketCap: 41787 Millions | |
| Recent Price: 15.74 Smart Investing & Trading Score: 63 | |
| Day Percent Change: 2.47% Day Change: 0.38 | |
| Week Change: 2.47% Year-to-date Change: 5.8% | |
| ALXO Links: Profile News Message Board | |
| Charts:- Daily , Weekly | |
| Add ALXO to Watchlist: View: Get Complete ALXO Trend Analysis ➞ | |
 | WRBY Warby Parker Inc. |
| Sector: Health Care | |
| SubSector: Medical Instruments & Supplies | |
| MarketCap: 1380 Millions | |
| Recent Price: 12.83 Smart Investing & Trading Score: 37 | |
| Day Percent Change: 2.31% Day Change: 0.29 | |
| Week Change: 2.31% Year-to-date Change: -9.0% | |
| WRBY Links: Profile News Message Board | |
| Charts:- Daily , Weekly | |
| Add WRBY to Watchlist: View: Get Complete WRBY Trend Analysis ➞ | |
 | FGEN FibroGen, Inc. |
| Sector: Health Care | |
| SubSector: Biotechnology | |
| MarketCap: 2502.95 Millions | |
| Recent Price: 1.17 Smart Investing & Trading Score: 35 | |
| Day Percent Change: 2.19% Day Change: 0.03 | |
| Week Change: 2.19% Year-to-date Change: 31.5% | |
| FGEN Links: Profile News Message Board | |
| Charts:- Daily , Weekly | |
| Add FGEN to Watchlist: View: Get Complete FGEN Trend Analysis ➞ | |
 | BMEA Biomea Fusion, Inc. |
| Sector: Health Care | |
| SubSector: Biotechnology | |
| MarketCap: 818 Millions | |
| Recent Price: 12.55 Smart Investing & Trading Score: 49 | |
| Day Percent Change: 2.16% Day Change: 0.27 | |
| Week Change: 2.16% Year-to-date Change: -14.3% | |
| BMEA Links: Profile News Message Board | |
| Charts:- Daily , Weekly | |
| Add BMEA to Watchlist: View: Get Complete BMEA Trend Analysis ➞ | |
 | STRO Sutro Biopharma, Inc. |
| Sector: Health Care | |
| SubSector: Biotechnology | |
| MarketCap: 196.485 Millions | |
| Recent Price: 3.91 Smart Investing & Trading Score: 39 | |
| Day Percent Change: 2.09% Day Change: 0.08 | |
| Week Change: 2.09% Year-to-date Change: -8.9% | |
| STRO Links: Profile News Message Board | |
| Charts:- Daily , Weekly | |
| Add STRO to Watchlist: View: Get Complete STRO Trend Analysis ➞ | |
 | SILK Silk Road Medical, Inc |
| Sector: Health Care | |
| SubSector: Medical Appliances & Equipment | |
| MarketCap: 881.78 Millions | |
| Recent Price: 20.70 Smart Investing & Trading Score: 100 | |
| Day Percent Change: 2.05% Day Change: 0.41 | |
| Week Change: 2.05% Year-to-date Change: 68.7% | |
| SILK Links: Profile News Message Board | |
| Charts:- Daily , Weekly | |
| Add SILK to Watchlist: View: Get Complete SILK Trend Analysis ➞ | |
 | HALO Halozyme Therapeutics, Inc. |
| Sector: Health Care | |
| SubSector: Biotechnology | |
| MarketCap: 2383.75 Millions | |
| Recent Price: 40.67 Smart Investing & Trading Score: 82 | |
| Day Percent Change: 1.90% Day Change: 0.76 | |
| Week Change: 1.9% Year-to-date Change: 10.0% | |
| HALO Links: Profile News Message Board | |
| Charts:- Daily , Weekly | |
| Add HALO to Watchlist: View: Get Complete HALO Trend Analysis ➞ | |
 | NATR Nature s Sunshine Products, Inc. |
| Sector: Health Care | |
| SubSector: Drugs - Generic | |
| MarketCap: 153.285 Millions | |
| Recent Price: 19.42 Smart Investing & Trading Score: 34 | |
| Day Percent Change: 1.89% Day Change: 0.36 | |
| Week Change: 1.89% Year-to-date Change: 12.3% | |
| NATR Links: Profile News Message Board | |
| Charts:- Daily , Weekly | |
| Add NATR to Watchlist: View: Get Complete NATR Trend Analysis ➞ | |
 | TMCI Treace Medical Concepts, Inc. |
| Sector: Health Care | |
| SubSector: Medical Devices | |
| MarketCap: 1550 Millions | |
| Recent Price: 11.05 Smart Investing & Trading Score: 42 | |
| Day Percent Change: 1.84% Day Change: 0.20 | |
| Week Change: 1.84% Year-to-date Change: -13.3% | |
| TMCI Links: Profile News Message Board | |
| Charts:- Daily , Weekly | |
| Add TMCI to Watchlist: View: Get Complete TMCI Trend Analysis ➞ | |
 | MNKD MannKind Corporation |
| Sector: Health Care | |
| SubSector: Biotechnology | |
| MarketCap: 250.885 Millions | |
| Recent Price: 4.47 Smart Investing & Trading Score: 90 | |
| Day Percent Change: 1.82% Day Change: 0.08 | |
| Week Change: 1.82% Year-to-date Change: 22.8% | |
| MNKD Links: Profile News Message Board | |
| Charts:- Daily , Weekly | |
| Add MNKD to Watchlist: View: Get Complete MNKD Trend Analysis ➞ | |
 | INMD InMode Ltd. |
| Sector: Health Care | |
| SubSector: Medical Appliances & Equipment | |
| MarketCap: 689.08 Millions | |
| Recent Price: 17.96 Smart Investing & Trading Score: 59 | |
| Day Percent Change: 1.81% Day Change: 0.32 | |
| Week Change: 1.81% Year-to-date Change: -19.2% | |
| INMD Links: Profile News Message Board | |
| Charts:- Daily , Weekly | |
| Add INMD to Watchlist: View: Get Complete INMD Trend Analysis ➞ | |
| For tabular summary view of above stock list: Summary View ➞ 0 - 25 , 25 - 50 , 50 - 75 , 75 - 100 , 100 - 125 , 125 - 150 , 150 - 175 , 175 - 200 , 200 - 225 , 225 - 250 , 250 - 275 , 275 - 300 , 300 - 325 | ||
| Click To Change The Sort Order: By Market Cap or Company Size Performance: Year-to-date, Week and Day | |
| Select Chart Type: | ||
| Too many stocks? View smallcap stocks filtered by marketcap & sector |
| Marketcap: All SmallCap Stocks (default-no microcap), Large, Mid-Range, Small & MicroCap |
| Sector: Tech, Finance, Energy, Staples, Retail, Industrial, Materials, Utilities & Medical |
|
Best Stocks Today 12Stocks.com |
© 2024 12Stocks.com Terms & Conditions Privacy Contact Us
All Information Provided Only For Education And Not To Be Used For Investing or Trading. See Terms & Conditions


One More Thing ... Get Best Stocks Delivered Daily!
Never Ever Miss A Move With Our Top Ten Stocks Lists
Find Best Stocks In Any Market - Bull or Bear Market
Take A Peek At Our Top Ten Stocks Lists: Daily, Weekly, Year-to-Date & Top Trends
Find Best Stocks In Any Market - Bull or Bear Market
Take A Peek At Our Top Ten Stocks Lists: Daily, Weekly, Year-to-Date & Top Trends
Smallcap Stocks With Best Up Trends [0-bearish to 100-bullish]: Emergent BioSolutions[100], Twist Bioscience[100], TPI Composites[100], SIGA [100], Riot Blockchain[100], RxSight [100], Carvana Co[100], Regional Management[100], PMV [100], El Pollo[100], Glaukos [100]
Best Smallcap Stocks Year-to-Date:
CareMax [582.47%], Janux [454.21%], Longboard [245.01%], Alpine Immune[239.26%], Bakkt [191.03%], Avidity Biosciences[187.56%], Super Micro[185.73%], Vera [177.16%], Cullinan Oncology[172.09%], Sana [150.91%], Y-mAbs [148.39%] Best Smallcap Stocks This Week:
Perficient [52.71%], Outset Medical[32.27%], Nuvectis Pharma[20.19%], P3 Health[19.19%], BioCryst [18.88%], ThredUp [15.74%], OptiNose [14.85%], SoundHound AI[12.87%], Benson Hill[11.89%], Virgin Galactic[11.81%], Vigil Neuroscience[11.76%] Best Smallcap Stocks Daily:
Perficient [52.71%], Outset Medical[32.27%], Nuvectis Pharma[20.19%], P3 Health[19.19%], BioCryst [18.88%], ThredUp [15.74%], OptiNose [14.85%], SoundHound AI[12.87%], Benson Hill[11.89%], Virgin Galactic[11.81%], Vigil Neuroscience[11.76%]