
 Login Sign Up


| |||||
 |  | ||||

| 12Stocks.com Market Intelligence |
Best SmallCap Stocks
|
| In a hurry? Small Cap Stock Lists: Performance Trends Table, Stock Charts
Sort Small Cap stocks: Daily, Weekly, Year-to-Date, Market Cap & Trends. Filter Small Cap stocks list by sector: Show all, Tech, Finance, Energy, Staples, Retail, Industrial, Materials, Utilities and HealthCare Filter Small Cap stocks list by size: All Large Medium Small and MicroCap |
| 12Stocks.com Small Cap Stocks Performances & Trends Daily | |||||||||
|
|  The overall Smart Investing & Trading Score is 82 (0-bearish to 100-bullish) which puts Small Cap index in short term bullish trend. The Smart Investing & Trading Score from previous trading session is 69 and hence an improvement of trend.
| ||||||||
Here are the Smart Investing & Trading Scores of the most requested small cap stocks at 12Stocks.com (click stock name for detailed review):
|


| 12Stocks.com: Investing in Smallcap Index with Stocks | |
|
The following table helps investors and traders sort through current performance and trends (as measured by Smart Investing & Trading Score) of various
stocks in the Smallcap Index. Quick View: Move mouse or cursor over stock symbol (ticker) to view short-term technical chart and over stock name to view long term chart. Click on  to add stock symbol to your watchlist and to add stock symbol to your watchlist and  to view watchlist. Click on any ticker or stock name for detailed market intelligence report for that stock. to view watchlist. Click on any ticker or stock name for detailed market intelligence report for that stock. |
12Stocks.com Performance of Stocks in Smallcap Index
| Ticker | Stock Name | Watchlist | Category | Recent Price | Smart Investing & Trading Score | Change % | YTD Change% |
| VRCA | Verrica |   | Health Care | 7.33 | 95 | 0.96 | 0.14% |
| NRC | National Research | | Health Care | 35.20 | 64 | 0.95 | -11.02% |
| STAA | STAAR Surgical | | Health Care | 45.94 | 76 | 0.94 | 47.20% |
| XNCR | Xencor | | Health Care | 24.33 | 81 | 0.91 | 14.60% |
| BBIO | BridgeBio Pharma | | Health Care | 28.08 | 64 | 0.90 | -30.44% |
| AVIR | Atea | | Health Care | 4.00 | 54 | 0.88 | 30.98% |
| ALLK | Allakos | | Health Care | 1.17 | 62 | 0.86 | -57.14% |
| REPL | Replimune Group | | Health Care | 7.01 | 74 | 0.86 | -16.84% |
| OPK | OPKO Health | | Health Care | 1.31 | 95 | 0.77 | -13.25% |
| THRD | Third Harmonic | | Health Care | 11.77 | 100 | 0.77 | 6.85% |
| PNTG | Pennant Group | | Health Care | 21.57 | 95 | 0.77 | 54.92% |
| CELC | Celcuity | | Health Care | 17.80 | 73 | 0.71 | 21.38% |
| YMAB | Y-mAbs | | Health Care | 17.27 | 83 | 0.70 | 153.23% |
| CRMD | CorMedix | | Health Care | 5.88 | 60 | 0.68 | 56.38% |
| EOLS | Evolus | | Health Care | 13.39 | 69 | 0.68 | 27.16% |
| BLFS | BioLife Solutions | | Health Care | 18.15 | 51 | 0.67 | 11.69% |
| CGEM | Cullinan Oncology | | Health Care | 28.42 | 75 | 0.67 | 178.76% |
| DYN | Dyne | | Health Care | 26.25 | 27 | 0.65 | 97.37% |
| NNOX | Nano X | | Health Care | 9.40 | 57 | 0.59 | 47.57% |
| MMSI | Merit Medical | | Health Care | 79.42 | 100 | 0.57 | 4.56% |
| AMPH | Amphastar | | Health Care | 42.68 | 59 | 0.52 | -30.99% |
| RLAY | Relay | | Health Care | 7.05 | 74 | 0.43 | -35.91% |
| NTLA | Intellia | | Health Care | 23.70 | 74 | 0.42 | -22.27% |
| AXNX | Axonics Modulation | | Health Care | 67.56 | 44 | 0.42 | 8.57% |
| ITGR | Integer | | Health Care | 111.73 | 58 | 0.41 | 12.77% |
| For chart view version of above stock list: Chart View ➞ 0 - 25 , 25 - 50 , 50 - 75 , 75 - 100 , 100 - 125 , 125 - 150 , 150 - 175 , 175 - 200 , 200 - 225 , 225 - 250 , 250 - 275 , 275 - 300 , 300 - 325 , 325 - 350 | ||
 | Click To Change The Sort Order: By Market Cap or Company Size Performance: Year-to-date, Week and Day |  |
| Too many stocks? View smallcap stocks filtered by marketcap & sector |
| Marketcap: All SmallCap Stocks (default-no microcap), Large, Mid-Range, Small |
| Smallcap Sector: Tech, Finance, Energy, Staples, Retail, Industrial, Materials, & Medical |
|
Get the most comprehensive stock market coverage daily at 12Stocks.com ➞ Best Stocks Today ➞ Best Stocks Weekly ➞ Best Stocks Year-to-Date ➞ Best Stocks Trends ➞  Best Stocks Today 12Stocks.com Best Nasdaq Stocks ➞ Best S&P 500 Stocks ➞ Best Tech Stocks ➞ Best Biotech Stocks ➞ |
| Detailed Overview of SmallCap Stocks |
| SmallCap Technical Overview, Leaders & Laggards, Top SmallCap ETF Funds & Detailed SmallCap Stocks List, Charts, Trends & More |
| Smallcap: Technical Analysis, Trends & YTD Performance | |
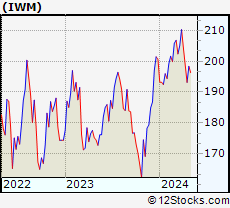
| SmallCap segment as represented by
IWM, an exchange-traded fund [ETF], holds basket of thousands of smallcap stocks from across all major sectors of the US stock market. The smallcap index (contains stocks like Riverbed & Sotheby's) is up by 1.89% and is currently underperforming the overall market by -6.13% year-to-date. Below is a quick view of technical charts and trends: | |
 IWM Weekly Chart |
|
| Long Term Trend: Very Good | |
| Medium Term Trend: Very Good | |
 IWM Daily Chart |
|
| Short Term Trend: Very Good | |
| Overall Trend Score: 82 | |
| YTD Performance: 1.89% | |
| **Trend Scores & Views Are Only For Educational Purposes And Not For Investing | |
| 12Stocks.com: Top Performing Small Cap Index Stocks | ||||||||||||||||||||||||||||||||||||||||||||||||
 The top performing Small Cap Index stocks year to date are
Now, more recently, over last week, the top performing Small Cap Index stocks on the move are


|
||||||||||||||||||||||||||||||||||||||||||||||||
| 12Stocks.com: Investing in Smallcap Index using Exchange Traded Funds | |
|
The following table shows list of key exchange traded funds (ETF) that
help investors track Smallcap index. The following list also includes leveraged ETF funds that track twice or thrice the daily returns of Smallcap indices. Short or inverse ETF funds move in the opposite direction to the index they track and are useful during market pullbacks or during bear markets. Quick View: Move mouse or cursor over ETF symbol (ticker) to view short-term technical chart and over ETF name to view long term chart. Click on ticker or stock name for detailed view. Click on to add stock symbol to your watchlist and to view watchlist. |
12Stocks.com List of ETFs that track Smallcap Index
| Ticker | ETF Name | Watchlist | Recent Price | Smart Investing & Trading Score | Change % | Week % | Year-to-date % |
| IWM | iShares Russell 2000 | | 204.51 | 82 | 1.29 | 1.29 | 1.89% |
| IJR | iShares Core S&P Small-Cap | | 108.26 | 47 | 1.05 | 1.05 | 0.01% |
| VTWO | Vanguard Russell 2000 ETF | | 82.59 | 82 | 1.20 | 1.2 | 1.84% |
| IWN | iShares Russell 2000 Value | | 155.65 | 65 | 0.93 | 0.93 | 0.21% |
| IWO | iShares Russell 2000 Growth | | 261.01 | 29 | 1.61 | 1.61 | 3.49% |
| IJS | iShares S&P Small-Cap 600 Value | | 99.75 | 69 | 1.04 | 1.04 | -3.22% |
| IJT | iShares S&P Small-Cap 600 Growth | | 129.04 | 95 | 1.00 | 1 | 3.12% |
| XSLV | PowerShares S&P SmallCap Low Volatil ETF | | 43.52 | 87 | 0.69 | 0.69 | -1.43% |
| SAA | ProShares Ultra SmallCap600 | | 24.10 | 82 | 2.16 | 2.16 | -3.41% |
| SDD | ProShares UltraShort SmallCap600 | | 18.42 | 10 | -2.26 | -2.26 | -0.04% |
| SBB | ProShares Short SmallCap600 | | 16.05 | 13 | -0.67 | -0.67 | 0.76% |
| SMLV | SPDR SSGA US Small Cap Low Volatil ETF | | 110.59 | 87 | 0.83 | 0.83 | -1.72% |
| 12Stocks.com: Charts, Trends, Fundamental Data and Performances of SmallCap Stocks | |
|
We now take in-depth look at all SmallCap stocks including charts, multi-period performances and overall trends (as measured by Smart Investing & Trading Score). One can sort SmallCap stocks (click link to choose) by Daily, Weekly and by Year-to-Date performances. Also, one can sort by size of the company or by market capitalization. |
| Select Your Default Chart Type: | |||||
| |||||
| Click on stock symbol or name for detailed view. Click on to add stock symbol to your watchlist and to view watchlist. Quick View: Move mouse or cursor over "Daily" to quickly view daily technical stock chart and over "Weekly" to view weekly technical stock chart. | |||||

 | VRCA Verrica Pharmaceuticals Inc. |
| Sector: Health Care | |
| SubSector: Biotechnology | |
| MarketCap: 289.585 Millions | |
| Recent Price: 7.33 Smart Investing & Trading Score: 95 | |
| Day Percent Change: 0.96% Day Change: 0.07 | |
| Week Change: 0.96% Year-to-date Change: 0.1% | |
| VRCA Links: Profile News Message Board | |
| Charts:- Daily , Weekly | |
| Add VRCA to Watchlist: View: Get Complete VRCA Trend Analysis ➞ | |
 | NRC National Research Corporation |
| Sector: Health Care | |
| SubSector: Medical Laboratories & Research | |
| MarketCap: 1187.7 Millions | |
| Recent Price: 35.20 Smart Investing & Trading Score: 64 | |
| Day Percent Change: 0.95% Day Change: 0.33 | |
| Week Change: 0.95% Year-to-date Change: -11.0% | |
| NRC Links: Profile News Message Board | |
| Charts:- Daily , Weekly | |
| Add NRC to Watchlist: View: Get Complete NRC Trend Analysis ➞ | |
 | STAA STAAR Surgical Company |
| Sector: Health Care | |
| SubSector: Medical Instruments & Supplies | |
| MarketCap: 1334.6 Millions | |
| Recent Price: 45.94 Smart Investing & Trading Score: 76 | |
| Day Percent Change: 0.94% Day Change: 0.43 | |
| Week Change: 0.94% Year-to-date Change: 47.2% | |
| STAA Links: Profile News Message Board | |
| Charts:- Daily , Weekly | |
| Add STAA to Watchlist: View: Get Complete STAA Trend Analysis ➞ | |
 | XNCR Xencor, Inc. |
| Sector: Health Care | |
| SubSector: Biotechnology | |
| MarketCap: 1744.35 Millions | |
| Recent Price: 24.33 Smart Investing & Trading Score: 81 | |
| Day Percent Change: 0.91% Day Change: 0.22 | |
| Week Change: 0.91% Year-to-date Change: 14.6% | |
| XNCR Links: Profile News Message Board | |
| Charts:- Daily , Weekly | |
| Add XNCR to Watchlist: View: Get Complete XNCR Trend Analysis ➞ | |
 | BBIO BridgeBio Pharma, Inc. |
| Sector: Health Care | |
| SubSector: Biotechnology | |
| MarketCap: 3879.35 Millions | |
| Recent Price: 28.08 Smart Investing & Trading Score: 64 | |
| Day Percent Change: 0.90% Day Change: 0.25 | |
| Week Change: 0.9% Year-to-date Change: -30.4% | |
| BBIO Links: Profile News Message Board | |
| Charts:- Daily , Weekly | |
| Add BBIO to Watchlist: View: Get Complete BBIO Trend Analysis ➞ | |
 | AVIR Atea Pharmaceuticals, Inc. |
| Sector: Health Care | |
| SubSector: Biotechnology | |
| MarketCap: 22587 Millions | |
| Recent Price: 4.00 Smart Investing & Trading Score: 54 | |
| Day Percent Change: 0.88% Day Change: 0.04 | |
| Week Change: 0.88% Year-to-date Change: 31.0% | |
| AVIR Links: Profile News Message Board | |
| Charts:- Daily , Weekly | |
| Add AVIR to Watchlist: View: Get Complete AVIR Trend Analysis ➞ | |
 | ALLK Allakos Inc. |
| Sector: Health Care | |
| SubSector: Biotechnology | |
| MarketCap: 3233.55 Millions | |
| Recent Price: 1.17 Smart Investing & Trading Score: 62 | |
| Day Percent Change: 0.86% Day Change: 0.01 | |
| Week Change: 0.86% Year-to-date Change: -57.1% | |
| ALLK Links: Profile News Message Board | |
| Charts:- Daily , Weekly | |
| Add ALLK to Watchlist: View: Get Complete ALLK Trend Analysis ➞ | |
 | REPL Replimune Group, Inc. |
| Sector: Health Care | |
| SubSector: Biotechnology | |
| MarketCap: 367.885 Millions | |
| Recent Price: 7.01 Smart Investing & Trading Score: 74 | |
| Day Percent Change: 0.86% Day Change: 0.06 | |
| Week Change: 0.86% Year-to-date Change: -16.8% | |
| REPL Links: Profile News Message Board | |
| Charts:- Daily , Weekly | |
| Add REPL to Watchlist: View: Get Complete REPL Trend Analysis ➞ | |
 | OPK OPKO Health, Inc. |
| Sector: Health Care | |
| SubSector: Biotechnology | |
| MarketCap: 1116.05 Millions | |
| Recent Price: 1.31 Smart Investing & Trading Score: 95 | |
| Day Percent Change: 0.77% Day Change: 0.01 | |
| Week Change: 0.77% Year-to-date Change: -13.3% | |
| OPK Links: Profile News Message Board | |
| Charts:- Daily , Weekly | |
| Add OPK to Watchlist: View: Get Complete OPK Trend Analysis ➞ | |
 | THRD Third Harmonic Bio, Inc. |
| Sector: Health Care | |
| SubSector: Biotechnology | |
| MarketCap: 190 Millions | |
| Recent Price: 11.77 Smart Investing & Trading Score: 100 | |
| Day Percent Change: 0.77% Day Change: 0.09 | |
| Week Change: 0.77% Year-to-date Change: 6.9% | |
| THRD Links: Profile News Message Board | |
| Charts:- Daily , Weekly | |
| Add THRD to Watchlist: View: Get Complete THRD Trend Analysis ➞ | |
 | PNTG The Pennant Group, Inc. |
| Sector: Health Care | |
| SubSector: Long-Term Care Facilities | |
| MarketCap: 451.786 Millions | |
| Recent Price: 21.57 Smart Investing & Trading Score: 95 | |
| Day Percent Change: 0.77% Day Change: 0.17 | |
| Week Change: 0.77% Year-to-date Change: 54.9% | |
| PNTG Links: Profile News Message Board | |
| Charts:- Daily , Weekly | |
| Add PNTG to Watchlist: View: Get Complete PNTG Trend Analysis ➞ | |
 | CELC Celcuity Inc. |
| Sector: Health Care | |
| SubSector: Medical Laboratories & Research | |
| MarketCap: 70.53 Millions | |
| Recent Price: 17.80 Smart Investing & Trading Score: 73 | |
| Day Percent Change: 0.71% Day Change: 0.13 | |
| Week Change: 0.71% Year-to-date Change: 21.4% | |
| CELC Links: Profile News Message Board | |
| Charts:- Daily , Weekly | |
| Add CELC to Watchlist: View: Get Complete CELC Trend Analysis ➞ | |
 | YMAB Y-mAbs Therapeutics, Inc. |
| Sector: Health Care | |
| SubSector: Biotechnology | |
| MarketCap: 899.585 Millions | |
| Recent Price: 17.27 Smart Investing & Trading Score: 83 | |
| Day Percent Change: 0.70% Day Change: 0.12 | |
| Week Change: 0.7% Year-to-date Change: 153.2% | |
| YMAB Links: Profile News Message Board | |
| Charts:- Daily , Weekly | |
| Add YMAB to Watchlist: View: Get Complete YMAB Trend Analysis ➞ | |
 | CRMD CorMedix, Inc. |
| Sector: Health Care | |
| SubSector: Biotechnology | |
| MarketCap: 90.7785 Millions | |
| Recent Price: 5.88 Smart Investing & Trading Score: 60 | |
| Day Percent Change: 0.68% Day Change: 0.04 | |
| Week Change: 0.68% Year-to-date Change: 56.4% | |
| CRMD Links: Profile News Message Board | |
| Charts:- Daily , Weekly | |
| Add CRMD to Watchlist: View: Get Complete CRMD Trend Analysis ➞ | |
 | EOLS Evolus, Inc. |
| Sector: Health Care | |
| SubSector: Drugs - Generic | |
| MarketCap: 145.885 Millions | |
| Recent Price: 13.39 Smart Investing & Trading Score: 69 | |
| Day Percent Change: 0.68% Day Change: 0.09 | |
| Week Change: 0.68% Year-to-date Change: 27.2% | |
| EOLS Links: Profile News Message Board | |
| Charts:- Daily , Weekly | |
| Add EOLS to Watchlist: View: Get Complete EOLS Trend Analysis ➞ | |
 | BLFS BioLife Solutions, Inc. |
| Sector: Health Care | |
| SubSector: Medical Instruments & Supplies | |
| MarketCap: 264.36 Millions | |
| Recent Price: 18.15 Smart Investing & Trading Score: 51 | |
| Day Percent Change: 0.67% Day Change: 0.12 | |
| Week Change: 0.67% Year-to-date Change: 11.7% | |
| BLFS Links: Profile News Message Board | |
| Charts:- Daily , Weekly | |
| Add BLFS to Watchlist: View: Get Complete BLFS Trend Analysis ➞ | |
 | CGEM Cullinan Oncology, Inc. |
| Sector: Health Care | |
| SubSector: Biotechnology | |
| MarketCap: 433 Millions | |
| Recent Price: 28.42 Smart Investing & Trading Score: 75 | |
| Day Percent Change: 0.67% Day Change: 0.19 | |
| Week Change: 0.67% Year-to-date Change: 178.8% | |
| CGEM Links: Profile News Message Board | |
| Charts:- Daily , Weekly | |
| Add CGEM to Watchlist: View: Get Complete CGEM Trend Analysis ➞ | |
 | DYN Dyne Therapeutics, Inc. |
| Sector: Health Care | |
| SubSector: Biotechnology | |
| MarketCap: 88487 Millions | |
| Recent Price: 26.25 Smart Investing & Trading Score: 27 | |
| Day Percent Change: 0.65% Day Change: 0.17 | |
| Week Change: 0.65% Year-to-date Change: 97.4% | |
| DYN Links: Profile News Message Board | |
| Charts:- Daily , Weekly | |
| Add DYN to Watchlist: View: Get Complete DYN Trend Analysis ➞ | |
 | NNOX Nano X Imaging Ltd. |
| Sector: Health Care | |
| SubSector: Medical Devices | |
| MarketCap: 22587 Millions | |
| Recent Price: 9.40 Smart Investing & Trading Score: 57 | |
| Day Percent Change: 0.59% Day Change: 0.05 | |
| Week Change: 0.59% Year-to-date Change: 47.6% | |
| NNOX Links: Profile News Message Board | |
| Charts:- Daily , Weekly | |
| Add NNOX to Watchlist: View: Get Complete NNOX Trend Analysis ➞ | |
 | MMSI Merit Medical Systems, Inc. |
| Sector: Health Care | |
| SubSector: Medical Instruments & Supplies | |
| MarketCap: 1719.2 Millions | |
| Recent Price: 79.42 Smart Investing & Trading Score: 100 | |
| Day Percent Change: 0.57% Day Change: 0.45 | |
| Week Change: 0.57% Year-to-date Change: 4.6% | |
| MMSI Links: Profile News Message Board | |
| Charts:- Daily , Weekly | |
| Add MMSI to Watchlist: View: Get Complete MMSI Trend Analysis ➞ | |
 | AMPH Amphastar Pharmaceuticals, Inc. |
| Sector: Health Care | |
| SubSector: Drug Manufacturers - Other | |
| MarketCap: 655.533 Millions | |
| Recent Price: 42.68 Smart Investing & Trading Score: 59 | |
| Day Percent Change: 0.52% Day Change: 0.22 | |
| Week Change: 0.52% Year-to-date Change: -31.0% | |
| AMPH Links: Profile News Message Board | |
| Charts:- Daily , Weekly | |
| Add AMPH to Watchlist: View: Get Complete AMPH Trend Analysis ➞ | |
 | RLAY Relay Therapeutics, Inc. |
| Sector: Health Care | |
| SubSector: Biotechnology | |
| MarketCap: 45887 Millions | |
| Recent Price: 7.05 Smart Investing & Trading Score: 74 | |
| Day Percent Change: 0.43% Day Change: 0.03 | |
| Week Change: 0.43% Year-to-date Change: -35.9% | |
| RLAY Links: Profile News Message Board | |
| Charts:- Daily , Weekly | |
| Add RLAY to Watchlist: View: Get Complete RLAY Trend Analysis ➞ | |
 | NTLA Intellia Therapeutics, Inc. |
| Sector: Health Care | |
| SubSector: Biotechnology | |
| MarketCap: 707.185 Millions | |
| Recent Price: 23.70 Smart Investing & Trading Score: 74 | |
| Day Percent Change: 0.42% Day Change: 0.10 | |
| Week Change: 0.42% Year-to-date Change: -22.3% | |
| NTLA Links: Profile News Message Board | |
| Charts:- Daily , Weekly | |
| Add NTLA to Watchlist: View: Get Complete NTLA Trend Analysis ➞ | |
 | AXNX Axonics Modulation Technologies, Inc. |
| Sector: Health Care | |
| SubSector: Medical Appliances & Equipment | |
| MarketCap: 692.48 Millions | |
| Recent Price: 67.56 Smart Investing & Trading Score: 44 | |
| Day Percent Change: 0.42% Day Change: 0.28 | |
| Week Change: 0.42% Year-to-date Change: 8.6% | |
| AXNX Links: Profile News Message Board | |
| Charts:- Daily , Weekly | |
| Add AXNX to Watchlist: View: Get Complete AXNX Trend Analysis ➞ | |
 | ITGR Integer Holdings Corporation |
| Sector: Health Care | |
| SubSector: Medical Appliances & Equipment | |
| MarketCap: 1794.8 Millions | |
| Recent Price: 111.73 Smart Investing & Trading Score: 58 | |
| Day Percent Change: 0.41% Day Change: 0.46 | |
| Week Change: 0.41% Year-to-date Change: 12.8% | |
| ITGR Links: Profile News Message Board | |
| Charts:- Daily , Weekly | |
| Add ITGR to Watchlist: View: Get Complete ITGR Trend Analysis ➞ | |
| For tabular summary view of above stock list: Summary View ➞ 0 - 25 , 25 - 50 , 50 - 75 , 75 - 100 , 100 - 125 , 125 - 150 , 150 - 175 , 175 - 200 , 200 - 225 , 225 - 250 , 250 - 275 , 275 - 300 , 300 - 325 , 325 - 350 | ||
| Click To Change The Sort Order: By Market Cap or Company Size Performance: Year-to-date, Week and Day | |
| Select Chart Type: | ||
| Too many stocks? View smallcap stocks filtered by marketcap & sector |
| Marketcap: All SmallCap Stocks (default-no microcap), Large, Mid-Range, Small & MicroCap |
| Sector: Tech, Finance, Energy, Staples, Retail, Industrial, Materials, Utilities & Medical |
|
Best Stocks Today 12Stocks.com |
© 2024 12Stocks.com Terms & Conditions Privacy Contact Us
All Information Provided Only For Education And Not To Be Used For Investing or Trading. See Terms & Conditions


One More Thing ... Get Best Stocks Delivered Daily!
Never Ever Miss A Move With Our Top Ten Stocks Lists
Find Best Stocks In Any Market - Bull or Bear Market
Take A Peek At Our Top Ten Stocks Lists: Daily, Weekly, Year-to-Date & Top Trends
Find Best Stocks In Any Market - Bull or Bear Market
Take A Peek At Our Top Ten Stocks Lists: Daily, Weekly, Year-to-Date & Top Trends
Smallcap Stocks With Best Up Trends [0-bearish to 100-bullish]: Perficient [100], Outset Medical[100], Dakota Gold[100], PMV [100], Twist Bioscience[100], SilverBow Resources[100], Regional Management[100], TPI Composites[100], AeroVironment [100], Solid Power[100], Wolverine World[100]
Best Smallcap Stocks Year-to-Date:
CareMax [511.34%], Janux [479.25%], Viking [320.15%], Alpine Immune[239.29%], Longboard [237.32%], Bakkt [197.53%], Vera [194.15%], Super Micro[192.28%], Avidity Biosciences[189.6%], Cullinan Oncology[178.76%], Y-mAbs [153.23%] Best Smallcap Stocks This Week:
Perficient [52.24%], P3 Health[25.16%], Outset Medical[23%], Lineage Cell[22.64%], SoundHound AI[19.54%], DASAN Zhone[19.25%], Workhorse Group[19.13%], BioCryst [18.65%], Marathon Patent[18.09%], Aceto [17.24%], Assertio [16.99%] Best Smallcap Stocks Daily:
Perficient [52.24%], P3 Health[25.16%], Outset Medical[23.00%], Lineage Cell[22.64%], SoundHound AI[19.54%], DASAN Zhone[19.25%], Workhorse Group[19.13%], BioCryst [18.65%], Marathon Patent[18.09%], Aceto [17.24%], Assertio [16.99%]