
 Login Sign Up


| |||||
 |  | ||||

| 12Stocks.com Market Intelligence |
Best SmallCap Stocks
|
| In a hurry? Small Cap Stock Lists: Performance Trends Table, Stock Charts
Sort Small Cap stocks: Daily, Weekly, Year-to-Date, Market Cap & Trends. Filter Small Cap stocks list by sector: Show all, Tech, Finance, Energy, Staples, Retail, Industrial, Materials, Utilities and HealthCare Filter Small Cap stocks list by size: All Large Medium Small and MicroCap |
| 12Stocks.com Small Cap Stocks Performances & Trends Daily | |||||||||
|
|  The overall Smart Investing & Trading Score is 76 (0-bearish to 100-bullish) which puts Small Cap index in short term neutral to bullish trend. The Smart Investing & Trading Score from previous trading session is 90 and hence a deterioration of trend.
| ||||||||
Here are the Smart Investing & Trading Scores of the most requested small cap stocks at 12Stocks.com (click stock name for detailed review):
|


| 12Stocks.com: Investing in Smallcap Index with Stocks | |
|
The following table helps investors and traders sort through current performance and trends (as measured by Smart Investing & Trading Score) of various
stocks in the Smallcap Index. Quick View: Move mouse or cursor over stock symbol (ticker) to view short-term technical chart and over stock name to view long term chart. Click on  to add stock symbol to your watchlist and to add stock symbol to your watchlist and  to view watchlist. Click on any ticker or stock name for detailed market intelligence report for that stock. to view watchlist. Click on any ticker or stock name for detailed market intelligence report for that stock. |
12Stocks.com Performance of Stocks in Smallcap Index
| Ticker | Stock Name | Watchlist | Category | Recent Price | Smart Investing & Trading Score | Change % | YTD Change% |
| AGIO | Agios |   | Health Care | 34.34 | 76 | -1.89 | 54.20% |
| BLUE | bluebird bio | | Health Care | 1.03 | 37 | -1.90 | -25.36% |
| XERS | Xeris | | Health Care | 1.98 | 47 | -1.98 | -15.92% |
| DSGN | Design | | Health Care | 4.41 | 56 | -2.00 | 66.10% |
| VIR | Vir | | Health Care | 9.73 | 35 | -2.01 | -3.28% |
| YMAB | Y-mAbs | | Health Care | 11.60 | 10 | -2.11 | 70.09% |
| ADPT | Adaptive Bio | | Health Care | 3.65 | 42 | -2.14 | -25.51% |
| CABA | Cabaletta Bio | | Health Care | 12.35 | 57 | -2.14 | -45.59% |
| PLRX | Pliant | | Health Care | 15.27 | 62 | -2.18 | -15.73% |
| PCRX | Pacira BioSciences | | Health Care | 30.82 | 75 | -2.19 | -8.65% |
| OABI | OmniAb | | Health Care | 4.45 | 17 | -2.20 | -26.57% |
| VCYT | Veracyte | | Health Care | 22.88 | 50 | -2.22 | -16.83% |
| BKD | Brookdale Senior | | Health Care | 6.91 | 31 | -2.26 | 18.73% |
| CHRS | Coherus BioSciences | | Health Care | 2.12 | 50 | -2.30 | -36.34% |
| ITCI | Intra-Cellular Therapies | | Health Care | 65.00 | 10 | -2.30 | -9.24% |
| GERN | Geron | | Health Care | 3.81 | 76 | -2.31 | 80.57% |
| BLFS | BioLife Solutions | | Health Care | 21.96 | 68 | -2.31 | 35.14% |
| VYGR | Voyager | | Health Care | 8.43 | 66 | -2.32 | -0.12% |
| OPTN | OptiNose | | Health Care | 1.26 | 69 | -2.33 | -2.33% |
| PMVP | PMV | | Health Care | 2.10 | 63 | -2.33 | -32.26% |
| SGRY | Surgery Partners | | Health Care | 25.83 | 32 | -2.34 | -19.26% |
| ARCT | Arcturus | | Health Care | 29.78 | 45 | -2.36 | -5.55% |
| ARAY | Accuray | | Health Care | 1.63 | 35 | -2.40 | -42.40% |
| IRWD | Ironwood | | Health Care | 6.48 | 27 | -2.41 | -43.36% |
| RAPT | RAPT | | Health Care | 4.04 | 28 | -2.42 | -83.74% |
| For chart view version of above stock list: Chart View ➞ 0 - 25 , 25 - 50 , 50 - 75 , 75 - 100 , 100 - 125 , 125 - 150 , 150 - 175 , 175 - 200 , 200 - 225 , 225 - 250 , 250 - 275 , 275 - 300 , 300 - 325 , 325 - 350 | ||
 | Click To Change The Sort Order: By Market Cap or Company Size Performance: Year-to-date, Week and Day |  |
| Too many stocks? View smallcap stocks filtered by marketcap & sector |
| Marketcap: All SmallCap Stocks (default-no microcap), Large, Mid-Range, Small |
| Smallcap Sector: Tech, Finance, Energy, Staples, Retail, Industrial, Materials, & Medical |
|
Get the most comprehensive stock market coverage daily at 12Stocks.com ➞ Best Stocks Today ➞ Best Stocks Weekly ➞ Best Stocks Year-to-Date ➞ Best Stocks Trends ➞  Best Stocks Today 12Stocks.com Best Nasdaq Stocks ➞ Best S&P 500 Stocks ➞ Best Tech Stocks ➞ Best Biotech Stocks ➞ |
| Detailed Overview of SmallCap Stocks |
| SmallCap Technical Overview, Leaders & Laggards, Top SmallCap ETF Funds & Detailed SmallCap Stocks List, Charts, Trends & More |
| Smallcap: Technical Analysis, Trends & YTD Performance | |
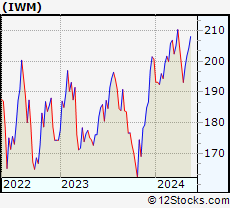
| SmallCap segment as represented by
IWM, an exchange-traded fund [ETF], holds basket of thousands of smallcap stocks from across all major sectors of the US stock market. The smallcap index (contains stocks like Riverbed & Sotheby's) is up by 3.67% and is currently underperforming the overall market by -6.9% year-to-date. Below is a quick view of technical charts and trends: | |
 IWM Weekly Chart |
|
| Long Term Trend: Very Good | |
| Medium Term Trend: Very Good | |
 IWM Daily Chart |
|
| Short Term Trend: Good | |
| Overall Trend Score: 76 | |
| YTD Performance: 3.67% | |
| **Trend Scores & Views Are Only For Educational Purposes And Not For Investing | |
| 12Stocks.com: Top Performing Small Cap Index Stocks | ||||||||||||||||||||||||||||||||||||||||||||||||
 The top performing Small Cap Index stocks year to date are
Now, more recently, over last week, the top performing Small Cap Index stocks on the move are


|
||||||||||||||||||||||||||||||||||||||||||||||||
| 12Stocks.com: Investing in Smallcap Index using Exchange Traded Funds | |
|
The following table shows list of key exchange traded funds (ETF) that
help investors track Smallcap index. The following list also includes leveraged ETF funds that track twice or thrice the daily returns of Smallcap indices. Short or inverse ETF funds move in the opposite direction to the index they track and are useful during market pullbacks or during bear markets. Quick View: Move mouse or cursor over ETF symbol (ticker) to view short-term technical chart and over ETF name to view long term chart. Click on ticker or stock name for detailed view. Click on to add stock symbol to your watchlist and to view watchlist. |
12Stocks.com List of ETFs that track Smallcap Index
| Ticker | ETF Name | Watchlist | Recent Price | Smart Investing & Trading Score | Change % | Week % | Year-to-date % |
| IWM | iShares Russell 2000 | | 208.08 | 76 | 0.07 | 1.85 | 3.67% |
| VTWO | Vanguard Russell 2000 ETF | | 84.11 | 71 | 0.00 | 1.8 | 3.71% |
| IJR | iShares Core S&P Small-Cap | | 110.39 | 68 | -0.22 | 1.29 | 1.98% |
| IWN | iShares Russell 2000 Value | | 158.71 | 76 | -0.07 | 1.61 | 2.18% |
| IWO | iShares Russell 2000 Growth | | 265.15 | 63 | -0.75 | 2.01 | 5.13% |
| IJS | iShares S&P Small-Cap 600 Value | | 101.87 | 76 | -0.15 | 1.34 | -1.16% |
| IJT | iShares S&P Small-Cap 600 Growth | | 131.34 | 71 | 0.04 | 1.14 | 4.95% |
| XSLV | PowerShares S&P SmallCap Low Volatil ETF | | 44.48 | 83 | -0.01 | 0.55 | 0.74% |
| SAA | ProShares Ultra SmallCap600 | | 24.90 | 71 | 0.50 | 2.28 | -0.18% |
| SMLV | SPDR SSGA US Small Cap Low Volatil ETF | | 113.28 | 95 | 0.43 | 1.85 | 0.68% |
| SDD | ProShares UltraShort SmallCap600 | | 17.84 | 35 | 0.96 | -2.41 | -3.19% |
| SBB | ProShares Short SmallCap600 | | 15.77 | 25 | 0.41 | -1.14 | -0.98% |
| 12Stocks.com: Charts, Trends, Fundamental Data and Performances of SmallCap Stocks | |
|
We now take in-depth look at all SmallCap stocks including charts, multi-period performances and overall trends (as measured by Smart Investing & Trading Score). One can sort SmallCap stocks (click link to choose) by Daily, Weekly and by Year-to-Date performances. Also, one can sort by size of the company or by market capitalization. |
| Select Your Default Chart Type: | |||||
| |||||
| Click on stock symbol or name for detailed view. Click on to add stock symbol to your watchlist and to view watchlist. Quick View: Move mouse or cursor over "Daily" to quickly view daily technical stock chart and over "Weekly" to view weekly technical stock chart. | |||||

 | AGIO Agios Pharmaceuticals, Inc. |
| Sector: Health Care | |
| SubSector: Biotechnology | |
| MarketCap: 2613.35 Millions | |
| Recent Price: 34.34 Smart Investing & Trading Score: 76 | |
| Day Percent Change: -1.89% Day Change: -0.66 | |
| Week Change: 4.06% Year-to-date Change: 54.2% | |
| AGIO Links: Profile News Message Board | |
| Charts:- Daily , Weekly | |
| Add AGIO to Watchlist: View: Get Complete AGIO Trend Analysis ➞ | |
 | BLUE bluebird bio, Inc. |
| Sector: Health Care | |
| SubSector: Biotechnology | |
| MarketCap: 3365.05 Millions | |
| Recent Price: 1.03 Smart Investing & Trading Score: 37 | |
| Day Percent Change: -1.90% Day Change: -0.02 | |
| Week Change: -2.83% Year-to-date Change: -25.4% | |
| BLUE Links: Profile News Message Board | |
| Charts:- Daily , Weekly | |
| Add BLUE to Watchlist: View: Get Complete BLUE Trend Analysis ➞ | |
 | XERS Xeris Pharmaceuticals, Inc. |
| Sector: Health Care | |
| SubSector: Biotechnology | |
| MarketCap: 74.5785 Millions | |
| Recent Price: 1.98 Smart Investing & Trading Score: 47 | |
| Day Percent Change: -1.98% Day Change: -0.04 | |
| Week Change: 12.5% Year-to-date Change: -15.9% | |
| XERS Links: Profile News Message Board | |
| Charts:- Daily , Weekly | |
| Add XERS to Watchlist: View: Get Complete XERS Trend Analysis ➞ | |
 | DSGN Design Therapeutics, Inc. |
| Sector: Health Care | |
| SubSector: Biotechnology | |
| MarketCap: 367 Millions | |
| Recent Price: 4.41 Smart Investing & Trading Score: 56 | |
| Day Percent Change: -2.00% Day Change: -0.09 | |
| Week Change: -3.5% Year-to-date Change: 66.1% | |
| DSGN Links: Profile News Message Board | |
| Charts:- Daily , Weekly | |
| Add DSGN to Watchlist: View: Get Complete DSGN Trend Analysis ➞ | |
 | VIR Vir Biotechnology, Inc. |
| Sector: Health Care | |
| SubSector: Biotechnology | |
| MarketCap: 3916.75 Millions | |
| Recent Price: 9.73 Smart Investing & Trading Score: 35 | |
| Day Percent Change: -2.01% Day Change: -0.20 | |
| Week Change: 3.46% Year-to-date Change: -3.3% | |
| VIR Links: Profile News Message Board | |
| Charts:- Daily , Weekly | |
| Add VIR to Watchlist: View: Get Complete VIR Trend Analysis ➞ | |
 | YMAB Y-mAbs Therapeutics, Inc. |
| Sector: Health Care | |
| SubSector: Biotechnology | |
| MarketCap: 899.585 Millions | |
| Recent Price: 11.60 Smart Investing & Trading Score: 10 | |
| Day Percent Change: -2.11% Day Change: -0.25 | |
| Week Change: -3.97% Year-to-date Change: 70.1% | |
| YMAB Links: Profile News Message Board | |
| Charts:- Daily , Weekly | |
| Add YMAB to Watchlist: View: Get Complete YMAB Trend Analysis ➞ | |
 | ADPT Adaptive Biotechnologies Corporation |
| Sector: Health Care | |
| SubSector: Biotechnology | |
| MarketCap: 3525.75 Millions | |
| Recent Price: 3.65 Smart Investing & Trading Score: 42 | |
| Day Percent Change: -2.14% Day Change: -0.08 | |
| Week Change: 4.29% Year-to-date Change: -25.5% | |
| ADPT Links: Profile News Message Board | |
| Charts:- Daily , Weekly | |
| Add ADPT to Watchlist: View: Get Complete ADPT Trend Analysis ➞ | |
 | CABA Cabaletta Bio, Inc. |
| Sector: Health Care | |
| SubSector: Biotechnology | |
| MarketCap: 222.085 Millions | |
| Recent Price: 12.35 Smart Investing & Trading Score: 57 | |
| Day Percent Change: -2.14% Day Change: -0.27 | |
| Week Change: 9.68% Year-to-date Change: -45.6% | |
| CABA Links: Profile News Message Board | |
| Charts:- Daily , Weekly | |
| Add CABA to Watchlist: View: Get Complete CABA Trend Analysis ➞ | |
 | PLRX Pliant Therapeutics, Inc. |
| Sector: Health Care | |
| SubSector: Biotechnology | |
| MarketCap: 96487 Millions | |
| Recent Price: 15.27 Smart Investing & Trading Score: 62 | |
| Day Percent Change: -2.18% Day Change: -0.34 | |
| Week Change: 10.57% Year-to-date Change: -15.7% | |
| PLRX Links: Profile News Message Board | |
| Charts:- Daily , Weekly | |
| Add PLRX to Watchlist: View: Get Complete PLRX Trend Analysis ➞ | |
 | PCRX Pacira BioSciences, Inc. |
| Sector: Health Care | |
| SubSector: Drugs - Generic | |
| MarketCap: 1403.95 Millions | |
| Recent Price: 30.82 Smart Investing & Trading Score: 75 | |
| Day Percent Change: -2.19% Day Change: -0.69 | |
| Week Change: 4.76% Year-to-date Change: -8.7% | |
| PCRX Links: Profile News Message Board | |
| Charts:- Daily , Weekly | |
| Add PCRX to Watchlist: View: Get Complete PCRX Trend Analysis ➞ | |
 | OABI OmniAb, Inc. |
| Sector: Health Care | |
| SubSector: Biotechnology | |
| MarketCap: 570 Millions | |
| Recent Price: 4.45 Smart Investing & Trading Score: 17 | |
| Day Percent Change: -2.20% Day Change: -0.10 | |
| Week Change: -4.91% Year-to-date Change: -26.6% | |
| OABI Links: Profile News Message Board | |
| Charts:- Daily , Weekly | |
| Add OABI to Watchlist: View: Get Complete OABI Trend Analysis ➞ | |
 | VCYT Veracyte, Inc. |
| Sector: Health Care | |
| SubSector: Biotechnology | |
| MarketCap: 1089.05 Millions | |
| Recent Price: 22.88 Smart Investing & Trading Score: 50 | |
| Day Percent Change: -2.22% Day Change: -0.52 | |
| Week Change: 7.07% Year-to-date Change: -16.8% | |
| VCYT Links: Profile News Message Board | |
| Charts:- Daily , Weekly | |
| Add VCYT to Watchlist: View: Get Complete VCYT Trend Analysis ➞ | |
 | BKD Brookdale Senior Living Inc. |
| Sector: Health Care | |
| SubSector: Long-Term Care Facilities | |
| MarketCap: 420.686 Millions | |
| Recent Price: 6.91 Smart Investing & Trading Score: 31 | |
| Day Percent Change: -2.26% Day Change: -0.16 | |
| Week Change: -2.12% Year-to-date Change: 18.7% | |
| BKD Links: Profile News Message Board | |
| Charts:- Daily , Weekly | |
| Add BKD to Watchlist: View: Get Complete BKD Trend Analysis ➞ | |
 | CHRS Coherus BioSciences, Inc. |
| Sector: Health Care | |
| SubSector: Biotechnology | |
| MarketCap: 1073.45 Millions | |
| Recent Price: 2.12 Smart Investing & Trading Score: 50 | |
| Day Percent Change: -2.30% Day Change: -0.05 | |
| Week Change: 11.58% Year-to-date Change: -36.3% | |
| CHRS Links: Profile News Message Board | |
| Charts:- Daily , Weekly | |
| Add CHRS to Watchlist: View: Get Complete CHRS Trend Analysis ➞ | |
 | ITCI Intra-Cellular Therapies, Inc. |
| Sector: Health Care | |
| SubSector: Biotechnology | |
| MarketCap: 991.885 Millions | |
| Recent Price: 65.00 Smart Investing & Trading Score: 10 | |
| Day Percent Change: -2.30% Day Change: -1.53 | |
| Week Change: 0.06% Year-to-date Change: -9.2% | |
| ITCI Links: Profile News Message Board | |
| Charts:- Daily , Weekly | |
| Add ITCI to Watchlist: View: Get Complete ITCI Trend Analysis ➞ | |
 | GERN Geron Corporation |
| Sector: Health Care | |
| SubSector: Biotechnology | |
| MarketCap: 228.685 Millions | |
| Recent Price: 3.81 Smart Investing & Trading Score: 76 | |
| Day Percent Change: -2.31% Day Change: -0.09 | |
| Week Change: 0.26% Year-to-date Change: 80.6% | |
| GERN Links: Profile News Message Board | |
| Charts:- Daily , Weekly | |
| Add GERN to Watchlist: View: Get Complete GERN Trend Analysis ➞ | |
 | BLFS BioLife Solutions, Inc. |
| Sector: Health Care | |
| SubSector: Medical Instruments & Supplies | |
| MarketCap: 264.36 Millions | |
| Recent Price: 21.96 Smart Investing & Trading Score: 68 | |
| Day Percent Change: -2.31% Day Change: -0.52 | |
| Week Change: 12.38% Year-to-date Change: 35.1% | |
| BLFS Links: Profile News Message Board | |
| Charts:- Daily , Weekly | |
| Add BLFS to Watchlist: View: Get Complete BLFS Trend Analysis ➞ | |
 | VYGR Voyager Therapeutics, Inc. |
| Sector: Health Care | |
| SubSector: Biotechnology | |
| MarketCap: 321.085 Millions | |
| Recent Price: 8.43 Smart Investing & Trading Score: 66 | |
| Day Percent Change: -2.32% Day Change: -0.20 | |
| Week Change: -0.12% Year-to-date Change: -0.1% | |
| VYGR Links: Profile News Message Board | |
| Charts:- Daily , Weekly | |
| Add VYGR to Watchlist: View: Get Complete VYGR Trend Analysis ➞ | |
 | OPTN OptiNose, Inc. |
| Sector: Health Care | |
| SubSector: Drugs - Generic | |
| MarketCap: 183.385 Millions | |
| Recent Price: 1.26 Smart Investing & Trading Score: 69 | |
| Day Percent Change: -2.33% Day Change: -0.03 | |
| Week Change: 3.28% Year-to-date Change: -2.3% | |
| OPTN Links: Profile News Message Board | |
| Charts:- Daily , Weekly | |
| Add OPTN to Watchlist: View: Get Complete OPTN Trend Analysis ➞ | |
 | PMVP PMV Pharmaceuticals, Inc. |
| Sector: Health Care | |
| SubSector: Biotechnology | |
| MarketCap: 20187 Millions | |
| Recent Price: 2.10 Smart Investing & Trading Score: 63 | |
| Day Percent Change: -2.33% Day Change: -0.05 | |
| Week Change: 2.94% Year-to-date Change: -32.3% | |
| PMVP Links: Profile News Message Board | |
| Charts:- Daily , Weekly | |
| Add PMVP to Watchlist: View: Get Complete PMVP Trend Analysis ➞ | |
 | SGRY Surgery Partners, Inc. |
| Sector: Health Care | |
| SubSector: Hospitals | |
| MarketCap: 328.446 Millions | |
| Recent Price: 25.83 Smart Investing & Trading Score: 32 | |
| Day Percent Change: -2.34% Day Change: -0.62 | |
| Week Change: -2.86% Year-to-date Change: -19.3% | |
| SGRY Links: Profile News Message Board | |
| Charts:- Daily , Weekly | |
| Add SGRY to Watchlist: View: Get Complete SGRY Trend Analysis ➞ | |
 | ARCT Arcturus Therapeutics Holdings Inc. |
| Sector: Health Care | |
| SubSector: Biotechnology | |
| MarketCap: 241.385 Millions | |
| Recent Price: 29.78 Smart Investing & Trading Score: 45 | |
| Day Percent Change: -2.36% Day Change: -0.72 | |
| Week Change: 9.24% Year-to-date Change: -5.6% | |
| ARCT Links: Profile News Message Board | |
| Charts:- Daily , Weekly | |
| Add ARCT to Watchlist: View: Get Complete ARCT Trend Analysis ➞ | |
 | ARAY Accuray Incorporated |
| Sector: Health Care | |
| SubSector: Medical Appliances & Equipment | |
| MarketCap: 169.58 Millions | |
| Recent Price: 1.63 Smart Investing & Trading Score: 35 | |
| Day Percent Change: -2.40% Day Change: -0.04 | |
| Week Change: 0.62% Year-to-date Change: -42.4% | |
| ARAY Links: Profile News Message Board | |
| Charts:- Daily , Weekly | |
| Add ARAY to Watchlist: View: Get Complete ARAY Trend Analysis ➞ | |
 | IRWD Ironwood Pharmaceuticals, Inc. |
| Sector: Health Care | |
| SubSector: Drugs - Generic | |
| MarketCap: 1616.35 Millions | |
| Recent Price: 6.48 Smart Investing & Trading Score: 27 | |
| Day Percent Change: -2.41% Day Change: -0.16 | |
| Week Change: -7.43% Year-to-date Change: -43.4% | |
| IRWD Links: Profile News Message Board | |
| Charts:- Daily , Weekly | |
| Add IRWD to Watchlist: View: Get Complete IRWD Trend Analysis ➞ | |
 | RAPT RAPT Therapeutics, Inc. |
| Sector: Health Care | |
| SubSector: Biotechnology | |
| MarketCap: 368.785 Millions | |
| Recent Price: 4.04 Smart Investing & Trading Score: 28 | |
| Day Percent Change: -2.42% Day Change: -0.10 | |
| Week Change: -6.7% Year-to-date Change: -83.7% | |
| RAPT Links: Profile News Message Board | |
| Charts:- Daily , Weekly | |
| Add RAPT to Watchlist: View: Get Complete RAPT Trend Analysis ➞ | |
| For tabular summary view of above stock list: Summary View ➞ 0 - 25 , 25 - 50 , 50 - 75 , 75 - 100 , 100 - 125 , 125 - 150 , 150 - 175 , 175 - 200 , 200 - 225 , 225 - 250 , 250 - 275 , 275 - 300 , 300 - 325 , 325 - 350 | ||
| Click To Change The Sort Order: By Market Cap or Company Size Performance: Year-to-date, Week and Day | |
| Select Chart Type: | ||
| Too many stocks? View smallcap stocks filtered by marketcap & sector |
| Marketcap: All SmallCap Stocks (default-no microcap), Large, Mid-Range, Small & MicroCap |
| Sector: Tech, Finance, Energy, Staples, Retail, Industrial, Materials, Utilities & Medical |
|
Best Stocks Today 12Stocks.com |
© 2024 12Stocks.com Terms & Conditions Privacy Contact Us
All Information Provided Only For Education And Not To Be Used For Investing or Trading. See Terms & Conditions


One More Thing ... Get Best Stocks Delivered Daily!
Never Ever Miss A Move With Our Top Ten Stocks Lists
Find Best Stocks In Any Market - Bull or Bear Market
Take A Peek At Our Top Ten Stocks Lists: Daily, Weekly, Year-to-Date & Top Trends
Find Best Stocks In Any Market - Bull or Bear Market
Take A Peek At Our Top Ten Stocks Lists: Daily, Weekly, Year-to-Date & Top Trends
Smallcap Stocks With Best Up Trends [0-bearish to 100-bullish]: CommScope Holding[100], Coeur Mining[100], Hecla Mining[100], MicroStrategy [100], Enovix [100], Rayonier Advanced[100], Nurix [100], Energy Fuels[100], NovaGold Resources[100], Piedmont Lithium[100], Wave Life[100]
Best Smallcap Stocks Year-to-Date:
CareMax [495.88%], Bakkt [413.9%], Janux [338.34%], Viking [260.02%], Alpine Immune[241.23%], Longboard [238.63%], Avidity Biosciences[226.33%], Super Micro[212.35%], Arcutis Bio[184.83%], Sweetgreen [180.97%], Novavax [171.04%] Best Smallcap Stocks This Week:
Vaxxinity [58.82%], Novavax [46.51%], Vicarious Surgical[45.62%], Harrow Health[44.48%], ProKidney [44.31%], Workhorse Group[36.06%], Maxeon Solar[35.94%], Fossil Group[35.44%], Humacyte [34.68%], MicroStrategy [34.23%], Cadiz [33.48%] Best Smallcap Stocks Daily:
Vaxxinity [45.95%], Presto Automation[31.90%], Vicarious Surgical[27.93%], Orchestra BioMed[12.77%], CommScope Holding[11.86%], Coeur Mining[11.57%], Hecla Mining[11.11%], MicroStrategy [10.04%], Tenaya [9.65%], Bakkt [9.25%], Enovix [9.25%]