
 Login Sign Up


| |||||
 |  | ||||

| 12Stocks.com Market Intelligence |
Best S&P 500 Stocks
|
On this page, you will find the most comprehensive analysis of S&P 500 stocks and ETFs - from latest trends to performances to charts ➞. First, here are the year-to-date (YTD) performances of the most requested S&P 500 stocks at 12Stocks.com (click stock for review):
| NVIDIA 72% | ||
| Amazon.com 20% | ||
| Merck 19% | ||
| Google 18% | ||
| Walmart 13% | ||
| Caterpillar 13% | ||
| JPMorgan Chase 12% | ||
| Goldman Sachs 12% | ||
| Chevron 8% | ||
| Microsoft 6% | ||
| Johnson & Johnson -4% | ||
| McDonald s -7% | ||
| Apple -11% | ||
| Gilead -19% | ||
| Starbucks -23% | ||
| Boeing -32% | ||
| Intel -39% | ||
| Quick: S&P 500 Stocks Lists: Performances & Trends, S&P 500 Stock Charts
Sort S&P 500 stocks: Daily, Weekly, Year-to-Date, Market Cap & Trends. Filter S&P 500 stocks list by sector: Show all, Tech, Finance, Energy, Staples, Retail, Industrial, Materials, Utilities and HealthCare |
| 12Stocks.com S&P 500 Stocks Performances & Trends Daily Report | |||||||||
|
| 
The overall Smart Investing & Trading Score is 17 (0-bearish to 100-bullish) which puts S&P 500 index in short term bearish trend. The Smart Investing & Trading Score from previous trading session is 7 and hence an improvement of trend. | ||||||||
Here are the Smart Investing & Trading Scores of the most requested S&P 500 stocks at 12Stocks.com (click stock name for detailed review):
|


| 12Stocks.com: Top Performing S&P 500 Index Stocks | ||||||||||||||||||||||||||||||||||||||||||||||||
 The top performing S&P 500 Index stocks year to date are
Now, more recently, over last week, the top performing S&P 500 Index stocks on the move are


|
||||||||||||||||||||||||||||||||||||||||||||||||
| 12Stocks.com: Investing in S&P 500 Index with Stocks | |
|
The following table helps investors and traders sort through current performance and trends (as measured by Smart Investing & Trading Score) of various
stocks in the S&P 500 Index. Quick View: Move mouse or cursor over stock symbol (ticker) to view short-term technical chart and over stock name to view long term chart. Click on  to add stock symbol to your watchlist and to add stock symbol to your watchlist and  to view watchlist. Click on any ticker or stock name for detailed market intelligence report for that stock. to view watchlist. Click on any ticker or stock name for detailed market intelligence report for that stock. |
12Stocks.com Performance of Stocks in S&P 500 Index
| Ticker | Stock Name | Watchlist | Category | Recent Price | Smart Investing & Trading Score | Change % | YTD Change% |
| ILMN | Illumina |   | Health Care | 124.35 | 52 | -0.26% | -10.69% |
| KMI | Kinder Morgan | | Energy | 18.33 | 51 | 0.55% | 3.91% |
| GPC | Genuine Parts | | Services & Goods | 157.08 | 51 | 0.20% | 13.42% |
| CE | Celanese | | Materials | 156.26 | 51 | 1.18% | 0.57% |
| ORCL | Oracle | | Technology | 115.71 | 51 | 0.94% | 9.75% |
| UNH | UnitedHealth | | Health Care | 489.06 | 50 | 1.02% | -7.11% |
| SJM | J. M. | | Consumer Staples | 114.06 | 50 | 0.40% | -9.75% |
| PPG | PPG Industries | | Materials | 132.16 | 49 | 0.92% | -11.63% |
| COST | Costco Wholesale | | Services & Goods | 728.62 | 49 | 0.89% | 10.38% |
| CTLT | Catalent | | Health Care | 56.40 | 49 | 0.71% | 25.53% |
| AMT | American Tower | | Financials | 176.90 | 49 | 0.03% | -18.06% |
| STE | STERIS | | Health Care | 204.76 | 49 | -0.14% | -6.86% |
| MU | Micron | | Technology | 111.57 | 48 | 1.70% | 30.74% |
| GE | General Electric | | Industrials | 161.41 | 48 | 1.07% | 26.47% |
| CEG | Constellation | | Utilities | 185.76 | 48 | 0.61% | 58.62% |
| PHM | Pulte | | Industrials | 112.47 | 48 | 0.58% | 8.96% |
| ADI | Analog Devices | | Technology | 194.82 | 48 | 0.48% | -1.88% |
| BK | Bank of New York | | Financials | 56.58 | 48 | 0.20% | 8.69% |
| MCK | McKesson | | Services & Goods | 531.23 | 48 | 0.02% | 14.74% |
| JPM | JPMorgan Chase | | Financials | 191.25 | 48 | -0.32% | 12.43% |
| MCHP | Microchip | | Technology | 88.53 | 48 | -0.29% | -1.83% |
| VFC | V.F | | Consumer Staples | 12.57 | 47 | 3.20% | -33.14% |
| TJX | TJX | | Services & Goods | 95.20 | 47 | 1.48% | 1.49% |
| DFS | Discover Financial | | Financials | 125.01 | 46 | 1.16% | 11.22% |
| KHC | Kraft Heinz | | Consumer Staples | 36.66 | 46 | 1.05% | -0.87% |
| For chart view version of above stock list: Chart View ➞ 0 - 25 , 25 - 50 , 50 - 75 , 75 - 100 , 100 - 125 , 125 - 150 , 150 - 175 , 175 - 200 , 200 - 225 , 225 - 250 , 250 - 275 , 275 - 300 , 300 - 325 , 325 - 350 , 350 - 375 , 375 - 400 , 400 - 425 , 425 - 450 , 450 - 475 | ||
 | Click To Change The Sort Order: By Market Cap or Company Size Performance: Year-to-date, Week and Day |  |
|
Get the most comprehensive stock market coverage daily at 12Stocks.com ➞ Best Stocks Today ➞ Best Stocks Weekly ➞ Best Stocks Year-to-Date ➞ Best Stocks Trends ➞  Best Stocks Today 12Stocks.com Best Nasdaq Stocks ➞ Best S&P 500 Stocks ➞ Best Tech Stocks ➞ Best Biotech Stocks ➞ |
| Detailed Overview of S&P 500 Stocks |
| S&P 500 Technical Overview, Leaders & Laggards, Top S&P 500 ETF Funds & Detailed S&P 500 Stocks List, Charts, Trends & More |
| S&P 500: Technical Analysis, Trends & YTD Performance | |
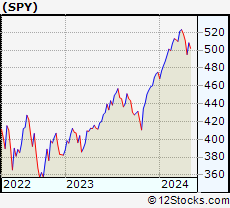
| S&P 500 index as represented by
SPY, an exchange-traded fund [ETF], holds basket of five hundred (mostly largecap) stocks from across all major sectors of the US stock market. The S&P 500 index (contains stocks like Apple and Exxon) is up by 5.83% and is currently outperforming the overall market by 0.68% year-to-date. Below is a quick view of technical charts and trends: | |
 SPY Weekly Chart |
|
| Long Term Trend: Not Good | |
| Medium Term Trend: Not Good | |
 SPY Daily Chart |
|
| Short Term Trend: Deteriorating | |
| Overall Trend Score: 17 | |
| YTD Performance: 5.83% | |
| **Trend Scores & Views Are Only For Educational Purposes And Not For Investing | |
| 12Stocks.com: Investing in S&P 500 Index using Exchange Traded Funds | |
|
The following table shows list of key exchange traded funds (ETF) that
help investors track S&P 500 index. The following list also includes leveraged ETF funds that track twice or thrice the daily returns of S&P 500 indices. Short or inverse ETF funds move in the opposite direction to the index they track and are useful during market pullbacks or during bear markets. Quick View: Move mouse or cursor over ETF symbol (ticker) to view short-term technical chart and over ETF name to view long term chart. Click on ticker or stock name for detailed view. Click on to add stock symbol to your watchlist and to view watchlist. |
12Stocks.com List of ETFs that track S&P 500 Index
| Ticker | ETF Name | Watchlist | Recent Price | Smart Investing & Trading Score | Change % | Week % | Year-to-date % |
| SPY | SPDR S&P 500 ETF | | 503.02 | 17 | 0.53 | -1.03 | 5.83% |
| IVV | iShares Core S&P 500 ETF | | 505.50 | 17 | 0.52 | -1.03 | 5.84% |
| VOO | Vanguard 500 ETF | | 462.39 | 17 | 0.53 | -1.03 | 5.86% |
| OEF | iShares S&P 100 | | 238.79 | 17 | 0.55 | -1.15 | 6.89% |
| SSO | ProShares Ultra S&P500 | | 70.90 | 17 | 0.72 | -2.49 | 8.96% |
| UPRO | ProShares UltraPro S&P500 | | 61.66 | 17 | 1.58 | -3.38 | 12.64% |
| SPXL | Direxion Daily S&P500 Bull 3X ETF | | 117.07 | 17 | 1.49 | -3.36 | 12.58% |
| SH | ProShares Short S&P500 | | 12.44 | 83 | -0.40 | 1.3 | -4.23% |
| SDS | ProShares UltraShort S&P500 | | 27.13 | 83 | -0.99 | 2.26 | -9.32% |
| SPXU | ProShares UltraPro Short S&P500 | | 36.70 | 78 | -1.38 | 3.37 | -14.66% |
| SPXS | Direxion Daily S&P 500 Bear 3X ETF | | 9.93 | 78 | -1.39 | 3.33 | -14.03% |
| 12Stocks.com: Charts, Trends, Fundamental Data and Performances of S&P 500 Stocks | |
|
We now take in-depth look at all S&P 500 stocks including charts, multi-period performances and overall trends (as measured by Smart Investing & Trading Score). One can sort S&P 500 stocks (click link to choose) by Daily, Weekly and by Year-to-Date performances. Also, one can sort by size of the company or by market capitalization. |
| Select Your Default Chart Type: | |||||
| |||||
| Click on stock symbol or name for detailed view. Click on to add stock symbol to your watchlist and to view watchlist. Quick View: Move mouse or cursor over "Daily" to quickly view daily technical stock chart and over "Weekly" to view weekly technical stock chart. | |||||

 | ILMN Illumina, Inc. |
| Sector: Health Care | |
| SubSector: Biotechnology | |
| MarketCap: 39194.3 Millions | |
| Recent Price: 124.35 Smart Investing & Trading Score: 52 | |
| Day Percent Change: -0.26% Day Change: -0.33 | |
| Week Change: 1.69% Year-to-date Change: -10.7% | |
| ILMN Links: Profile News Message Board | |
| Charts:- Daily , Weekly | |
| Add ILMN to Watchlist: View: Get ILMN Trend Analysis ➞ | |
 | KMI Kinder Morgan, Inc. |
| Sector: Energy | |
| SubSector: Oil & Gas Pipelines | |
| MarketCap: 31283.5 Millions | |
| Recent Price: 18.33 Smart Investing & Trading Score: 51 | |
| Day Percent Change: 0.55% Day Change: 0.10 | |
| Week Change: -1.87% Year-to-date Change: 3.9% | |
| KMI Links: Profile News Message Board | |
| Charts:- Daily , Weekly | |
| Add KMI to Watchlist: View: Get KMI Trend Analysis ➞ | |
 | GPC Genuine Parts Company |
| Sector: Services & Goods | |
| SubSector: Auto Parts Stores | |
| MarketCap: 8605.9 Millions | |
| Recent Price: 157.08 Smart Investing & Trading Score: 51 | |
| Day Percent Change: 0.20% Day Change: 0.31 | |
| Week Change: -1.78% Year-to-date Change: 13.4% | |
| GPC Links: Profile News Message Board | |
| Charts:- Daily , Weekly | |
| Add GPC to Watchlist: View: Get GPC Trend Analysis ➞ | |
 | CE Celanese Corporation |
| Sector: Materials | |
| SubSector: Chemicals - Major Diversified | |
| MarketCap: 8521.06 Millions | |
| Recent Price: 156.26 Smart Investing & Trading Score: 51 | |
| Day Percent Change: 1.18% Day Change: 1.82 | |
| Week Change: 1.15% Year-to-date Change: 0.6% | |
| CE Links: Profile News Message Board | |
| Charts:- Daily , Weekly | |
| Add CE to Watchlist: View: Get CE Trend Analysis ➞ | |
 | ORCL Oracle Corporation |
| Sector: Technology | |
| SubSector: Application Software | |
| MarketCap: 164530 Millions | |
| Recent Price: 115.71 Smart Investing & Trading Score: 51 | |
| Day Percent Change: 0.94% Day Change: 1.08 | |
| Week Change: -1.28% Year-to-date Change: 9.8% | |
| ORCL Links: Profile News Message Board | |
| Charts:- Daily , Weekly | |
| Add ORCL to Watchlist: View: Get ORCL Trend Analysis ➞ | |
 | UNH UnitedHealth Group Incorporated |
| Sector: Health Care | |
| SubSector: Health Care Plans | |
| MarketCap: 217384 Millions | |
| Recent Price: 489.06 Smart Investing & Trading Score: 50 | |
| Day Percent Change: 1.02% Day Change: 4.95 | |
| Week Change: -1.27% Year-to-date Change: -7.1% | |
| UNH Links: Profile News Message Board | |
| Charts:- Daily , Weekly | |
| Add UNH to Watchlist: View: Get UNH Trend Analysis ➞ | |
 | SJM The J. M. Smucker Company |
| Sector: Consumer Staples | |
| SubSector: Processed & Packaged Goods | |
| MarketCap: 12635.8 Millions | |
| Recent Price: 114.06 Smart Investing & Trading Score: 50 | |
| Day Percent Change: 0.40% Day Change: 0.46 | |
| Week Change: 0.4% Year-to-date Change: -9.8% | |
| SJM Links: Profile News Message Board | |
| Charts:- Daily , Weekly | |
| Add SJM to Watchlist: View: Get SJM Trend Analysis ➞ | |
 | PPG PPG Industries, Inc. |
| Sector: Materials | |
| SubSector: Specialty Chemicals | |
| MarketCap: 20285.5 Millions | |
| Recent Price: 132.16 Smart Investing & Trading Score: 49 | |
| Day Percent Change: 0.92% Day Change: 1.21 | |
| Week Change: 1.54% Year-to-date Change: -11.6% | |
| PPG Links: Profile News Message Board | |
| Charts:- Daily , Weekly | |
| Add PPG to Watchlist: View: Get PPG Trend Analysis ➞ | |
 | COST Costco Wholesale Corporation |
| Sector: Services & Goods | |
| SubSector: Discount, Variety Stores | |
| MarketCap: 136355 Millions | |
| Recent Price: 728.62 Smart Investing & Trading Score: 49 | |
| Day Percent Change: 0.89% Day Change: 6.40 | |
| Week Change: -0.08% Year-to-date Change: 10.4% | |
| COST Links: Profile News Message Board | |
| Charts:- Daily , Weekly | |
| Add COST to Watchlist: View: Get COST Trend Analysis ➞ | |
 | CTLT Catalent, Inc. |
| Sector: Health Care | |
| SubSector: Drugs - Generic | |
| MarketCap: 6351.95 Millions | |
| Recent Price: 56.40 Smart Investing & Trading Score: 49 | |
| Day Percent Change: 0.71% Day Change: 0.40 | |
| Week Change: 0.86% Year-to-date Change: 25.5% | |
| CTLT Links: Profile News Message Board | |
| Charts:- Daily , Weekly | |
| Add CTLT to Watchlist: View: Get CTLT Trend Analysis ➞ | |
 | AMT American Tower Corporation (REIT) |
| Sector: Financials | |
| SubSector: REIT - Diversified | |
| MarketCap: 92527 Millions | |
| Recent Price: 176.90 Smart Investing & Trading Score: 49 | |
| Day Percent Change: 0.03% Day Change: 0.06 | |
| Week Change: 3.03% Year-to-date Change: -18.1% | |
| AMT Links: Profile News Message Board | |
| Charts:- Daily , Weekly | |
| Add AMT to Watchlist: View: Get AMT Trend Analysis ➞ | |
 | STE STERIS plc |
| Sector: Health Care | |
| SubSector: Medical Instruments & Supplies | |
| MarketCap: 10875 Millions | |
| Recent Price: 204.76 Smart Investing & Trading Score: 49 | |
| Day Percent Change: -0.14% Day Change: -0.28 | |
| Week Change: 0.42% Year-to-date Change: -6.9% | |
| STE Links: Profile News Message Board | |
| Charts:- Daily , Weekly | |
| Add STE to Watchlist: View: Get STE Trend Analysis ➞ | |
 | MU Micron Technology, Inc. |
| Sector: Technology | |
| SubSector: Semiconductor- Memory Chips | |
| MarketCap: 45188.4 Millions | |
| Recent Price: 111.57 Smart Investing & Trading Score: 48 | |
| Day Percent Change: 1.70% Day Change: 1.87 | |
| Week Change: -2.85% Year-to-date Change: 30.7% | |
| MU Links: Profile News Message Board | |
| Charts:- Daily , Weekly | |
| Add MU to Watchlist: View: Get MU Trend Analysis ➞ | |
 | GE General Electric Company |
| Sector: Industrials | |
| SubSector: Diversified Machinery | |
| MarketCap: 64710.6 Millions | |
| Recent Price: 161.41 Smart Investing & Trading Score: 48 | |
| Day Percent Change: 1.07% Day Change: 1.71 | |
| Week Change: -0.58% Year-to-date Change: 26.5% | |
| GE Links: Profile News Message Board | |
| Charts:- Daily , Weekly | |
| Add GE to Watchlist: View: Get GE Trend Analysis ➞ | |
 | CEG Constellation Energy Corporation |
| Sector: Utilities | |
| SubSector: Utilities - Renewable | |
| MarketCap: 29600 Millions | |
| Recent Price: 185.76 Smart Investing & Trading Score: 48 | |
| Day Percent Change: 0.61% Day Change: 1.13 | |
| Week Change: -1.39% Year-to-date Change: 58.6% | |
| CEG Links: Profile News Message Board | |
| Charts:- Daily , Weekly | |
| Add CEG to Watchlist: View: Get CEG Trend Analysis ➞ | |
 | PHM PulteGroup, Inc. |
| Sector: Industrials | |
| SubSector: Residential Construction | |
| MarketCap: 6186.46 Millions | |
| Recent Price: 112.47 Smart Investing & Trading Score: 48 | |
| Day Percent Change: 0.58% Day Change: 0.65 | |
| Week Change: -1.17% Year-to-date Change: 9.0% | |
| PHM Links: Profile News Message Board | |
| Charts:- Daily , Weekly | |
| Add PHM to Watchlist: View: Get PHM Trend Analysis ➞ | |
 | ADI Analog Devices, Inc. |
| Sector: Technology | |
| SubSector: Semiconductor - Integrated Circuits | |
| MarketCap: 32859 Millions | |
| Recent Price: 194.82 Smart Investing & Trading Score: 48 | |
| Day Percent Change: 0.48% Day Change: 0.93 | |
| Week Change: -3.54% Year-to-date Change: -1.9% | |
| ADI Links: Profile News Message Board | |
| Charts:- Daily , Weekly | |
| Add ADI to Watchlist: View: Get ADI Trend Analysis ➞ | |
 | BK The Bank of New York Mellon Corporation |
| Sector: Financials | |
| SubSector: Asset Management | |
| MarketCap: 29807.5 Millions | |
| Recent Price: 56.58 Smart Investing & Trading Score: 48 | |
| Day Percent Change: 0.20% Day Change: 0.12 | |
| Week Change: -1.3% Year-to-date Change: 8.7% | |
| BK Links: Profile News Message Board | |
| Charts:- Daily , Weekly | |
| Add BK to Watchlist: View: Get BK Trend Analysis ➞ | |
 | MCK McKesson Corporation |
| Sector: Services & Goods | |
| SubSector: Drugs Wholesale | |
| MarketCap: 24096.7 Millions | |
| Recent Price: 531.23 Smart Investing & Trading Score: 48 | |
| Day Percent Change: 0.02% Day Change: 0.13 | |
| Week Change: -2.22% Year-to-date Change: 14.7% | |
| MCK Links: Profile News Message Board | |
| Charts:- Daily , Weekly | |
| Add MCK to Watchlist: View: Get MCK Trend Analysis ➞ | |
 | JPM JPMorgan Chase & Co. |
| Sector: Financials | |
| SubSector: Money Center Banks | |
| MarketCap: 279736 Millions | |
| Recent Price: 191.25 Smart Investing & Trading Score: 48 | |
| Day Percent Change: -0.32% Day Change: -0.62 | |
| Week Change: -1.16% Year-to-date Change: 12.4% | |
| JPM Links: Profile News Message Board | |
| Charts:- Daily , Weekly | |
| Add JPM to Watchlist: View: Get JPM Trend Analysis ➞ | |
 | MCHP Microchip Technology Incorporated |
| Sector: Technology | |
| SubSector: Semiconductor - Broad Line | |
| MarketCap: 16826.3 Millions | |
| Recent Price: 88.53 Smart Investing & Trading Score: 48 | |
| Day Percent Change: -0.29% Day Change: -0.26 | |
| Week Change: -5.42% Year-to-date Change: -1.8% | |
| MCHP Links: Profile News Message Board | |
| Charts:- Daily , Weekly | |
| Add MCHP to Watchlist: View: Get MCHP Trend Analysis ➞ | |
 | VFC V.F. Corporation |
| Sector: Consumer Staples | |
| SubSector: Textile - Apparel Clothing | |
| MarketCap: 23607.5 Millions | |
| Recent Price: 12.57 Smart Investing & Trading Score: 47 | |
| Day Percent Change: 3.20% Day Change: 0.39 | |
| Week Change: -0.55% Year-to-date Change: -33.1% | |
| VFC Links: Profile News Message Board | |
| Charts:- Daily , Weekly | |
| Add VFC to Watchlist: View: Get VFC Trend Analysis ➞ | |
 | TJX The TJX Companies, Inc. |
| Sector: Services & Goods | |
| SubSector: Department Stores | |
| MarketCap: 50656.2 Millions | |
| Recent Price: 95.20 Smart Investing & Trading Score: 47 | |
| Day Percent Change: 1.48% Day Change: 1.39 | |
| Week Change: -1.2% Year-to-date Change: 1.5% | |
| TJX Links: Profile News Message Board | |
| Charts:- Daily , Weekly | |
| Add TJX to Watchlist: View: Get TJX Trend Analysis ➞ | |
 | DFS Discover Financial Services |
| Sector: Financials | |
| SubSector: Credit Services | |
| MarketCap: 9228.88 Millions | |
| Recent Price: 125.01 Smart Investing & Trading Score: 46 | |
| Day Percent Change: 1.16% Day Change: 1.43 | |
| Week Change: -2.11% Year-to-date Change: 11.2% | |
| DFS Links: Profile News Message Board | |
| Charts:- Daily , Weekly | |
| Add DFS to Watchlist: View: Get DFS Trend Analysis ➞ | |
 | KHC The Kraft Heinz Company |
| Sector: Consumer Staples | |
| SubSector: Food - Major Diversified | |
| MarketCap: 32096.3 Millions | |
| Recent Price: 36.66 Smart Investing & Trading Score: 46 | |
| Day Percent Change: 1.05% Day Change: 0.38 | |
| Week Change: -3.93% Year-to-date Change: -0.9% | |
| KHC Links: Profile News Message Board | |
| Charts:- Daily , Weekly | |
| Add KHC to Watchlist: View: Get KHC Trend Analysis ➞ | |
| For tabular summary view of above stock list: Summary View ➞ 0 - 25 , 25 - 50 , 50 - 75 , 75 - 100 , 100 - 125 , 125 - 150 , 150 - 175 , 175 - 200 , 200 - 225 , 225 - 250 , 250 - 275 , 275 - 300 , 300 - 325 , 325 - 350 , 350 - 375 , 375 - 400 , 400 - 425 , 425 - 450 , 450 - 475 | ||
| Click To Change The Sort Order: By Market Cap or Company Size Performance: Year-to-date, Week and Day | |
| Select Chart Type: | ||
|
Best Stocks Today 12Stocks.com |
© 2024 12Stocks.com Terms & Conditions Privacy Contact Us
All Information Provided Only For Education And Not To Be Used For Investing or Trading. See Terms & Conditions


One More Thing ... Get Best Stocks Delivered Daily!
Never Ever Miss A Move With Our Top Ten Stocks Lists
Find Best Stocks In Any Market - Bull or Bear Market
Take A Peek At Our Top Ten Stocks Lists: Daily, Weekly, Year-to-Date & Top Trends
Find Best Stocks In Any Market - Bull or Bear Market
Take A Peek At Our Top Ten Stocks Lists: Daily, Weekly, Year-to-Date & Top Trends
S&P 500 Stocks With Best Up Trends [0-bearish to 100-bullish]: C.H. Robinson[100], QUALCOMM [100], BorgWarner [100], Kellogg [100], WestRock [100], Xylem [100], Ventas [100], AES [100], Becton Dickinson[100], Air Products[100], Bio-Techne [100]
Best S&P 500 Stocks Year-to-Date:
NVIDIA [71.87%], Constellation [58.62%], NRG [44.9%], Chipotle Mexican[37.48%], DaVita [35.56%], Western Digital[32.63%], Progressive [32.3%], Eli Lilly[31.37%], Leidos Holdings[31.07%], Micron [30.74%], Targa Resources[29.82%] Best S&P 500 Stocks This Week:
C.H. Robinson[18.73%], Bio-Techne [16.16%], Garmin [14.63%], QUALCOMM [8.98%], Leidos Holdings[8.83%], Pfizer [8.23%], AES [7.82%], BorgWarner [7.56%], WestRock [7.51%], Corning [7.02%], Tesla [6.38%] Best S&P 500 Stocks Daily:
C.H. Robinson[15.65%], QUALCOMM [10.01%], BorgWarner [8.61%], Kellogg [7.65%], Monolithic Power[7.51%], WestRock [6.05%], Zoetis [5.78%], Xylem [4.44%], Estee Lauder[4.36%], Albemarle [3.97%], MGM Resorts[3.53%]