
 Login Sign Up


| |||||
 |  | ||||

| 12Stocks.com Market Intelligence |
Best S&P 500 Stocks
|
On this page, you will find the most comprehensive analysis of S&P 500 stocks and ETFs - from latest trends to performances to charts ➞. First, here are the year-to-date (YTD) performances of the most requested S&P 500 stocks at 12Stocks.com (click stock for review):
| NVIDIA 67% | ||
| Merck 20% | ||
| Walmart 15% | ||
| Caterpillar 14% | ||
| Amazon.com 14% | ||
| JPMorgan Chase 14% | ||
| Google 12% | ||
| Chevron 11% | ||
| Goldman Sachs 9% | ||
| Microsoft 6% | ||
| Johnson & Johnson -6% | ||
| McDonald s -7% | ||
| Starbucks -9% | ||
| Apple -12% | ||
| Gilead -19% | ||
| Intel -30% | ||
| Boeing -36% | ||
| Quick: S&P 500 Stocks Lists: Performances & Trends, S&P 500 Stock Charts
Sort S&P 500 stocks: Daily, Weekly, Year-to-Date, Market Cap & Trends. Filter S&P 500 stocks list by sector: Show all, Tech, Finance, Energy, Staples, Retail, Industrial, Materials, Utilities and HealthCare |
| 12Stocks.com S&P 500 Stocks Performances & Trends Daily Report | |||||||||
|
| 
The overall Smart Investing & Trading Score is 44 (0-bearish to 100-bullish) which puts S&P 500 index in short term neutral trend. The Smart Investing & Trading Score from previous trading session is 58 and hence a deterioration of trend. | ||||||||
Here are the Smart Investing & Trading Scores of the most requested S&P 500 stocks at 12Stocks.com (click stock name for detailed review):
|


| 12Stocks.com: Top Performing S&P 500 Index Stocks | ||||||||||||||||||||||||||||||||||||||||||||||||
 The top performing S&P 500 Index stocks year to date are
Now, more recently, over last week, the top performing S&P 500 Index stocks on the move are


|
||||||||||||||||||||||||||||||||||||||||||||||||
| 12Stocks.com: Investing in S&P 500 Index with Stocks | |
|
The following table helps investors and traders sort through current performance and trends (as measured by Smart Investing & Trading Score) of various
stocks in the S&P 500 Index. Quick View: Move mouse or cursor over stock symbol (ticker) to view short-term technical chart and over stock name to view long term chart. Click on  to add stock symbol to your watchlist and to add stock symbol to your watchlist and  to view watchlist. Click on any ticker or stock name for detailed market intelligence report for that stock. to view watchlist. Click on any ticker or stock name for detailed market intelligence report for that stock. |
12Stocks.com Performance of Stocks in S&P 500 Index
| Ticker | Stock Name | Watchlist | Category | Recent Price | Smart Investing & Trading Score | Change % | YTD Change% |
| FE | First |   | Utilities | 38.57 | 93 | 0.70% | 5.21% |
| FAST | Fastenal | | Services & Goods | 68.14 | 32 | 0.59% | 5.20% |
| AON | Aon | | Financials | 306.00 | 43 | -0.92% | 5.15% |
| DLR | Digital Realty | | Financials | 141.49 | 48 | 0.63% | 5.13% |
| PKG | Packaging | | Consumer Staples | 171.25 | 26 | -1.54% | 5.12% |
| FDX | FedEx | | Transports | 265.52 | 43 | -0.21% | 4.96% |
| CPB | Campbell Soup | | Consumer Staples | 45.37 | 88 | -0.37% | 4.95% |
| DG | Dollar General | | Services & Goods | 142.65 | 54 | -0.36% | 4.93% |
| EXC | Exelon | | Utilities | 37.66 | 81 | -0.29% | 4.90% |
| NEM | Newmont | | Materials | 43.41 | 100 | 12.46% | 4.88% |
| LYB | LyondellBasell Industries | | Materials | 99.68 | 36 | -1.09% | 4.84% |
| KO | Coca-Cola | | Consumer Staples | 61.74 | 100 | 0.31% | 4.77% |
| MPWR | Monolithic Power | | Technology | 660.34 | 68 | 2.82% | 4.69% |
| WST | West Pharmaceutical | | Health Care | 368.18 | 61 | -4.55% | 4.56% |
| K | Kellogg | | Consumer Staples | 58.45 | 100 | -0.51% | 4.54% |
| EQT | EQT | | Energy | 40.41 | 100 | 2.49% | 4.53% |
| PYPL | PayPal Holdings | | Financials | 64.10 | 61 | -1.14% | 4.38% |
| MAS | Masco | | Industrials | 69.87 | 36 | 0.19% | 4.31% |
| AMD | Advanced Micro | | Technology | 153.76 | 32 | 1.33% | 4.31% |
| NOC | Northrop Grumman | | Industrials | 488.06 | 100 | 2.84% | 4.26% |
| OTIS | Otis Worldwide | | Industrials | 93.28 | 26 | -0.10% | 4.26% |
| WELL | Welltower | | Financials | 94.00 | 80 | 0.32% | 4.25% |
| IFF | Flavors | | Materials | 84.34 | 51 | -0.94% | 4.16% |
| CMS | CMS | | Utilities | 60.48 | 93 | 0.33% | 4.15% |
| BAX | Baxter | | Health Care | 40.23 | 53 | -1.71% | 4.06% |
| For chart view version of above stock list: Chart View ➞ 0 - 25 , 25 - 50 , 50 - 75 , 75 - 100 , 100 - 125 , 125 - 150 , 150 - 175 , 175 - 200 , 200 - 225 , 225 - 250 , 250 - 275 , 275 - 300 , 300 - 325 , 325 - 350 , 350 - 375 , 375 - 400 , 400 - 425 , 425 - 450 , 450 - 475 , 475 - 500 | ||
 | Click To Change The Sort Order: By Market Cap or Company Size Performance: Year-to-date, Week and Day |  |
|
Get the most comprehensive stock market coverage daily at 12Stocks.com ➞ Best Stocks Today ➞ Best Stocks Weekly ➞ Best Stocks Year-to-Date ➞ Best Stocks Trends ➞  Best Stocks Today 12Stocks.com Best Nasdaq Stocks ➞ Best S&P 500 Stocks ➞ Best Tech Stocks ➞ Best Biotech Stocks ➞ |
| Detailed Overview of S&P 500 Stocks |
| S&P 500 Technical Overview, Leaders & Laggards, Top S&P 500 ETF Funds & Detailed S&P 500 Stocks List, Charts, Trends & More |
| S&P 500: Technical Analysis, Trends & YTD Performance | |
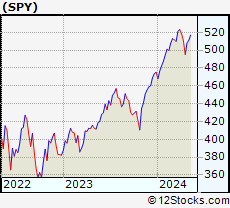
| S&P 500 index as represented by
SPY, an exchange-traded fund [ETF], holds basket of five hundred (mostly largecap) stocks from across all major sectors of the US stock market. The S&P 500 index (contains stocks like Apple and Exxon) is up by 5.93% and is currently outperforming the overall market by 0.77% year-to-date. Below is a quick view of technical charts and trends: | |
 SPY Weekly Chart |
|
| Long Term Trend: Good | |
| Medium Term Trend: Not Good | |
 SPY Daily Chart |
|
| Short Term Trend: Very Good | |
| Overall Trend Score: 44 | |
| YTD Performance: 5.93% | |
| **Trend Scores & Views Are Only For Educational Purposes And Not For Investing | |
| 12Stocks.com: Investing in S&P 500 Index using Exchange Traded Funds | |
|
The following table shows list of key exchange traded funds (ETF) that
help investors track S&P 500 index. The following list also includes leveraged ETF funds that track twice or thrice the daily returns of S&P 500 indices. Short or inverse ETF funds move in the opposite direction to the index they track and are useful during market pullbacks or during bear markets. Quick View: Move mouse or cursor over ETF symbol (ticker) to view short-term technical chart and over ETF name to view long term chart. Click on ticker or stock name for detailed view. Click on to add stock symbol to your watchlist and to view watchlist. |
12Stocks.com List of ETFs that track S&P 500 Index
| Ticker | ETF Name | Watchlist | Recent Price | Smart Investing & Trading Score | Change % | Week % | Year-to-date % |
| SPY | SPDR S&P 500 ETF | | 503.49 | 44 | -0.38 | 1.68 | 5.93% |
| IVV | iShares Core S&P 500 ETF | | 505.82 | 56 | -0.42 | 1.67 | 5.9% |
| VOO | Vanguard 500 ETF | | 462.58 | 56 | -0.41 | 1.64 | 5.9% |
| OEF | iShares S&P 100 | | 238.34 | 44 | -0.60 | 1.56 | 6.69% |
| SSO | ProShares Ultra S&P500 | | 71.32 | 51 | -0.88 | 3.2 | 9.61% |
| UPRO | ProShares UltraPro S&P500 | | 62.03 | 51 | -1.35 | 4.85 | 13.32% |
| SPXL | Direxion Daily S&P500 Bull 3X ETF | | 117.84 | 56 | -1.27 | 4.7 | 13.32% |
| SH | ProShares Short S&P500 | | 12.39 | 57 | 0.49 | -1.59 | -4.62% |
| SDS | ProShares UltraShort S&P500 | | 27.04 | 49 | 0.90 | -3.08 | -9.63% |
| SPXU | ProShares UltraPro Short S&P500 | | 36.52 | 49 | 1.33 | -4.72 | -15.07% |
| SPXS | Direxion Daily S&P 500 Bear 3X ETF | | 9.88 | 32 | 1.33 | -4.63 | -14.46% |
| 12Stocks.com: Charts, Trends, Fundamental Data and Performances of S&P 500 Stocks | |
|
We now take in-depth look at all S&P 500 stocks including charts, multi-period performances and overall trends (as measured by Smart Investing & Trading Score). One can sort S&P 500 stocks (click link to choose) by Daily, Weekly and by Year-to-Date performances. Also, one can sort by size of the company or by market capitalization. |
| Select Your Default Chart Type: | |||||
| |||||
| Click on stock symbol or name for detailed view. Click on to add stock symbol to your watchlist and to view watchlist. Quick View: Move mouse or cursor over "Daily" to quickly view daily technical stock chart and over "Weekly" to view weekly technical stock chart. | |||||

 | FE FirstEnergy Corp. |
| Sector: Utilities | |
| SubSector: Electric Utilities | |
| MarketCap: 20754.1 Millions | |
| Recent Price: 38.57 Smart Investing & Trading Score: 93 | |
| Day Percent Change: 0.70% Day Change: 0.27 | |
| Week Change: 1.05% Year-to-date Change: 5.2% | |
| FE Links: Profile News Message Board | |
| Charts:- Daily , Weekly | |
| Add FE to Watchlist: View: Get FE Trend Analysis ➞ | |
 | FAST Fastenal Company |
| Sector: Services & Goods | |
| SubSector: Industrial Equipment Wholesale | |
| MarketCap: 17609.9 Millions | |
| Recent Price: 68.14 Smart Investing & Trading Score: 32 | |
| Day Percent Change: 0.59% Day Change: 0.40 | |
| Week Change: 0.84% Year-to-date Change: 5.2% | |
| FAST Links: Profile News Message Board | |
| Charts:- Daily , Weekly | |
| Add FAST to Watchlist: View: Get FAST Trend Analysis ➞ | |
 | AON Aon plc |
| Sector: Financials | |
| SubSector: Insurance Brokers | |
| MarketCap: 36870.1 Millions | |
| Recent Price: 306.00 Smart Investing & Trading Score: 43 | |
| Day Percent Change: -0.92% Day Change: -2.83 | |
| Week Change: -1.35% Year-to-date Change: 5.2% | |
| AON Links: Profile News Message Board | |
| Charts:- Daily , Weekly | |
| Add AON to Watchlist: View: Get AON Trend Analysis ➞ | |
 | DLR Digital Realty Trust, Inc. |
| Sector: Financials | |
| SubSector: REIT - Office | |
| MarketCap: 27038.6 Millions | |
| Recent Price: 141.49 Smart Investing & Trading Score: 48 | |
| Day Percent Change: 0.63% Day Change: 0.88 | |
| Week Change: 3.41% Year-to-date Change: 5.1% | |
| DLR Links: Profile News Message Board | |
| Charts:- Daily , Weekly | |
| Add DLR to Watchlist: View: Get DLR Trend Analysis ➞ | |
 | PKG Packaging Corporation of America |
| Sector: Consumer Staples | |
| SubSector: Packaging & Containers | |
| MarketCap: 8963 Millions | |
| Recent Price: 171.25 Smart Investing & Trading Score: 26 | |
| Day Percent Change: -1.54% Day Change: -2.67 | |
| Week Change: -4.8% Year-to-date Change: 5.1% | |
| PKG Links: Profile News Message Board | |
| Charts:- Daily , Weekly | |
| Add PKG to Watchlist: View: Get PKG Trend Analysis ➞ | |
 | FDX FedEx Corporation |
| Sector: Transports | |
| SubSector: Air Delivery & Freight Services | |
| MarketCap: 33188 Millions | |
| Recent Price: 265.52 Smart Investing & Trading Score: 43 | |
| Day Percent Change: -0.21% Day Change: -0.55 | |
| Week Change: -0.55% Year-to-date Change: 5.0% | |
| FDX Links: Profile News Message Board | |
| Charts:- Daily , Weekly | |
| Add FDX to Watchlist: View: Get FDX Trend Analysis ➞ | |
 | CPB Campbell Soup Company |
| Sector: Consumer Staples | |
| SubSector: Processed & Packaged Goods | |
| MarketCap: 14468.8 Millions | |
| Recent Price: 45.37 Smart Investing & Trading Score: 88 | |
| Day Percent Change: -0.37% Day Change: -0.17 | |
| Week Change: 2.65% Year-to-date Change: 5.0% | |
| CPB Links: Profile News Message Board | |
| Charts:- Daily , Weekly | |
| Add CPB to Watchlist: View: Get CPB Trend Analysis ➞ | |
 | DG Dollar General Corporation |
| Sector: Services & Goods | |
| SubSector: Discount, Variety Stores | |
| MarketCap: 39611.9 Millions | |
| Recent Price: 142.65 Smart Investing & Trading Score: 54 | |
| Day Percent Change: -0.36% Day Change: -0.51 | |
| Week Change: -1.5% Year-to-date Change: 4.9% | |
| DG Links: Profile News Message Board | |
| Charts:- Daily , Weekly | |
| Add DG to Watchlist: View: Get DG Trend Analysis ➞ | |
 | EXC Exelon Corporation |
| Sector: Utilities | |
| SubSector: Diversified Utilities | |
| MarketCap: 34091.9 Millions | |
| Recent Price: 37.66 Smart Investing & Trading Score: 81 | |
| Day Percent Change: -0.29% Day Change: -0.11 | |
| Week Change: 0.29% Year-to-date Change: 4.9% | |
| EXC Links: Profile News Message Board | |
| Charts:- Daily , Weekly | |
| Add EXC to Watchlist: View: Get EXC Trend Analysis ➞ | |
 | NEM Newmont Corporation |
| Sector: Materials | |
| SubSector: Gold | |
| MarketCap: 33928.8 Millions | |
| Recent Price: 43.41 Smart Investing & Trading Score: 100 | |
| Day Percent Change: 12.46% Day Change: 4.81 | |
| Week Change: 11.25% Year-to-date Change: 4.9% | |
| NEM Links: Profile News Message Board | |
| Charts:- Daily , Weekly | |
| Add NEM to Watchlist: View: Get NEM Trend Analysis ➞ | |
 | LYB LyondellBasell Industries N.V. |
| Sector: Materials | |
| SubSector: Specialty Chemicals | |
| MarketCap: 16420.7 Millions | |
| Recent Price: 99.68 Smart Investing & Trading Score: 36 | |
| Day Percent Change: -1.09% Day Change: -1.10 | |
| Week Change: -1.05% Year-to-date Change: 4.8% | |
| LYB Links: Profile News Message Board | |
| Charts:- Daily , Weekly | |
| Add LYB to Watchlist: View: Get LYB Trend Analysis ➞ | |
 | KO The Coca-Cola Company |
| Sector: Consumer Staples | |
| SubSector: Beverages - Soft Drinks | |
| MarketCap: 182046 Millions | |
| Recent Price: 61.74 Smart Investing & Trading Score: 100 | |
| Day Percent Change: 0.31% Day Change: 0.19 | |
| Week Change: 2.61% Year-to-date Change: 4.8% | |
| KO Links: Profile News Message Board | |
| Charts:- Daily , Weekly | |
| Add KO to Watchlist: View: Get KO Trend Analysis ➞ | |
 | MPWR Monolithic Power Systems, Inc. |
| Sector: Technology | |
| SubSector: Semiconductor - Specialized | |
| MarketCap: 6436.4 Millions | |
| Recent Price: 660.34 Smart Investing & Trading Score: 68 | |
| Day Percent Change: 2.82% Day Change: 18.13 | |
| Week Change: 11.63% Year-to-date Change: 4.7% | |
| MPWR Links: Profile News Message Board | |
| Charts:- Daily , Weekly | |
| Add MPWR to Watchlist: View: Get MPWR Trend Analysis ➞ | |
 | WST West Pharmaceutical Services, Inc. |
| Sector: Health Care | |
| SubSector: Medical Instruments & Supplies | |
| MarketCap: 9989 Millions | |
| Recent Price: 368.18 Smart Investing & Trading Score: 61 | |
| Day Percent Change: -4.55% Day Change: -17.55 | |
| Week Change: -1.04% Year-to-date Change: 4.6% | |
| WST Links: Profile News Message Board | |
| Charts:- Daily , Weekly | |
| Add WST to Watchlist: View: Get WST Trend Analysis ➞ | |
 | K Kellogg Company |
| Sector: Consumer Staples | |
| SubSector: Processed & Packaged Goods | |
| MarketCap: 20264.6 Millions | |
| Recent Price: 58.45 Smart Investing & Trading Score: 100 | |
| Day Percent Change: -0.51% Day Change: -0.30 | |
| Week Change: 1.86% Year-to-date Change: 4.5% | |
| K Links: Profile News Message Board | |
| Charts:- Daily , Weekly | |
| Add K to Watchlist: View: Get K Trend Analysis ➞ | |
 | EQT EQT Corporation |
| Sector: Energy | |
| SubSector: Independent Oil & Gas | |
| MarketCap: 1886.63 Millions | |
| Recent Price: 40.41 Smart Investing & Trading Score: 100 | |
| Day Percent Change: 2.49% Day Change: 0.98 | |
| Week Change: 10.26% Year-to-date Change: 4.5% | |
| EQT Links: Profile News Message Board | |
| Charts:- Daily , Weekly | |
| Add EQT to Watchlist: View: Get EQT Trend Analysis ➞ | |
 | PYPL PayPal Holdings, Inc. |
| Sector: Financials | |
| SubSector: Credit Services | |
| MarketCap: 108949 Millions | |
| Recent Price: 64.10 Smart Investing & Trading Score: 61 | |
| Day Percent Change: -1.14% Day Change: -0.74 | |
| Week Change: 2.87% Year-to-date Change: 4.4% | |
| PYPL Links: Profile News Message Board | |
| Charts:- Daily , Weekly | |
| Add PYPL to Watchlist: View: Get PYPL Trend Analysis ➞ | |
 | MAS Masco Corporation |
| Sector: Industrials | |
| SubSector: General Building Materials | |
| MarketCap: 8655.63 Millions | |
| Recent Price: 69.87 Smart Investing & Trading Score: 36 | |
| Day Percent Change: 0.19% Day Change: 0.13 | |
| Week Change: -2.84% Year-to-date Change: 4.3% | |
| MAS Links: Profile News Message Board | |
| Charts:- Daily , Weekly | |
| Add MAS to Watchlist: View: Get MAS Trend Analysis ➞ | |
 | AMD Advanced Micro Devices, Inc. |
| Sector: Technology | |
| SubSector: Semiconductor - Broad Line | |
| MarketCap: 54275.1 Millions | |
| Recent Price: 153.76 Smart Investing & Trading Score: 32 | |
| Day Percent Change: 1.33% Day Change: 2.02 | |
| Week Change: 4.86% Year-to-date Change: 4.3% | |
| AMD Links: Profile News Message Board | |
| Charts:- Daily , Weekly | |
| Add AMD to Watchlist: View: Get AMD Trend Analysis ➞ | |
 | NOC Northrop Grumman Corporation |
| Sector: Industrials | |
| SubSector: Aerospace/Defense - Major Diversified | |
| MarketCap: 52094.9 Millions | |
| Recent Price: 488.06 Smart Investing & Trading Score: 100 | |
| Day Percent Change: 2.84% Day Change: 13.49 | |
| Week Change: 5.51% Year-to-date Change: 4.3% | |
| NOC Links: Profile News Message Board | |
| Charts:- Daily , Weekly | |
| Add NOC to Watchlist: View: Get NOC Trend Analysis ➞ | |
 | OTIS Otis Worldwide Corporation |
| Sector: Industrials | |
| SubSector: Specialty Industrial Machinery | |
| MarketCap: 27727 Millions | |
| Recent Price: 93.28 Smart Investing & Trading Score: 26 | |
| Day Percent Change: -0.10% Day Change: -0.09 | |
| Week Change: -2.61% Year-to-date Change: 4.3% | |
| OTIS Links: Profile News Message Board | |
| Charts:- Daily , Weekly | |
| Add OTIS to Watchlist: View: Get OTIS Trend Analysis ➞ | |
 | WELL Welltower Inc. |
| Sector: Financials | |
| SubSector: REIT - Healthcare Facilities | |
| MarketCap: 21398.8 Millions | |
| Recent Price: 94.00 Smart Investing & Trading Score: 80 | |
| Day Percent Change: 0.32% Day Change: 0.30 | |
| Week Change: 2.93% Year-to-date Change: 4.3% | |
| WELL Links: Profile News Message Board | |
| Charts:- Daily , Weekly | |
| Add WELL to Watchlist: View: Get WELL Trend Analysis ➞ | |
 | IFF International Flavors & Fragrances Inc. |
| Sector: Materials | |
| SubSector: Specialty Chemicals | |
| MarketCap: 12178.7 Millions | |
| Recent Price: 84.34 Smart Investing & Trading Score: 51 | |
| Day Percent Change: -0.94% Day Change: -0.80 | |
| Week Change: 0.44% Year-to-date Change: 4.2% | |
| IFF Links: Profile News Message Board | |
| Charts:- Daily , Weekly | |
| Add IFF to Watchlist: View: Get IFF Trend Analysis ➞ | |
 | CMS CMS Energy Corporation |
| Sector: Utilities | |
| SubSector: Electric Utilities | |
| MarketCap: 15105.8 Millions | |
| Recent Price: 60.48 Smart Investing & Trading Score: 93 | |
| Day Percent Change: 0.33% Day Change: 0.20 | |
| Week Change: 1.56% Year-to-date Change: 4.2% | |
| CMS Links: Profile News Message Board | |
| Charts:- Daily , Weekly | |
| Add CMS to Watchlist: View: Get CMS Trend Analysis ➞ | |
 | BAX Baxter International Inc. |
| Sector: Health Care | |
| SubSector: Medical Instruments & Supplies | |
| MarketCap: 39955.8 Millions | |
| Recent Price: 40.23 Smart Investing & Trading Score: 53 | |
| Day Percent Change: -1.71% Day Change: -0.70 | |
| Week Change: 1.93% Year-to-date Change: 4.1% | |
| BAX Links: Profile News Message Board | |
| Charts:- Daily , Weekly | |
| Add BAX to Watchlist: View: Get BAX Trend Analysis ➞ | |
| For tabular summary view of above stock list: Summary View ➞ 0 - 25 , 25 - 50 , 50 - 75 , 75 - 100 , 100 - 125 , 125 - 150 , 150 - 175 , 175 - 200 , 200 - 225 , 225 - 250 , 250 - 275 , 275 - 300 , 300 - 325 , 325 - 350 , 350 - 375 , 375 - 400 , 400 - 425 , 425 - 450 , 450 - 475 , 475 - 500 | ||
| Click To Change The Sort Order: By Market Cap or Company Size Performance: Year-to-date, Week and Day | |
| Select Chart Type: | ||
|
Best Stocks Today 12Stocks.com |
© 2024 12Stocks.com Terms & Conditions Privacy Contact Us
All Information Provided Only For Education And Not To Be Used For Investing or Trading. See Terms & Conditions


One More Thing ... Get Best Stocks Delivered Daily!
Never Ever Miss A Move With Our Top Ten Stocks Lists
Find Best Stocks In Any Market - Bull or Bear Market
Take A Peek At Our Top Ten Stocks Lists: Daily, Weekly, Year-to-Date & Top Trends
Find Best Stocks In Any Market - Bull or Bear Market
Take A Peek At Our Top Ten Stocks Lists: Daily, Weekly, Year-to-Date & Top Trends
S&P 500 Stocks With Best Up Trends [0-bearish to 100-bullish]: Newmont [100], Teradyne [100], Chipotle Mexican[100], Dover [100], Merck [100], Northrop Grumman[100], Tractor Supply[100], EQT [100], Microchip [100], Hess [100], Altria [100]
Best S&P 500 Stocks Year-to-Date:
NVIDIA [66.86%], Constellation [60.54%], NRG [40.93%], Chipotle Mexican[36.07%], Targa Resources[35.47%], Marathon [34.48%], Diamondback [33.54%], Western Digital[32.59%], Progressive [31.89%], Eaton [31.68%], Micron [30.75%] Best S&P 500 Stocks This Week:
Hasbro [17.55%], Tesla [15.73%], Tyler Technologies[13.57%], Teradyne [13.48%], Wabtec [13.19%], Globe Life[13.19%], Microchip [12.89%], Monolithic Power[11.63%], Newmont [11.25%], NXP Semiconductors[10.67%], EQT [10.26%] Best S&P 500 Stocks Daily:
Newmont [12.46%], Tyler Technologies[9.32%], Teradyne [8.15%], Carrier Global[7.19%], Chipotle Mexican[6.33%], United Rentals[5.45%], Zebra Technologies[5.40%], Union Pacific[4.99%], Tesla [4.97%], Keurig Dr[4.73%], Dover [4.47%]