
 Login Sign Up


| |||||
 |  | ||||

| 12Stocks.com Market Intelligence |
Best S&P 500 Stocks
|
On this page, you will find the most comprehensive analysis of S&P 500 stocks and ETFs - from latest trends to performances to charts ➞. First, here are the year-to-date (YTD) performances of the most requested S&P 500 stocks at 12Stocks.com (click stock for review):
| NVIDIA 66% | ||
| Caterpillar 23% | ||
| Amazon.com 17% | ||
| Merck 17% | ||
| Google 13% | ||
| JPMorgan Chase 13% | ||
| Walmart 12% | ||
| Goldman Sachs 9% | ||
| Chevron 8% | ||
| Microsoft 8% | ||
| Johnson & Johnson -5% | ||
| McDonald s -7% | ||
| Starbucks -8% | ||
| Apple -13% | ||
| Gilead -17% | ||
| Intel -31% | ||
| Boeing -35% | ||
| Quick: S&P 500 Stocks Lists: Performances & Trends, S&P 500 Stock Charts
Sort S&P 500 stocks: Daily, Weekly, Year-to-Date, Market Cap & Trends. Filter S&P 500 stocks list by sector: Show all, Tech, Finance, Energy, Staples, Retail, Industrial, Materials, Utilities and HealthCare |
| 12Stocks.com S&P 500 Stocks Performances & Trends Daily Report | |||||||||
|
| 
The overall Smart Investing & Trading Score is 58 (0-bearish to 100-bullish) which puts S&P 500 index in short term neutral trend. The Smart Investing & Trading Score from previous trading session is 51 and hence an improvement of trend. | ||||||||
Here are the Smart Investing & Trading Scores of the most requested S&P 500 stocks at 12Stocks.com (click stock name for detailed review):
|


| 12Stocks.com: Top Performing S&P 500 Index Stocks | ||||||||||||||||||||||||||||||||||||||||||||||||
 The top performing S&P 500 Index stocks year to date are
Now, more recently, over last week, the top performing S&P 500 Index stocks on the move are


|
||||||||||||||||||||||||||||||||||||||||||||||||
| 12Stocks.com: Investing in S&P 500 Index with Stocks | |
|
The following table helps investors and traders sort through current performance and trends (as measured by Smart Investing & Trading Score) of various
stocks in the S&P 500 Index. Quick View: Move mouse or cursor over stock symbol (ticker) to view short-term technical chart and over stock name to view long term chart. Click on  to add stock symbol to your watchlist and to add stock symbol to your watchlist and  to view watchlist. Click on any ticker or stock name for detailed market intelligence report for that stock. to view watchlist. Click on any ticker or stock name for detailed market intelligence report for that stock. |
12Stocks.com Performance of Stocks in S&P 500 Index
| Ticker | Stock Name | Watchlist | Category | Recent Price | Smart Investing & Trading Score | Change % | YTD Change% |
| HST | Host Hotels |   | Financials | 19.16 | 45 | 0.87% | -1.57% |
| MDT | Medtronic | | Health Care | 80.83 | 32 | 0.32% | -1.89% |
| ES | Eversource | | Utilities | 60.53 | 100 | 0.39% | -1.92% |
| T | AT&T | | Technology | 16.45 | 39 | 0.89% | -1.94% |
| CSGP | CoStar | | Financials | 85.61 | 58 | 0.35% | -2.04% |
| ESS | Essex Property | | Financials | 242.63 | 100 | 1.14% | -2.14% |
| MCO | Moody s | | Services & Goods | 381.73 | 42 | 0.65% | -2.26% |
| LYV | Live Nation | | Services & Goods | 91.41 | 58 | 3.35% | -2.34% |
| ABT | Abbott | | Health Care | 107.46 | 32 | 0.36% | -2.37% |
| NXPI | NXP Semiconductors | | Technology | 224.13 | 58 | 2.50% | -2.42% |
| LNT | Alliant | | Utilities | 50.06 | 100 | 0.33% | -2.43% |
| UDR | UDR | | Financials | 37.31 | 100 | 0.80% | -2.57% |
| WEC | WEC | | Utilities | 82.00 | 100 | 0.04% | -2.58% |
| ROL | Rollins | | Services & Goods | 42.55 | 18 | 0.20% | -2.58% |
| HD | Home Depot | | Services & Goods | 337.57 | 32 | 0.43% | -2.59% |
| MPWR | Monolithic Power | | Technology | 612.90 | 43 | 2.04% | -2.83% |
| DHI | D.R. Horton | | Industrials | 147.52 | 58 | 3.11% | -2.93% |
| TXN | Texas Instruments | | Technology | 165.41 | 68 | 1.21% | -2.96% |
| MDLZ | Mondelez | | Consumer Staples | 70.06 | 64 | 0.94% | -3.27% |
| ROST | Ross Stores | | Services & Goods | 133.60 | 32 | -0.13% | -3.46% |
| BBY | Best Buy | | Services & Goods | 75.38 | 36 | 0.35% | -3.70% |
| BMY | Bristol-Myers | | Health Care | 49.38 | 75 | 0.49% | -3.76% |
| BDX | Becton Dickinson | | Health Care | 234.55 | 25 | 0.29% | -3.81% |
| HSIC | Henry Schein | | Services & Goods | 72.75 | 67 | 0.99% | -3.91% |
| UNP | Union Pacific | | Transports | 236.02 | 42 | 0.66% | -3.91% |
| For chart view version of above stock list: Chart View ➞ 0 - 25 , 25 - 50 , 50 - 75 , 75 - 100 , 100 - 125 , 125 - 150 , 150 - 175 , 175 - 200 , 200 - 225 , 225 - 250 , 250 - 275 , 275 - 300 , 300 - 325 , 325 - 350 , 350 - 375 , 375 - 400 , 400 - 425 , 425 - 450 , 450 - 475 | ||
 | Click To Change The Sort Order: By Market Cap or Company Size Performance: Year-to-date, Week and Day |  |
|
Get the most comprehensive stock market coverage daily at 12Stocks.com ➞ Best Stocks Today ➞ Best Stocks Weekly ➞ Best Stocks Year-to-Date ➞ Best Stocks Trends ➞  Best Stocks Today 12Stocks.com Best Nasdaq Stocks ➞ Best S&P 500 Stocks ➞ Best Tech Stocks ➞ Best Biotech Stocks ➞ |
| Detailed Overview of S&P 500 Stocks |
| S&P 500 Technical Overview, Leaders & Laggards, Top S&P 500 ETF Funds & Detailed S&P 500 Stocks List, Charts, Trends & More |
| S&P 500: Technical Analysis, Trends & YTD Performance | |
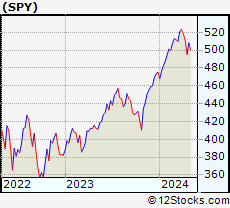
| S&P 500 index as represented by
SPY, an exchange-traded fund [ETF], holds basket of five hundred (mostly largecap) stocks from across all major sectors of the US stock market. The S&P 500 index (contains stocks like Apple and Exxon) is up by 6.12% and is currently outperforming the overall market by 0.63% year-to-date. Below is a quick view of technical charts and trends: | |
 SPY Weekly Chart |
|
| Long Term Trend: Good | |
| Medium Term Trend: Not Good | |
 SPY Daily Chart |
|
| Short Term Trend: Very Good | |
| Overall Trend Score: 58 | |
| YTD Performance: 6.12% | |
| **Trend Scores & Views Are Only For Educational Purposes And Not For Investing | |
| 12Stocks.com: Investing in S&P 500 Index using Exchange Traded Funds | |
|
The following table shows list of key exchange traded funds (ETF) that
help investors track S&P 500 index. The following list also includes leveraged ETF funds that track twice or thrice the daily returns of S&P 500 indices. Short or inverse ETF funds move in the opposite direction to the index they track and are useful during market pullbacks or during bear markets. Quick View: Move mouse or cursor over ETF symbol (ticker) to view short-term technical chart and over ETF name to view long term chart. Click on ticker or stock name for detailed view. Click on to add stock symbol to your watchlist and to view watchlist. |
12Stocks.com List of ETFs that track S&P 500 Index
| Ticker | ETF Name | Watchlist | Recent Price | Smart Investing & Trading Score | Change % | Week % | Year-to-date % |
| SPY | SPDR S&P 500 ETF | | 504.40 | 58 | 0.94 | 1.87 | 6.12% |
| IVV | iShares Core S&P 500 ETF | | 506.60 | 58 | 1.69 | 1.82 | 6.06% |
| VOO | Vanguard 500 ETF | | 463.37 | 58 | 1.70 | 1.82 | 6.08% |
| OEF | iShares S&P 100 | | 239.30 | 51 | 1.05 | 1.97 | 7.12% |
| SSO | ProShares Ultra S&P500 | | 71.67 | 58 | 1.91 | 3.7 | 10.14% |
| UPRO | ProShares UltraPro S&P500 | | 62.46 | 58 | 2.81 | 5.58 | 14.1% |
| SPXL | Direxion Daily S&P500 Bull 3X ETF | | 118.62 | 58 | 2.75 | 5.39 | 14.07% |
| SH | ProShares Short S&P500 | | 12.35 | 42 | -1.12 | -1.91 | -4.93% |
| SDS | ProShares UltraShort S&P500 | | 26.81 | 37 | -2.19 | -3.91 | -10.39% |
| SPXU | ProShares UltraPro Short S&P500 | | 36.10 | 42 | -3.31 | -5.8 | -16.03% |
| SPXS | Direxion Daily S&P 500 Bear 3X ETF | | 9.82 | 32 | -4.75 | -5.21 | -14.98% |
| 12Stocks.com: Charts, Trends, Fundamental Data and Performances of S&P 500 Stocks | |
|
We now take in-depth look at all S&P 500 stocks including charts, multi-period performances and overall trends (as measured by Smart Investing & Trading Score). One can sort S&P 500 stocks (click link to choose) by Daily, Weekly and by Year-to-Date performances. Also, one can sort by size of the company or by market capitalization. |
| Select Your Default Chart Type: | |||||
| |||||
| Click on stock symbol or name for detailed view. Click on to add stock symbol to your watchlist and to view watchlist. Quick View: Move mouse or cursor over "Daily" to quickly view daily technical stock chart and over "Weekly" to view weekly technical stock chart. | |||||

 | HST Host Hotels & Resorts, Inc. |
| Sector: Financials | |
| SubSector: REIT - Hotel/Motel | |
| MarketCap: 8253.74 Millions | |
| Recent Price: 19.16 Smart Investing & Trading Score: 45 | |
| Day Percent Change: 0.87% Day Change: 0.16 | |
| Week Change: 2.43% Year-to-date Change: -1.6% | |
| HST Links: Profile News Message Board | |
| Charts:- Daily , Weekly | |
| Add HST to Watchlist: View: Get HST Trend Analysis ➞ | |
 | MDT Medtronic plc |
| Sector: Health Care | |
| SubSector: Medical Appliances & Equipment | |
| MarketCap: 113698 Millions | |
| Recent Price: 80.83 Smart Investing & Trading Score: 32 | |
| Day Percent Change: 0.32% Day Change: 0.26 | |
| Week Change: 1.69% Year-to-date Change: -1.9% | |
| MDT Links: Profile News Message Board | |
| Charts:- Daily , Weekly | |
| Add MDT to Watchlist: View: Get MDT Trend Analysis ➞ | |
 | ES Eversource Energy |
| Sector: Utilities | |
| SubSector: Diversified Utilities | |
| MarketCap: 23963.4 Millions | |
| Recent Price: 60.53 Smart Investing & Trading Score: 100 | |
| Day Percent Change: 0.39% Day Change: 0.23 | |
| Week Change: 1.42% Year-to-date Change: -1.9% | |
| ES Links: Profile News Message Board | |
| Charts:- Daily , Weekly | |
| Add ES to Watchlist: View: Get ES Trend Analysis ➞ | |
 | T AT&T Inc. |
| Sector: Technology | |
| SubSector: Telecom Services - Domestic | |
| MarketCap: 224847 Millions | |
| Recent Price: 16.45 Smart Investing & Trading Score: 39 | |
| Day Percent Change: 0.89% Day Change: 0.14 | |
| Week Change: -0.33% Year-to-date Change: -1.9% | |
| T Links: Profile News Message Board | |
| Charts:- Daily , Weekly | |
| Add T to Watchlist: View: Get T Trend Analysis ➞ | |
 | CSGP CoStar Group, Inc. |
| Sector: Financials | |
| SubSector: Property Management | |
| MarketCap: 21454.4 Millions | |
| Recent Price: 85.61 Smart Investing & Trading Score: 58 | |
| Day Percent Change: 0.35% Day Change: 0.30 | |
| Week Change: 1.6% Year-to-date Change: -2.0% | |
| CSGP Links: Profile News Message Board | |
| Charts:- Daily , Weekly | |
| Add CSGP to Watchlist: View: Get CSGP Trend Analysis ➞ | |
 | ESS Essex Property Trust, Inc. |
| Sector: Financials | |
| SubSector: REIT - Residential | |
| MarketCap: 13725.5 Millions | |
| Recent Price: 242.63 Smart Investing & Trading Score: 100 | |
| Day Percent Change: 1.14% Day Change: 2.74 | |
| Week Change: 3.17% Year-to-date Change: -2.1% | |
| ESS Links: Profile News Message Board | |
| Charts:- Daily , Weekly | |
| Add ESS to Watchlist: View: Get ESS Trend Analysis ➞ | |
 | MCO Moody s Corporation |
| Sector: Services & Goods | |
| SubSector: Business Services | |
| MarketCap: 35998.5 Millions | |
| Recent Price: 381.73 Smart Investing & Trading Score: 42 | |
| Day Percent Change: 0.65% Day Change: 2.47 | |
| Week Change: 1.88% Year-to-date Change: -2.3% | |
| MCO Links: Profile News Message Board | |
| Charts:- Daily , Weekly | |
| Add MCO to Watchlist: View: Get MCO Trend Analysis ➞ | |
 | LYV Live Nation Entertainment, Inc. |
| Sector: Services & Goods | |
| SubSector: Entertainment - Diversified | |
| MarketCap: 8457.17 Millions | |
| Recent Price: 91.41 Smart Investing & Trading Score: 58 | |
| Day Percent Change: 3.35% Day Change: 2.96 | |
| Week Change: 1.61% Year-to-date Change: -2.3% | |
| LYV Links: Profile News Message Board | |
| Charts:- Daily , Weekly | |
| Add LYV to Watchlist: View: Get LYV Trend Analysis ➞ | |
 | ABT Abbott Laboratories |
| Sector: Health Care | |
| SubSector: Medical Appliances & Equipment | |
| MarketCap: 125288 Millions | |
| Recent Price: 107.46 Smart Investing & Trading Score: 32 | |
| Day Percent Change: 0.36% Day Change: 0.39 | |
| Week Change: 0.17% Year-to-date Change: -2.4% | |
| ABT Links: Profile News Message Board | |
| Charts:- Daily , Weekly | |
| Add ABT to Watchlist: View: Get ABT Trend Analysis ➞ | |
 | NXPI NXP Semiconductors N.V. |
| Sector: Technology | |
| SubSector: Semiconductor - Broad Line | |
| MarketCap: 22497.9 Millions | |
| Recent Price: 224.13 Smart Investing & Trading Score: 58 | |
| Day Percent Change: 2.50% Day Change: 5.47 | |
| Week Change: 4.19% Year-to-date Change: -2.4% | |
| NXPI Links: Profile News Message Board | |
| Charts:- Daily , Weekly | |
| Add NXPI to Watchlist: View: Get NXPI Trend Analysis ➞ | |
 | LNT Alliant Energy Corporation |
| Sector: Utilities | |
| SubSector: Electric Utilities | |
| MarketCap: 10678.4 Millions | |
| Recent Price: 50.06 Smart Investing & Trading Score: 100 | |
| Day Percent Change: 0.33% Day Change: 0.16 | |
| Week Change: 0.47% Year-to-date Change: -2.4% | |
| LNT Links: Profile News Message Board | |
| Charts:- Daily , Weekly | |
| Add LNT to Watchlist: View: Get LNT Trend Analysis ➞ | |
 | UDR UDR, Inc. |
| Sector: Financials | |
| SubSector: REIT - Residential | |
| MarketCap: 10180.1 Millions | |
| Recent Price: 37.31 Smart Investing & Trading Score: 100 | |
| Day Percent Change: 0.80% Day Change: 0.30 | |
| Week Change: 2.49% Year-to-date Change: -2.6% | |
| UDR Links: Profile News Message Board | |
| Charts:- Daily , Weekly | |
| Add UDR to Watchlist: View: Get UDR Trend Analysis ➞ | |
 | WEC WEC Energy Group, Inc. |
| Sector: Utilities | |
| SubSector: Electric Utilities | |
| MarketCap: 24852 Millions | |
| Recent Price: 82.00 Smart Investing & Trading Score: 100 | |
| Day Percent Change: 0.04% Day Change: 0.03 | |
| Week Change: 0.54% Year-to-date Change: -2.6% | |
| WEC Links: Profile News Message Board | |
| Charts:- Daily , Weekly | |
| Add WEC to Watchlist: View: Get WEC Trend Analysis ➞ | |
 | ROL Rollins, Inc. |
| Sector: Services & Goods | |
| SubSector: Business Services | |
| MarketCap: 12827.4 Millions | |
| Recent Price: 42.55 Smart Investing & Trading Score: 18 | |
| Day Percent Change: 0.20% Day Change: 0.09 | |
| Week Change: 0.08% Year-to-date Change: -2.6% | |
| ROL Links: Profile News Message Board | |
| Charts:- Daily , Weekly | |
| Add ROL to Watchlist: View: Get ROL Trend Analysis ➞ | |
 | HD The Home Depot, Inc. |
| Sector: Services & Goods | |
| SubSector: Home Improvement Stores | |
| MarketCap: 185389 Millions | |
| Recent Price: 337.57 Smart Investing & Trading Score: 32 | |
| Day Percent Change: 0.43% Day Change: 1.46 | |
| Week Change: 0.66% Year-to-date Change: -2.6% | |
| HD Links: Profile News Message Board | |
| Charts:- Daily , Weekly | |
| Add HD to Watchlist: View: Get HD Trend Analysis ➞ | |
 | MPWR Monolithic Power Systems, Inc. |
| Sector: Technology | |
| SubSector: Semiconductor - Specialized | |
| MarketCap: 6436.4 Millions | |
| Recent Price: 612.90 Smart Investing & Trading Score: 43 | |
| Day Percent Change: 2.04% Day Change: 12.27 | |
| Week Change: 3.61% Year-to-date Change: -2.8% | |
| MPWR Links: Profile News Message Board | |
| Charts:- Daily , Weekly | |
| Add MPWR to Watchlist: View: Get MPWR Trend Analysis ➞ | |
 | DHI D.R. Horton, Inc. |
| Sector: Industrials | |
| SubSector: Residential Construction | |
| MarketCap: 13372.6 Millions | |
| Recent Price: 147.52 Smart Investing & Trading Score: 58 | |
| Day Percent Change: 3.11% Day Change: 4.45 | |
| Week Change: 3.75% Year-to-date Change: -2.9% | |
| DHI Links: Profile News Message Board | |
| Charts:- Daily , Weekly | |
| Add DHI to Watchlist: View: Get DHI Trend Analysis ➞ | |
 | TXN Texas Instruments Incorporated |
| Sector: Technology | |
| SubSector: Semiconductor - Broad Line | |
| MarketCap: 99509.1 Millions | |
| Recent Price: 165.41 Smart Investing & Trading Score: 68 | |
| Day Percent Change: 1.21% Day Change: 1.98 | |
| Week Change: 3.59% Year-to-date Change: -3.0% | |
| TXN Links: Profile News Message Board | |
| Charts:- Daily , Weekly | |
| Add TXN to Watchlist: View: Get TXN Trend Analysis ➞ | |
 | MDLZ Mondelez International, Inc. |
| Sector: Consumer Staples | |
| SubSector: Confectioners | |
| MarketCap: 68385.8 Millions | |
| Recent Price: 70.06 Smart Investing & Trading Score: 64 | |
| Day Percent Change: 0.94% Day Change: 0.65 | |
| Week Change: 2.86% Year-to-date Change: -3.3% | |
| MDLZ Links: Profile News Message Board | |
| Charts:- Daily , Weekly | |
| Add MDLZ to Watchlist: View: Get MDLZ Trend Analysis ➞ | |
 | ROST Ross Stores, Inc. |
| Sector: Services & Goods | |
| SubSector: Apparel Stores | |
| MarketCap: 24938.8 Millions | |
| Recent Price: 133.60 Smart Investing & Trading Score: 32 | |
| Day Percent Change: -0.13% Day Change: -0.17 | |
| Week Change: 0.19% Year-to-date Change: -3.5% | |
| ROST Links: Profile News Message Board | |
| Charts:- Daily , Weekly | |
| Add ROST to Watchlist: View: Get ROST Trend Analysis ➞ | |
 | BBY Best Buy Co., Inc. |
| Sector: Services & Goods | |
| SubSector: Electronics Stores | |
| MarketCap: 15771.3 Millions | |
| Recent Price: 75.38 Smart Investing & Trading Score: 36 | |
| Day Percent Change: 0.35% Day Change: 0.26 | |
| Week Change: -1.01% Year-to-date Change: -3.7% | |
| BBY Links: Profile News Message Board | |
| Charts:- Daily , Weekly | |
| Add BBY to Watchlist: View: Get BBY Trend Analysis ➞ | |
 | BMY Bristol-Myers Squibb Company |
| Sector: Health Care | |
| SubSector: Drug Manufacturers - Major | |
| MarketCap: 117052 Millions | |
| Recent Price: 49.38 Smart Investing & Trading Score: 75 | |
| Day Percent Change: 0.49% Day Change: 0.24 | |
| Week Change: 0.92% Year-to-date Change: -3.8% | |
| BMY Links: Profile News Message Board | |
| Charts:- Daily , Weekly | |
| Add BMY to Watchlist: View: Get BMY Trend Analysis ➞ | |
 | BDX Becton, Dickinson and Company |
| Sector: Health Care | |
| SubSector: Medical Instruments & Supplies | |
| MarketCap: 62758.4 Millions | |
| Recent Price: 234.55 Smart Investing & Trading Score: 25 | |
| Day Percent Change: 0.29% Day Change: 0.67 | |
| Week Change: 0.18% Year-to-date Change: -3.8% | |
| BDX Links: Profile News Message Board | |
| Charts:- Daily , Weekly | |
| Add BDX to Watchlist: View: Get BDX Trend Analysis ➞ | |
 | HSIC Henry Schein, Inc. |
| Sector: Services & Goods | |
| SubSector: Medical Equipment Wholesale | |
| MarketCap: 6760.9 Millions | |
| Recent Price: 72.75 Smart Investing & Trading Score: 67 | |
| Day Percent Change: 0.99% Day Change: 0.71 | |
| Week Change: 2.67% Year-to-date Change: -3.9% | |
| HSIC Links: Profile News Message Board | |
| Charts:- Daily , Weekly | |
| Add HSIC to Watchlist: View: Get HSIC Trend Analysis ➞ | |
 | UNP Union Pacific Corporation |
| Sector: Transports | |
| SubSector: Railroads | |
| MarketCap: 87198.1 Millions | |
| Recent Price: 236.02 Smart Investing & Trading Score: 42 | |
| Day Percent Change: 0.66% Day Change: 1.55 | |
| Week Change: 1.7% Year-to-date Change: -3.9% | |
| UNP Links: Profile News Message Board | |
| Charts:- Daily , Weekly | |
| Add UNP to Watchlist: View: Get UNP Trend Analysis ➞ | |
| For tabular summary view of above stock list: Summary View ➞ 0 - 25 , 25 - 50 , 50 - 75 , 75 - 100 , 100 - 125 , 125 - 150 , 150 - 175 , 175 - 200 , 200 - 225 , 225 - 250 , 250 - 275 , 275 - 300 , 300 - 325 , 325 - 350 , 350 - 375 , 375 - 400 , 400 - 425 , 425 - 450 , 450 - 475 | ||
| Click To Change The Sort Order: By Market Cap or Company Size Performance: Year-to-date, Week and Day | |
| Select Chart Type: | ||
|
Best Stocks Today 12Stocks.com |
© 2024 12Stocks.com Terms & Conditions Privacy Contact Us
All Information Provided Only For Education And Not To Be Used For Investing or Trading. See Terms & Conditions


One More Thing ... Get Best Stocks Delivered Daily!
Never Ever Miss A Move With Our Top Ten Stocks Lists
Find Best Stocks In Any Market - Bull or Bear Market
Take A Peek At Our Top Ten Stocks Lists: Daily, Weekly, Year-to-Date & Top Trends
Find Best Stocks In Any Market - Bull or Bear Market
Take A Peek At Our Top Ten Stocks Lists: Daily, Weekly, Year-to-Date & Top Trends
S&P 500 Stocks With Best Up Trends [0-bearish to 100-bullish]: Danaher [100], Kimberly-Clark [100], Quest Diagnostics[100], Philip Morris[100], NextEra [100], Generac Holdings[100], American Express[100], Equity Residential[100], Bank of America[100], EQT [100], Essex Property[100]
Best S&P 500 Stocks Year-to-Date:
NVIDIA [65.78%], Constellation [59.81%], Meta Platforms[38.84%], NRG [37.53%], Progressive [33.94%], Marathon [32.82%], Targa Resources[31.85%], Western Digital[31.75%], Micron [30.88%], United Airlines[30.85%], Diamondback [30.11%] Best S&P 500 Stocks This Week:
NVIDIA [7.74%], General Electric[7.36%], Enphase [7.28%], Kimberly-Clark [7.12%], Danaher [7.03%], General Motors[6.87%], Ford Motor[6.63%], Quest Diagnostics[6.08%], Pulte [5.96%], Charles River[5.72%], Illumina [5.69%] Best S&P 500 Stocks Daily:
Danaher [6.77%], General Electric[5.83%], Kimberly-Clark [5.38%], General Motors[4.79%], Quest Diagnostics[4.74%], United Rentals[4.51%], Waters [4.22%], Thermo Fisher[4.00%], Builders FirstSource[3.92%], Norwegian Cruise[3.75%], Bio-Rad [3.61%]