
 Login Sign Up


| |||||
 |  | ||||

| 12Stocks.com Market Intelligence |
Best MidCap Stocks
|
| In a hurry? Mid Cap Stocks Lists: Performance Trends Table, Stock Charts
Sort midcap stocks: Daily, Weekly, Year-to-Date, Market Cap & Trends. Filter midcap stocks list by sector: Show all, Tech, Finance, Energy, Staples, Retail, Industrial, Materials, Utilities and HealthCare Filter midcap stocks list by size:All MidCap Large Mid-Range Small |
| 12Stocks.com Mid Cap Stocks Performances & Trends Daily | |||||||||
|
|  The overall Smart Investing & Trading Score is 88 (0-bearish to 100-bullish) which puts Mid Cap index in short term bullish trend. The Smart Investing & Trading Score from previous trading session is 100 and hence a deterioration of trend.
| ||||||||
Here are the Smart Investing & Trading Scores of the most requested mid cap stocks at 12Stocks.com (click stock name for detailed review):
|


| 12Stocks.com: Top Performing Mid Cap Index Stocks | ||||||||||||||||||||||||||||||||||||||||||||||||
 The top performing Mid Cap Index stocks year to date are
Now, more recently, over last week, the top performing Mid Cap Index stocks on the move are


|
||||||||||||||||||||||||||||||||||||||||||||||||
| 12Stocks.com: Investing in Midcap Index with Stocks | |
|
The following table helps investors and traders sort through current performance and trends (as measured by Smart Investing & Trading Score) of various
stocks in the Midcap Index. Quick View: Move mouse or cursor over stock symbol (ticker) to view short-term technical chart and over stock name to view long term chart. Click on  to add stock symbol to your watchlist and to add stock symbol to your watchlist and  to view watchlist. Click on any ticker or stock name for detailed market intelligence report for that stock. to view watchlist. Click on any ticker or stock name for detailed market intelligence report for that stock. |
12Stocks.com Performance of Stocks in Midcap Index
| Ticker | Stock Name | Watchlist | Category | Recent Price | Smart Investing & Trading Score | Change % | YTD Change% |
| ASH | Ashland Global |   | Materials | 98.04 | 71 | 0.18% | 16.29% |
| COIN | Coinbase Global | | Financials | 200.92 | 0 | -4.53% | 16.28% |
| DASH | DoorDash | | Technology | 114.84 | 25 | -1.14% | 16.22% |
| CTAS | Cintas | | Services & Goods | 700.27 | 100 | 0.58% | 16.20% |
| TYL | Tyler Technologies | | Technology | 484.76 | 90 | 0.61% | 15.94% |
| RL | Ralph Lauren | | Consumer Staples | 167.15 | 52 | -0.53% | 15.92% |
| MHK | Mohawk Industries | | Consumer Staples | 119.81 | 90 | 0.08% | 15.76% |
| GWW | W.W. Grainger | | Services & Goods | 958.68 | 64 | 0.26% | 15.69% |
| ITT | ITT | | Industrials | 138.00 | 95 | 0.11% | 15.66% |
| ZBRA | Zebra Technologies | | Technology | 315.80 | 76 | -0.22% | 15.54% |
| RNR | RenaissanceRe | | Financials | 225.75 | 50 | -0.03% | 15.18% |
| LYFT | Lyft | | Technology | 17.27 | 75 | 0.20% | 15.18% |
| AM | Antero Midstream | | Energy | 14.42 | 88 | 0.42% | 15.08% |
| DCI | Donaldson | | Industrials | 75.16 | 88 | 0.23% | 15.01% |
| CINF | Cinnati Financial | | Financials | 118.87 | 85 | 0.47% | 14.89% |
| JEF | Jefferies Financial | | Financials | 46.37 | 95 | 0.96% | 14.75% |
| RSG | Republic Services | | Industrials | 189.24 | 58 | 0.59% | 14.75% |
| EVR | Evercore | | Financials | 196.25 | 95 | 0.91% | 14.73% |
| W | Wayfair | | Services & Goods | 70.72 | 95 | -3.04% | 14.62% |
| PNR | Pentair | | Industrials | 83.32 | 83 | -0.63% | 14.59% |
| PRU | Prudential Financial | | Financials | 118.83 | 100 | 0.75% | 14.58% |
| STLD | Steel Dynamics | | Materials | 135.18 | 65 | 0.25% | 14.46% |
| TKR | Timken | | Industrials | 91.73 | 100 | 0.44% | 14.45% |
| RBA | Ritchie Bros. | | Services & Goods | 76.48 | 100 | 4.87% | 14.34% |
| HLT | Hilton Worldwide | | Services & Goods | 208.08 | 95 | 2.26% | 14.27% |
| For chart view version of above stock list: Chart View ➞ 0 - 25 , 25 - 50 , 50 - 75 , 75 - 100 , 100 - 125 , 125 - 150 , 150 - 175 , 175 - 200 , 200 - 225 , 225 - 250 , 250 - 275 , 275 - 300 , 300 - 325 , 325 - 350 , 350 - 375 , 375 - 400 , 400 - 425 , 425 - 450 , 450 - 475 , 475 - 500 , 500 - 525 , 525 - 550 , 550 - 575 , 575 - 600 , 600 - 625 , 625 - 650 , 650 - 675 , 675 - 700 , 700 - 725 , 725 - 750 , 750 - 775 | ||
 | Click To Change The Sort Order: By Market Cap or Company Size Performance: Year-to-date, Week and Day |  |
|
Get the most comprehensive stock market coverage daily at 12Stocks.com ➞ Best Stocks Today ➞ Best Stocks Weekly ➞ Best Stocks Year-to-Date ➞ Best Stocks Trends ➞  Best Stocks Today 12Stocks.com Best Nasdaq Stocks ➞ Best S&P 500 Stocks ➞ Best Tech Stocks ➞ Best Biotech Stocks ➞ |
| Detailed Overview of Midcap Stocks |
| Midcap Technical Overview, Leaders & Laggards, Top Midcap ETF Funds & Detailed Midcap Stocks List, Charts, Trends & More |
| Midcap: Technical Analysis, Trends & YTD Performance | |
| MidCap segment as represented by
MDY, an exchange-traded fund [ETF], holds basket of about four hundred midcap stocks from across all major sectors of the US stock market. The midcap index (contains stocks like Green Mountain Coffee Roasters and Tractor Supply Company) is up by 7.83% and is currently underperforming the overall market by -0.95% year-to-date. Below is a quick view of technical charts and trends: | |
 MDY Weekly Chart |
|
| Long Term Trend: Very Good | |
| Medium Term Trend: Very Good | |
 MDY Daily Chart |
|
| Short Term Trend: Very Good | |
| Overall Trend Score: 88 | |
| YTD Performance: 7.83% | |
| **Trend Scores & Views Are Only For Educational Purposes And Not For Investing | |
| 12Stocks.com: Investing in Midcap Index using Exchange Traded Funds | |
|
The following table shows list of key exchange traded funds (ETF) that
help investors track Midcap index. The following list also includes leveraged ETF funds that track twice or thrice the daily returns of Midcap indices. Short or inverse ETF funds move in the opposite direction to the index they track and are useful during market pullbacks or during bear markets. Quick View: Move mouse or cursor over ETF symbol (ticker) to view short-term technical chart and over ETF name to view long term chart. Click on ticker or stock name for detailed view. Click on to add stock symbol to your watchlist and to view watchlist. |
12Stocks.com List of ETFs that track Midcap Index
| Ticker | ETF Name | Watchlist | Recent Price | Smart Investing & Trading Score | Change % | Week % | Year-to-date % |
| IJH | iShares Core S&P Mid-Cap | | 59.81 | 88 | -0.07 | 2.19 | 7.9% |
| IWS | iShares Russell Mid-Cap Value | | 123.38 | 100 | -0.10 | 2.22 | 6.1% |
| IWP | iShares Russell Mid-Cap Growth | | 110.32 | 57 | 0.29 | 1.44 | 5.61% |
| IWR | iShares Russell Mid-Cap | | 82.41 | 95 | 0.11 | 2.02 | 6.02% |
| MDY | SPDR S&P MidCap 400 ETF | | 547.09 | 88 | -0.16 | 2.18 | 7.83% |
| IJK | iShares S&P Mid-Cap 400 Growth | | 89.93 | 83 | -0.16 | 2.32 | 13.52% |
| IJJ | iShares S&P Mid-Cap 400 Value | | 116.25 | 90 | -0.06 | 2.18 | 1.94% |
| XMLV | PowerShares S&P MidCap Low Volatil ETF | | 56.69 | 88 | 0.37 | 2.14 | 6.6% |
| UMDD | ProShares UltraPro MidCap400 | | 26.31 | 95 | -0.15 | 6.61 | 17.88% |
| SMDD | ProShares UltraPro Short MidCap400 | | 10.74 | 10 | 0.85 | -6.18 | -20.23% |
| MVV | ProShares Ultra MidCap400 | | 65.34 | 95 | -0.39 | 4.19 | 12.88% |
| MYY | ProShares Short MidCap400 | | 20.17 | 18 | 0.24 | -1.96 | -5.99% |
| MZZ | ProShares UltraShort MidCap400 | | 10.88 | 20 | -1.27 | -5.06 | -13.45% |
| 12Stocks.com: Charts, Trends, Fundamental Data and Performances of MidCap Stocks | |
|
We now take in-depth look at all MidCap stocks including charts, multi-period performances and overall trends (as measured by Smart Investing & Trading Score). One can sort MidCap stocks (click link to choose) by Daily, Weekly and by Year-to-Date performances. Also, one can sort by size of the company or by market capitalization. |
| Select Your Default Chart Type: | |||||
| |||||
| Click on stock symbol or name for detailed view. Click on to add stock symbol to your watchlist and to view watchlist. Quick View: Move mouse or cursor over "Daily" to quickly view daily technical stock chart and over "Weekly" to view weekly technical stock chart. | |||||

 | ASH Ashland Global Holdings Inc. |
| Sector: Materials | |
| SubSector: Chemicals - Major Diversified | |
| MarketCap: 2764.16 Millions | |
| Recent Price: 98.04 Smart Investing & Trading Score: 71 | |
| Day Percent Change: 0.18% Day Change: 0.18 | |
| Week Change: 2.28% Year-to-date Change: 16.3% | |
| ASH Links: Profile News Message Board | |
| Charts:- Daily , Weekly | |
| Add ASH to Watchlist: View: Get Complete ASH Trend Analysis ➞ | |
 | COIN Coinbase Global, Inc. |
| Sector: Financials | |
| SubSector: Financial Data & Stock Exchanges | |
| MarketCap: 16390 Millions | |
| Recent Price: 200.92 Smart Investing & Trading Score: 0 | |
| Day Percent Change: -4.53% Day Change: -9.53 | |
| Week Change: -10% Year-to-date Change: 16.3% | |
| COIN Links: Profile News Message Board | |
| Charts:- Daily , Weekly | |
| Add COIN to Watchlist: View: Get Complete COIN Trend Analysis ➞ | |
 | DASH DoorDash, Inc. |
| Sector: Technology | |
| SubSector: Internet Content & Information | |
| MarketCap: 59087 Millions | |
| Recent Price: 114.84 Smart Investing & Trading Score: 25 | |
| Day Percent Change: -1.14% Day Change: -1.33 | |
| Week Change: 0.9% Year-to-date Change: 16.2% | |
| DASH Links: Profile News Message Board | |
| Charts:- Daily , Weekly | |
| Add DASH to Watchlist: View: Get Complete DASH Trend Analysis ➞ | |
 | CTAS Cintas Corporation |
| Sector: Services & Goods | |
| SubSector: Business Services | |
| MarketCap: 20154.6 Millions | |
| Recent Price: 700.27 Smart Investing & Trading Score: 100 | |
| Day Percent Change: 0.58% Day Change: 4.02 | |
| Week Change: 3.89% Year-to-date Change: 16.2% | |
| CTAS Links: Profile News Message Board | |
| Charts:- Daily , Weekly | |
| Add CTAS to Watchlist: View: Get Complete CTAS Trend Analysis ➞ | |
 | TYL Tyler Technologies, Inc. |
| Sector: Technology | |
| SubSector: Technical & System Software | |
| MarketCap: 10785 Millions | |
| Recent Price: 484.76 Smart Investing & Trading Score: 90 | |
| Day Percent Change: 0.61% Day Change: 2.92 | |
| Week Change: 3.36% Year-to-date Change: 15.9% | |
| TYL Links: Profile News Message Board | |
| Charts:- Daily , Weekly | |
| Add TYL to Watchlist: View: Get Complete TYL Trend Analysis ➞ | |
 | RL Ralph Lauren Corporation |
| Sector: Consumer Staples | |
| SubSector: Textile - Apparel Clothing | |
| MarketCap: 5589.95 Millions | |
| Recent Price: 167.15 Smart Investing & Trading Score: 52 | |
| Day Percent Change: -0.53% Day Change: -0.89 | |
| Week Change: 0.31% Year-to-date Change: 15.9% | |
| RL Links: Profile News Message Board | |
| Charts:- Daily , Weekly | |
| Add RL to Watchlist: View: Get Complete RL Trend Analysis ➞ | |
 | MHK Mohawk Industries, Inc. |
| Sector: Consumer Staples | |
| SubSector: Home Furnishings & Fixtures | |
| MarketCap: 4682.25 Millions | |
| Recent Price: 119.81 Smart Investing & Trading Score: 90 | |
| Day Percent Change: 0.08% Day Change: 0.09 | |
| Week Change: 2.96% Year-to-date Change: 15.8% | |
| MHK Links: Profile News Message Board | |
| Charts:- Daily , Weekly | |
| Add MHK to Watchlist: View: Get Complete MHK Trend Analysis ➞ | |
 | GWW W.W. Grainger, Inc. |
| Sector: Services & Goods | |
| SubSector: Industrial Equipment Wholesale | |
| MarketCap: 12794.8 Millions | |
| Recent Price: 958.68 Smart Investing & Trading Score: 64 | |
| Day Percent Change: 0.26% Day Change: 2.47 | |
| Week Change: 2.87% Year-to-date Change: 15.7% | |
| GWW Links: Profile News Message Board | |
| Charts:- Daily , Weekly | |
| Add GWW to Watchlist: View: Get Complete GWW Trend Analysis ➞ | |
 | ITT ITT Inc. |
| Sector: Industrials | |
| SubSector: Diversified Machinery | |
| MarketCap: 3783.06 Millions | |
| Recent Price: 138.00 Smart Investing & Trading Score: 95 | |
| Day Percent Change: 0.11% Day Change: 0.15 | |
| Week Change: 7.55% Year-to-date Change: 15.7% | |
| ITT Links: Profile News Message Board | |
| Charts:- Daily , Weekly | |
| Add ITT to Watchlist: View: Get Complete ITT Trend Analysis ➞ | |
 | ZBRA Zebra Technologies Corporation |
| Sector: Technology | |
| SubSector: Communication Equipment | |
| MarketCap: 11474.9 Millions | |
| Recent Price: 315.80 Smart Investing & Trading Score: 76 | |
| Day Percent Change: -0.22% Day Change: -0.70 | |
| Week Change: 2.01% Year-to-date Change: 15.5% | |
| ZBRA Links: Profile News Message Board | |
| Charts:- Daily , Weekly | |
| Add ZBRA to Watchlist: View: Get Complete ZBRA Trend Analysis ➞ | |
 | RNR RenaissanceRe Holdings Ltd. |
| Sector: Financials | |
| SubSector: Property & Casualty Insurance | |
| MarketCap: 6153.32 Millions | |
| Recent Price: 225.75 Smart Investing & Trading Score: 50 | |
| Day Percent Change: -0.03% Day Change: -0.06 | |
| Week Change: 3.4% Year-to-date Change: 15.2% | |
| RNR Links: Profile News Message Board | |
| Charts:- Daily , Weekly | |
| Add RNR to Watchlist: View: Get Complete RNR Trend Analysis ➞ | |
 | LYFT Lyft, Inc. |
| Sector: Technology | |
| SubSector: Application Software | |
| MarketCap: 7923.22 Millions | |
| Recent Price: 17.27 Smart Investing & Trading Score: 75 | |
| Day Percent Change: 0.20% Day Change: 0.04 | |
| Week Change: 0.38% Year-to-date Change: 15.2% | |
| LYFT Links: Profile News Message Board | |
| Charts:- Daily , Weekly | |
| Add LYFT to Watchlist: View: Get Complete LYFT Trend Analysis ➞ | |
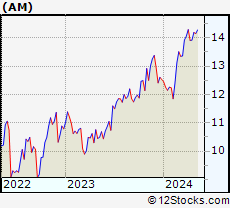 | AM Antero Midstream Corporation |
| Sector: Energy | |
| SubSector: Oil & Gas Pipelines | |
| MarketCap: 1195.35 Millions | |
| Recent Price: 14.42 Smart Investing & Trading Score: 88 | |
| Day Percent Change: 0.42% Day Change: 0.06 | |
| Week Change: 1.91% Year-to-date Change: 15.1% | |
| AM Links: Profile News Message Board | |
| Charts:- Daily , Weekly | |
| Add AM to Watchlist: View: Get Complete AM Trend Analysis ➞ | |
 | DCI Donaldson Company, Inc. |
| Sector: Industrials | |
| SubSector: Diversified Machinery | |
| MarketCap: 4993.46 Millions | |
| Recent Price: 75.16 Smart Investing & Trading Score: 88 | |
| Day Percent Change: 0.23% Day Change: 0.17 | |
| Week Change: 1.82% Year-to-date Change: 15.0% | |
| DCI Links: Profile News Message Board | |
| Charts:- Daily , Weekly | |
| Add DCI to Watchlist: View: Get Complete DCI Trend Analysis ➞ | |
 | CINF Cincinnati Financial Corporation |
| Sector: Financials | |
| SubSector: Property & Casualty Insurance | |
| MarketCap: 13637 Millions | |
| Recent Price: 118.87 Smart Investing & Trading Score: 85 | |
| Day Percent Change: 0.47% Day Change: 0.56 | |
| Week Change: 1.65% Year-to-date Change: 14.9% | |
| CINF Links: Profile News Message Board | |
| Charts:- Daily , Weekly | |
| Add CINF to Watchlist: View: Get Complete CINF Trend Analysis ➞ | |
 | JEF Jefferies Financial Group Inc. |
| Sector: Financials | |
| SubSector: Investment Brokerage - Regional | |
| MarketCap: 3987.15 Millions | |
| Recent Price: 46.37 Smart Investing & Trading Score: 95 | |
| Day Percent Change: 0.96% Day Change: 0.44 | |
| Week Change: 3.37% Year-to-date Change: 14.8% | |
| JEF Links: Profile News Message Board | |
| Charts:- Daily , Weekly | |
| Add JEF to Watchlist: View: Get Complete JEF Trend Analysis ➞ | |
 | RSG Republic Services, Inc. |
| Sector: Industrials | |
| SubSector: Waste Management | |
| MarketCap: 26178.6 Millions | |
| Recent Price: 189.24 Smart Investing & Trading Score: 58 | |
| Day Percent Change: 0.59% Day Change: 1.11 | |
| Week Change: 2.01% Year-to-date Change: 14.8% | |
| RSG Links: Profile News Message Board | |
| Charts:- Daily , Weekly | |
| Add RSG to Watchlist: View: Get Complete RSG Trend Analysis ➞ | |
 | EVR Evercore Inc. |
| Sector: Financials | |
| SubSector: Asset Management | |
| MarketCap: 1989.83 Millions | |
| Recent Price: 196.25 Smart Investing & Trading Score: 95 | |
| Day Percent Change: 0.91% Day Change: 1.77 | |
| Week Change: 3.38% Year-to-date Change: 14.7% | |
| EVR Links: Profile News Message Board | |
| Charts:- Daily , Weekly | |
| Add EVR to Watchlist: View: Get Complete EVR Trend Analysis ➞ | |
 | W Wayfair Inc. |
| Sector: Services & Goods | |
| SubSector: Catalog & Mail Order Houses | |
| MarketCap: 3497.02 Millions | |
| Recent Price: 70.72 Smart Investing & Trading Score: 95 | |
| Day Percent Change: -3.04% Day Change: -2.22 | |
| Week Change: 11.21% Year-to-date Change: 14.6% | |
| W Links: Profile News Message Board | |
| Charts:- Daily , Weekly | |
| Add W to Watchlist: View: Get Complete W Trend Analysis ➞ | |
 | PNR Pentair plc |
| Sector: Industrials | |
| SubSector: Industrial Equipment & Components | |
| MarketCap: 4326.59 Millions | |
| Recent Price: 83.32 Smart Investing & Trading Score: 83 | |
| Day Percent Change: -0.63% Day Change: -0.53 | |
| Week Change: 4.66% Year-to-date Change: 14.6% | |
| PNR Links: Profile News Message Board | |
| Charts:- Daily , Weekly | |
| Add PNR to Watchlist: View: Get Complete PNR Trend Analysis ➞ | |
 | PRU Prudential Financial, Inc. |
| Sector: Financials | |
| SubSector: Life Insurance | |
| MarketCap: 21001.6 Millions | |
| Recent Price: 118.83 Smart Investing & Trading Score: 100 | |
| Day Percent Change: 0.75% Day Change: 0.88 | |
| Week Change: 5.85% Year-to-date Change: 14.6% | |
| PRU Links: Profile News Message Board | |
| Charts:- Daily , Weekly | |
| Add PRU to Watchlist: View: Get Complete PRU Trend Analysis ➞ | |
 | STLD Steel Dynamics, Inc. |
| Sector: Materials | |
| SubSector: Steel & Iron | |
| MarketCap: 4533.58 Millions | |
| Recent Price: 135.18 Smart Investing & Trading Score: 65 | |
| Day Percent Change: 0.25% Day Change: 0.34 | |
| Week Change: -0.21% Year-to-date Change: 14.5% | |
| STLD Links: Profile News Message Board | |
| Charts:- Daily , Weekly | |
| Add STLD to Watchlist: View: Get Complete STLD Trend Analysis ➞ | |
 | TKR The Timken Company |
| Sector: Industrials | |
| SubSector: Machine Tools & Accessories | |
| MarketCap: 2277.48 Millions | |
| Recent Price: 91.73 Smart Investing & Trading Score: 100 | |
| Day Percent Change: 0.44% Day Change: 0.40 | |
| Week Change: 2.5% Year-to-date Change: 14.5% | |
| TKR Links: Profile News Message Board | |
| Charts:- Daily , Weekly | |
| Add TKR to Watchlist: View: Get Complete TKR Trend Analysis ➞ | |
 | RBA Ritchie Bros. Auctioneers Incorporated |
| Sector: Services & Goods | |
| SubSector: Business Services | |
| MarketCap: 3491.02 Millions | |
| Recent Price: 76.48 Smart Investing & Trading Score: 100 | |
| Day Percent Change: 4.87% Day Change: 3.55 | |
| Week Change: 5.87% Year-to-date Change: 14.3% | |
| RBA Links: Profile News Message Board | |
| Charts:- Daily , Weekly | |
| Add RBA to Watchlist: View: Get Complete RBA Trend Analysis ➞ | |
 | HLT Hilton Worldwide Holdings Inc. |
| Sector: Services & Goods | |
| SubSector: Lodging | |
| MarketCap: 18064.6 Millions | |
| Recent Price: 208.08 Smart Investing & Trading Score: 95 | |
| Day Percent Change: 2.26% Day Change: 4.60 | |
| Week Change: 5.34% Year-to-date Change: 14.3% | |
| HLT Links: Profile News Message Board | |
| Charts:- Daily , Weekly | |
| Add HLT to Watchlist: View: Get Complete HLT Trend Analysis ➞ | |
| For tabular summary view of above stock list: Summary View ➞ 0 - 25 , 25 - 50 , 50 - 75 , 75 - 100 , 100 - 125 , 125 - 150 , 150 - 175 , 175 - 200 , 200 - 225 , 225 - 250 , 250 - 275 , 275 - 300 , 300 - 325 , 325 - 350 , 350 - 375 , 375 - 400 , 400 - 425 , 425 - 450 , 450 - 475 , 475 - 500 , 500 - 525 , 525 - 550 , 550 - 575 , 575 - 600 , 600 - 625 , 625 - 650 , 650 - 675 , 675 - 700 , 700 - 725 , 725 - 750 , 750 - 775 | ||
| Click To Change The Sort Order: By Market Cap or Company Size Performance: Year-to-date, Week and Day | |
| Select Chart Type: | ||
|
Best Stocks Today 12Stocks.com |
© 2024 12Stocks.com Terms & Conditions Privacy Contact Us
All Information Provided Only For Education And Not To Be Used For Investing or Trading. See Terms & Conditions


One More Thing ... Get Best Stocks Delivered Daily!
Never Ever Miss A Move With Our Top Ten Stocks Lists
Find Best Stocks In Any Market - Bull or Bear Market
Take A Peek At Our Top Ten Stocks Lists: Daily, Weekly, Year-to-Date & Top Trends
Find Best Stocks In Any Market - Bull or Bear Market
Take A Peek At Our Top Ten Stocks Lists: Daily, Weekly, Year-to-Date & Top Trends
Midcap Stocks With Best Up Trends [0-bearish to 100-bullish]: Mettler-Toledo [100], H&R Block[100], Ubiquiti [100], Maravai LifeSciences[100], CAVA [100], Ritchie Bros.[100], Waters [100], Murphy USA[100], Aramark [100], Kyndryl [100], Fair Isaac[100]
Best Midcap Stocks Year-to-Date:
Vistra Energy[140.63%], AppLovin [117.19%], Constellation Energy[83.53%], CAVA [81.85%], EMCOR [76.52%], ShockWave Medical[73.53%], Tenet [68.23%], Natera [68.09%], NRG Energy[61.8%], Maravai LifeSciences[59.69%], Spotify [57.14%] Best Midcap Stocks This Week:
Kyndryl [32.8%], Elanco Animal[24.91%], Globus Medical[24.58%], Peloton Interactive[23.65%], Mettler-Toledo [20.63%], Cirrus Logic[19.95%], Toast [17.99%], Louisiana-Pacific [17.43%], Maravai LifeSciences[16.74%], RingCentral [16.14%], YETI [15.3%] Best Midcap Stocks Daily:
Mettler-Toledo [17.04%], Natera [10.19%], H&R Block[8.82%], Ubiquiti [7.87%], Shift4 Payments[6.64%], Maravai LifeSciences[6.09%], Victorias Secret[5.32%], Americold Realty[5.12%], CAVA [4.90%], Ritchie Bros.[4.87%], Waters [4.37%]