
 Login Sign Up


| |||||
 |  | ||||

| 12Stocks.com Market Intelligence |
Best MidCap Stocks
|
| In a hurry? Mid Cap Stocks Lists: Performance Trends Table, Stock Charts
Sort midcap stocks: Daily, Weekly, Year-to-Date, Market Cap & Trends. Filter midcap stocks list by sector: Show all, Tech, Finance, Energy, Staples, Retail, Industrial, Materials, Utilities and HealthCare Filter midcap stocks list by size:All MidCap Large Mid-Range Small |
| 12Stocks.com Mid Cap Stocks Performances & Trends Daily | |||||||||
|
|  The overall Smart Investing & Trading Score is 46 (0-bearish to 100-bullish) which puts Mid Cap index in short term neutral trend. The Smart Investing & Trading Score from previous trading session is 70 and hence a deterioration of trend.
| ||||||||
Here are the Smart Investing & Trading Scores of the most requested mid cap stocks at 12Stocks.com (click stock name for detailed review):
|


| 12Stocks.com: Top Performing Mid Cap Index Stocks | ||||||||||||||||||||||||||||||||||||||||||||||||
 The top performing Mid Cap Index stocks year to date are
Now, more recently, over last week, the top performing Mid Cap Index stocks on the move are


|
||||||||||||||||||||||||||||||||||||||||||||||||
| 12Stocks.com: Investing in Midcap Index with Stocks | |
|
The following table helps investors and traders sort through current performance and trends (as measured by Smart Investing & Trading Score) of various
stocks in the Midcap Index. Quick View: Move mouse or cursor over stock symbol (ticker) to view short-term technical chart and over stock name to view long term chart. Click on  to add stock symbol to your watchlist and to add stock symbol to your watchlist and  to view watchlist. Click on any ticker or stock name for detailed market intelligence report for that stock. to view watchlist. Click on any ticker or stock name for detailed market intelligence report for that stock. |
12Stocks.com Performance of Stocks in Midcap Index
| Ticker | Stock Name | Watchlist | Category | Recent Price | Smart Investing & Trading Score | Change % | YTD Change% |
| BKR | Baker Hughes |   | Services & Goods | 32.62 | 74 | -1.81% | -4.56% |
| ADT | ADT | | Services & Goods | 6.50 | 50 | -0.76% | -4.69% |
| PAG | Penske Automotive | | Services & Goods | 152.91 | 83 | -1.59% | -4.73% |
| DOCU | DocuSign | | Technology | 56.60 | 23 | -0.95% | -4.79% |
| ACHC | Acadia | | Health Care | 73.94 | 64 | -0.90% | -4.91% |
| SNV | Synovus Financial | | Financials | 35.79 | 5 | -1.92% | -4.94% |
| LYV | Live Nation | | Services & Goods | 88.91 | 51 | -1.80% | -5.01% |
| BRX | Brixmor Property | | Financials | 22.10 | 74 | -0.23% | -5.03% |
| HUN | Huntsman | | Materials | 23.86 | 50 | -2.53% | -5.05% |
| MAN | Manpower | | Services & Goods | 75.45 | 76 | -0.93% | -5.06% |
| PCG | PG&E | | Utilities | 17.11 | 78 | -0.87% | -5.10% |
| SWKS | Skyworks Solutions | | Technology | 106.67 | 100 | -1.10% | -5.11% |
| MOH | Molina | | Health Care | 342.10 | 0 | -0.52% | -5.32% |
| NCLH | Norwegian Cruise | | Services & Goods | 18.92 | 48 | -1.36% | -5.59% |
| MIDD | Middleby | | Industrials | 138.94 | 23 | -2.26% | -5.60% |
| SQ | Square | | Technology | 73.00 | 63 | -3.07% | -5.62% |
| DD | DuPont de | | Materials | 72.50 | 44 | -1.89% | -5.76% |
| CUZ | Cousins Properties | | Financials | 22.94 | 86 | -1.46% | -5.79% |
| COO | Cooper | | Health Care | 89.04 | 18 | -0.95% | -5.89% |
| PCTY | Paylocity Holding | | Technology | 155.11 | 48 | -1.64% | -5.91% |
| BBY | Best Buy | | Services & Goods | 73.64 | 36 | -1.81% | -5.93% |
| AGCO | AGCO | | Industrials | 114.19 | 10 | -4.15% | -5.95% |
| NNN | National Retail | | Financials | 40.53 | 85 | -0.27% | -5.96% |
| BR | Broadridge Financial | | Technology | 193.41 | 35 | -1.47% | -6.00% |
| KD | Kyndryl | | Technology | 19.66 | 27 | -0.91% | -6.11% |
| For chart view version of above stock list: Chart View ➞ 0 - 25 , 25 - 50 , 50 - 75 , 75 - 100 , 100 - 125 , 125 - 150 , 150 - 175 , 175 - 200 , 200 - 225 , 225 - 250 , 250 - 275 , 275 - 300 , 300 - 325 , 325 - 350 , 350 - 375 , 375 - 400 , 400 - 425 , 425 - 450 , 450 - 475 , 475 - 500 , 500 - 525 , 525 - 550 , 550 - 575 , 575 - 600 , 600 - 625 , 625 - 650 , 650 - 675 , 675 - 700 , 700 - 725 , 725 - 750 , 750 - 775 | ||
 | Click To Change The Sort Order: By Market Cap or Company Size Performance: Year-to-date, Week and Day |  |
|
Get the most comprehensive stock market coverage daily at 12Stocks.com ➞ Best Stocks Today ➞ Best Stocks Weekly ➞ Best Stocks Year-to-Date ➞ Best Stocks Trends ➞  Best Stocks Today 12Stocks.com Best Nasdaq Stocks ➞ Best S&P 500 Stocks ➞ Best Tech Stocks ➞ Best Biotech Stocks ➞ |
| Detailed Overview of Midcap Stocks |
| Midcap Technical Overview, Leaders & Laggards, Top Midcap ETF Funds & Detailed Midcap Stocks List, Charts, Trends & More |
| Midcap: Technical Analysis, Trends & YTD Performance | |
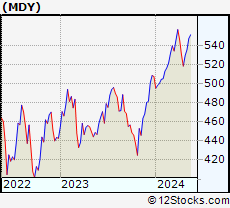
| MidCap segment as represented by
MDY, an exchange-traded fund [ETF], holds basket of about four hundred midcap stocks from across all major sectors of the US stock market. The midcap index (contains stocks like Green Mountain Coffee Roasters and Tractor Supply Company) is up by 3.03% and is currently underperforming the overall market by -1.77% year-to-date. Below is a quick view of technical charts and trends: | |
 MDY Weekly Chart |
|
| Long Term Trend: Good | |
| Medium Term Trend: Not Good | |
 MDY Daily Chart |
|
| Short Term Trend: Not Good | |
| Overall Trend Score: 46 | |
| YTD Performance: 3.03% | |
| **Trend Scores & Views Are Only For Educational Purposes And Not For Investing | |
| 12Stocks.com: Investing in Midcap Index using Exchange Traded Funds | |
|
The following table shows list of key exchange traded funds (ETF) that
help investors track Midcap index. The following list also includes leveraged ETF funds that track twice or thrice the daily returns of Midcap indices. Short or inverse ETF funds move in the opposite direction to the index they track and are useful during market pullbacks or during bear markets. Quick View: Move mouse or cursor over ETF symbol (ticker) to view short-term technical chart and over ETF name to view long term chart. Click on ticker or stock name for detailed view. Click on to add stock symbol to your watchlist and to view watchlist. |
12Stocks.com List of ETFs that track Midcap Index
| Ticker | ETF Name | Watchlist | Recent Price | Smart Investing & Trading Score | Change % | Week % | Year-to-date % |
| IJH | iShares Core S&P Mid-Cap | | 57.13 | 68 | -1.79 | -1.19 | 3.07% |
| MDY | SPDR S&P MidCap 400 ETF | | 522.76 | 46 | -1.79 | -1.25 | 3.03% |
| IWR | iShares Russell Mid-Cap | | 79.64 | 68 | -1.65 | -1.09 | 2.46% |
| IWP | iShares Russell Mid-Cap Growth | | 107.60 | 71 | -1.71 | -1.27 | 3.01% |
| IJK | iShares S&P Mid-Cap 400 Growth | | 85.95 | 63 | -1.78 | -1.21 | 8.5% |
| IWS | iShares Russell Mid-Cap Value | | 118.84 | 68 | -1.59 | -0.96 | 2.19% |
| IJJ | iShares S&P Mid-Cap 400 Value | | 111.50 | 81 | -1.20 | -0.65 | -2.23% |
| XMLV | PowerShares S&P MidCap Low Volatil ETF | | 54.61 | 76 | -0.60 | -0.07 | 2.69% |
| UMDD | ProShares UltraPro MidCap400 | | 23.68 | 31 | -2.63 | -1.17 | 6.09% |
| SMDD | ProShares UltraPro Short MidCap400 | | 11.81 | 57 | 1.64 | -0.17 | -12.28% |
| MVV | ProShares Ultra MidCap400 | | 60.44 | 68 | -2.21 | -1.61 | 4.4% |
| MYY | ProShares Short MidCap400 | | 20.89 | 40 | 0.94 | 0.46 | -2.65% |
| MZZ | ProShares UltraShort MidCap400 | | 11.82 | 27 | 1.98 | 1.2 | -5.97% |
| 12Stocks.com: Charts, Trends, Fundamental Data and Performances of MidCap Stocks | |
|
We now take in-depth look at all MidCap stocks including charts, multi-period performances and overall trends (as measured by Smart Investing & Trading Score). One can sort MidCap stocks (click link to choose) by Daily, Weekly and by Year-to-Date performances. Also, one can sort by size of the company or by market capitalization. |
| Select Your Default Chart Type: | |||||
| |||||
| Click on stock symbol or name for detailed view. Click on to add stock symbol to your watchlist and to view watchlist. Quick View: Move mouse or cursor over "Daily" to quickly view daily technical stock chart and over "Weekly" to view weekly technical stock chart. | |||||

 | BKR Baker Hughes Company |
| Sector: Services & Goods | |
| SubSector: Technical Services | |
| MarketCap: 1330 Millions | |
| Recent Price: 32.62 Smart Investing & Trading Score: 74 | |
| Day Percent Change: -1.81% Day Change: -0.60 | |
| Week Change: -0.67% Year-to-date Change: -4.6% | |
| BKR Links: Profile News Message Board | |
| Charts:- Daily , Weekly | |
| Add BKR to Watchlist: View: Get Complete BKR Trend Analysis ➞ | |
 | ADT ADT Inc. |
| Sector: Services & Goods | |
| SubSector: Security & Protection Services | |
| MarketCap: 2892.03 Millions | |
| Recent Price: 6.50 Smart Investing & Trading Score: 50 | |
| Day Percent Change: -0.76% Day Change: -0.05 | |
| Week Change: 1.09% Year-to-date Change: -4.7% | |
| ADT Links: Profile News Message Board | |
| Charts:- Daily , Weekly | |
| Add ADT to Watchlist: View: Get Complete ADT Trend Analysis ➞ | |
 | PAG Penske Automotive Group, Inc. |
| Sector: Services & Goods | |
| SubSector: Auto Dealerships | |
| MarketCap: 2088.81 Millions | |
| Recent Price: 152.91 Smart Investing & Trading Score: 83 | |
| Day Percent Change: -1.59% Day Change: -2.47 | |
| Week Change: -1.75% Year-to-date Change: -4.7% | |
| PAG Links: Profile News Message Board | |
| Charts:- Daily , Weekly | |
| Add PAG to Watchlist: View: Get Complete PAG Trend Analysis ➞ | |
 | DOCU DocuSign, Inc. |
| Sector: Technology | |
| SubSector: Business Software & Services | |
| MarketCap: 15618.8 Millions | |
| Recent Price: 56.60 Smart Investing & Trading Score: 23 | |
| Day Percent Change: -0.95% Day Change: -0.54 | |
| Week Change: -1.05% Year-to-date Change: -4.8% | |
| DOCU Links: Profile News Message Board | |
| Charts:- Daily , Weekly | |
| Add DOCU to Watchlist: View: Get Complete DOCU Trend Analysis ➞ | |
 | ACHC Acadia Healthcare Company, Inc. |
| Sector: Health Care | |
| SubSector: Specialized Health Services | |
| MarketCap: 1331.56 Millions | |
| Recent Price: 73.94 Smart Investing & Trading Score: 64 | |
| Day Percent Change: -0.90% Day Change: -0.67 | |
| Week Change: 0.48% Year-to-date Change: -4.9% | |
| ACHC Links: Profile News Message Board | |
| Charts:- Daily , Weekly | |
| Add ACHC to Watchlist: View: Get Complete ACHC Trend Analysis ➞ | |
 | SNV Synovus Financial Corp. |
| Sector: Financials | |
| SubSector: Regional - Mid-Atlantic Banks | |
| MarketCap: 2697.29 Millions | |
| Recent Price: 35.79 Smart Investing & Trading Score: 5 | |
| Day Percent Change: -1.92% Day Change: -0.70 | |
| Week Change: -2.88% Year-to-date Change: -4.9% | |
| SNV Links: Profile News Message Board | |
| Charts:- Daily , Weekly | |
| Add SNV to Watchlist: View: Get Complete SNV Trend Analysis ➞ | |
 | LYV Live Nation Entertainment, Inc. |
| Sector: Services & Goods | |
| SubSector: Entertainment - Diversified | |
| MarketCap: 8457.17 Millions | |
| Recent Price: 88.91 Smart Investing & Trading Score: 51 | |
| Day Percent Change: -1.80% Day Change: -1.63 | |
| Week Change: -1.02% Year-to-date Change: -5.0% | |
| LYV Links: Profile News Message Board | |
| Charts:- Daily , Weekly | |
| Add LYV to Watchlist: View: Get Complete LYV Trend Analysis ➞ | |
 | BRX Brixmor Property Group Inc. |
| Sector: Financials | |
| SubSector: REIT - Retail | |
| MarketCap: 3561.54 Millions | |
| Recent Price: 22.10 Smart Investing & Trading Score: 74 | |
| Day Percent Change: -0.23% Day Change: -0.05 | |
| Week Change: 1.75% Year-to-date Change: -5.0% | |
| BRX Links: Profile News Message Board | |
| Charts:- Daily , Weekly | |
| Add BRX to Watchlist: View: Get Complete BRX Trend Analysis ➞ | |
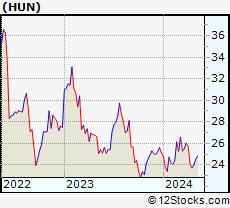 | HUN Huntsman Corporation |
| Sector: Materials | |
| SubSector: Chemicals - Major Diversified | |
| MarketCap: 3304.06 Millions | |
| Recent Price: 23.86 Smart Investing & Trading Score: 50 | |
| Day Percent Change: -2.53% Day Change: -0.62 | |
| Week Change: -0.54% Year-to-date Change: -5.1% | |
| HUN Links: Profile News Message Board | |
| Charts:- Daily , Weekly | |
| Add HUN to Watchlist: View: Get Complete HUN Trend Analysis ➞ | |
 | MAN ManpowerGroup Inc. |
| Sector: Services & Goods | |
| SubSector: Staffing & Outsourcing Services | |
| MarketCap: 3436.28 Millions | |
| Recent Price: 75.45 Smart Investing & Trading Score: 76 | |
| Day Percent Change: -0.93% Day Change: -0.71 | |
| Week Change: -0.53% Year-to-date Change: -5.1% | |
| MAN Links: Profile News Message Board | |
| Charts:- Daily , Weekly | |
| Add MAN to Watchlist: View: Get Complete MAN Trend Analysis ➞ | |
 | PCG PG&E Corporation |
| Sector: Utilities | |
| SubSector: Electric Utilities | |
| MarketCap: 5078.04 Millions | |
| Recent Price: 17.11 Smart Investing & Trading Score: 78 | |
| Day Percent Change: -0.87% Day Change: -0.15 | |
| Week Change: 0.47% Year-to-date Change: -5.1% | |
| PCG Links: Profile News Message Board | |
| Charts:- Daily , Weekly | |
| Add PCG to Watchlist: View: Get Complete PCG Trend Analysis ➞ | |
 | SWKS Skyworks Solutions, Inc. |
| Sector: Technology | |
| SubSector: Semiconductor - Integrated Circuits | |
| MarketCap: 13981 Millions | |
| Recent Price: 106.67 Smart Investing & Trading Score: 100 | |
| Day Percent Change: -1.10% Day Change: -1.19 | |
| Week Change: 2.27% Year-to-date Change: -5.1% | |
| SWKS Links: Profile News Message Board | |
| Charts:- Daily , Weekly | |
| Add SWKS to Watchlist: View: Get Complete SWKS Trend Analysis ➞ | |
 | MOH Molina Healthcare, Inc. |
| Sector: Health Care | |
| SubSector: Health Care Plans | |
| MarketCap: 7235.6 Millions | |
| Recent Price: 342.10 Smart Investing & Trading Score: 0 | |
| Day Percent Change: -0.52% Day Change: -1.79 | |
| Week Change: -0.04% Year-to-date Change: -5.3% | |
| MOH Links: Profile News Message Board | |
| Charts:- Daily , Weekly | |
| Add MOH to Watchlist: View: Get Complete MOH Trend Analysis ➞ | |
 | NCLH Norwegian Cruise Line Holdings Ltd. |
| Sector: Services & Goods | |
| SubSector: Resorts & Casinos | |
| MarketCap: 2895.54 Millions | |
| Recent Price: 18.92 Smart Investing & Trading Score: 48 | |
| Day Percent Change: -1.36% Day Change: -0.26 | |
| Week Change: -0.63% Year-to-date Change: -5.6% | |
| NCLH Links: Profile News Message Board | |
| Charts:- Daily , Weekly | |
| Add NCLH to Watchlist: View: Get Complete NCLH Trend Analysis ➞ | |
 | MIDD The Middleby Corporation |
| Sector: Industrials | |
| SubSector: Diversified Machinery | |
| MarketCap: 3070.36 Millions | |
| Recent Price: 138.94 Smart Investing & Trading Score: 23 | |
| Day Percent Change: -2.26% Day Change: -3.22 | |
| Week Change: -1.64% Year-to-date Change: -5.6% | |
| MIDD Links: Profile News Message Board | |
| Charts:- Daily , Weekly | |
| Add MIDD to Watchlist: View: Get Complete MIDD Trend Analysis ➞ | |
 | SQ Square, Inc. |
| Sector: Technology | |
| SubSector: Internet Software & Services | |
| MarketCap: 19323.1 Millions | |
| Recent Price: 73.00 Smart Investing & Trading Score: 63 | |
| Day Percent Change: -3.07% Day Change: -2.31 | |
| Week Change: -1.99% Year-to-date Change: -5.6% | |
| SQ Links: Profile News Message Board | |
| Charts:- Daily , Weekly | |
| Add SQ to Watchlist: View: Get Complete SQ Trend Analysis ➞ | |
 | DD DuPont de Nemours, Inc. |
| Sector: Materials | |
| SubSector: Agricultural Chemicals | |
| MarketCap: 25631.6 Millions | |
| Recent Price: 72.50 Smart Investing & Trading Score: 44 | |
| Day Percent Change: -1.89% Day Change: -1.40 | |
| Week Change: -1.64% Year-to-date Change: -5.8% | |
| DD Links: Profile News Message Board | |
| Charts:- Daily , Weekly | |
| Add DD to Watchlist: View: Get Complete DD Trend Analysis ➞ | |
 | CUZ Cousins Properties Incorporated |
| Sector: Financials | |
| SubSector: REIT - Diversified | |
| MarketCap: 3828.13 Millions | |
| Recent Price: 22.94 Smart Investing & Trading Score: 86 | |
| Day Percent Change: -1.46% Day Change: -0.34 | |
| Week Change: 0.35% Year-to-date Change: -5.8% | |
| CUZ Links: Profile News Message Board | |
| Charts:- Daily , Weekly | |
| Add CUZ to Watchlist: View: Get Complete CUZ Trend Analysis ➞ | |
 | COO The Cooper Companies, Inc. |
| Sector: Health Care | |
| SubSector: Medical Instruments & Supplies | |
| MarketCap: 15460 Millions | |
| Recent Price: 89.04 Smart Investing & Trading Score: 18 | |
| Day Percent Change: -0.95% Day Change: -0.85 | |
| Week Change: 0.23% Year-to-date Change: -5.9% | |
| COO Links: Profile News Message Board | |
| Charts:- Daily , Weekly | |
| Add COO to Watchlist: View: Get Complete COO Trend Analysis ➞ | |
 | PCTY Paylocity Holding Corporation |
| Sector: Technology | |
| SubSector: Application Software | |
| MarketCap: 4972.82 Millions | |
| Recent Price: 155.11 Smart Investing & Trading Score: 48 | |
| Day Percent Change: -1.64% Day Change: -2.59 | |
| Week Change: -1.24% Year-to-date Change: -5.9% | |
| PCTY Links: Profile News Message Board | |
| Charts:- Daily , Weekly | |
| Add PCTY to Watchlist: View: Get Complete PCTY Trend Analysis ➞ | |
 | BBY Best Buy Co., Inc. |
| Sector: Services & Goods | |
| SubSector: Electronics Stores | |
| MarketCap: 15771.3 Millions | |
| Recent Price: 73.64 Smart Investing & Trading Score: 36 | |
| Day Percent Change: -1.81% Day Change: -1.36 | |
| Week Change: -1.88% Year-to-date Change: -5.9% | |
| BBY Links: Profile News Message Board | |
| Charts:- Daily , Weekly | |
| Add BBY to Watchlist: View: Get Complete BBY Trend Analysis ➞ | |
 | AGCO AGCO Corporation |
| Sector: Industrials | |
| SubSector: Farm & Construction Machinery | |
| MarketCap: 3399.57 Millions | |
| Recent Price: 114.19 Smart Investing & Trading Score: 10 | |
| Day Percent Change: -4.15% Day Change: -4.95 | |
| Week Change: -2.08% Year-to-date Change: -6.0% | |
| AGCO Links: Profile News Message Board | |
| Charts:- Daily , Weekly | |
| Add AGCO to Watchlist: View: Get Complete AGCO Trend Analysis ➞ | |
 | NNN National Retail Properties, Inc. |
| Sector: Financials | |
| SubSector: REIT - Diversified | |
| MarketCap: 5459.93 Millions | |
| Recent Price: 40.53 Smart Investing & Trading Score: 85 | |
| Day Percent Change: -0.27% Day Change: -0.11 | |
| Week Change: -0.56% Year-to-date Change: -6.0% | |
| NNN Links: Profile News Message Board | |
| Charts:- Daily , Weekly | |
| Add NNN to Watchlist: View: Get Complete NNN Trend Analysis ➞ | |
 | BR Broadridge Financial Solutions, Inc. |
| Sector: Technology | |
| SubSector: Information Technology Services | |
| MarketCap: 10633.8 Millions | |
| Recent Price: 193.41 Smart Investing & Trading Score: 35 | |
| Day Percent Change: -1.47% Day Change: -2.88 | |
| Week Change: -0.38% Year-to-date Change: -6.0% | |
| BR Links: Profile News Message Board | |
| Charts:- Daily , Weekly | |
| Add BR to Watchlist: View: Get Complete BR Trend Analysis ➞ | |
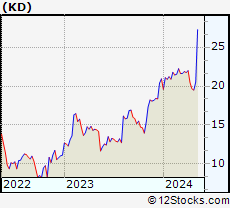 | KD Kyndryl Holdings, Inc. |
| Sector: Technology | |
| SubSector: Information Technology Services | |
| MarketCap: 2990 Millions | |
| Recent Price: 19.66 Smart Investing & Trading Score: 27 | |
| Day Percent Change: -0.91% Day Change: -0.18 | |
| Week Change: 0.87% Year-to-date Change: -6.1% | |
| KD Links: Profile News Message Board | |
| Charts:- Daily , Weekly | |
| Add KD to Watchlist: View: Get Complete KD Trend Analysis ➞ | |
| For tabular summary view of above stock list: Summary View ➞ 0 - 25 , 25 - 50 , 50 - 75 , 75 - 100 , 100 - 125 , 125 - 150 , 150 - 175 , 175 - 200 , 200 - 225 , 225 - 250 , 250 - 275 , 275 - 300 , 300 - 325 , 325 - 350 , 350 - 375 , 375 - 400 , 400 - 425 , 425 - 450 , 450 - 475 , 475 - 500 , 500 - 525 , 525 - 550 , 550 - 575 , 575 - 600 , 600 - 625 , 625 - 650 , 650 - 675 , 675 - 700 , 700 - 725 , 725 - 750 , 750 - 775 | ||
| Click To Change The Sort Order: By Market Cap or Company Size Performance: Year-to-date, Week and Day | |
| Select Chart Type: | ||
|
Best Stocks Today 12Stocks.com |
© 2024 12Stocks.com Terms & Conditions Privacy Contact Us
All Information Provided Only For Education And Not To Be Used For Investing or Trading. See Terms & Conditions


One More Thing ... Get Best Stocks Delivered Daily!
Never Ever Miss A Move With Our Top Ten Stocks Lists
Find Best Stocks In Any Market - Bull or Bear Market
Take A Peek At Our Top Ten Stocks Lists: Daily, Weekly, Year-to-Date & Top Trends
Find Best Stocks In Any Market - Bull or Bear Market
Take A Peek At Our Top Ten Stocks Lists: Daily, Weekly, Year-to-Date & Top Trends
Midcap Stocks With Best Up Trends [0-bearish to 100-bullish]: Tenet [100], Sensata Technologies[100], Leidos [100], Corning [100], Zebra Technologies[100], Timken [100], CAVA [100], Tandem Diabetes[100], Campbell Soup[100], Mosaic [100], Federal Realty[100]
Best Midcap Stocks Year-to-Date:
Vistra Energy[96.88%], AppLovin [77.26%], ShockWave Medical[73.23%], EMCOR [65.79%], CAVA [65.46%], Constellation Energy[58.77%], Wingstop [50%], Antero Resources[49.96%], Spotify [49.24%], Tenet [48.59%], Natera [48.36%] Best Midcap Stocks This Week:
Tenet [16.81%], agilon health[10%], Sensata Technologies[9.52%], Woodward [7.83%], Leidos [7.56%], Tandem Diabetes[7.18%], Corning [6.54%], Maravai LifeSciences[6.49%], Domino s[6.05%], 10x Genomics[6.02%], Zebra Technologies[5.76%] Best Midcap Stocks Daily:
Tenet [13.25%], Woodward [7.48%], agilon health[7.21%], Sensata Technologies[7.13%], Leidos [6.53%], Corning [5.03%], Zebra Technologies[4.78%], Maravai LifeSciences[4.46%], Quidel [3.15%], 10x Genomics[2.99%], Timken [2.91%]