
 Login Sign Up


| |||||
 |  | ||||

| 12Stocks.com Market Intelligence |
Best MidCap Stocks
|
| In a hurry? Mid Cap Stocks Lists: Performance Trends Table, Stock Charts
Sort midcap stocks: Daily, Weekly, Year-to-Date, Market Cap & Trends. Filter midcap stocks list by sector: Show all, Tech, Finance, Energy, Staples, Retail, Industrial, Materials, Utilities and HealthCare Filter midcap stocks list by size:All MidCap Large Mid-Range Small |
| 12Stocks.com Mid Cap Stocks Performances & Trends Daily | |||||||||
|
|  The overall Smart Investing & Trading Score is 46 (0-bearish to 100-bullish) which puts Mid Cap index in short term neutral trend. The Smart Investing & Trading Score from previous trading session is 70 and hence a deterioration of trend.
| ||||||||
Here are the Smart Investing & Trading Scores of the most requested mid cap stocks at 12Stocks.com (click stock name for detailed review):
|


| 12Stocks.com: Top Performing Mid Cap Index Stocks | ||||||||||||||||||||||||||||||||||||||||||||||||
 The top performing Mid Cap Index stocks year to date are
Now, more recently, over last week, the top performing Mid Cap Index stocks on the move are


|
||||||||||||||||||||||||||||||||||||||||||||||||
| 12Stocks.com: Investing in Midcap Index with Stocks | |
|
The following table helps investors and traders sort through current performance and trends (as measured by Smart Investing & Trading Score) of various
stocks in the Midcap Index. Quick View: Move mouse or cursor over stock symbol (ticker) to view short-term technical chart and over stock name to view long term chart. Click on  to add stock symbol to your watchlist and to add stock symbol to your watchlist and  to view watchlist. Click on any ticker or stock name for detailed market intelligence report for that stock. to view watchlist. Click on any ticker or stock name for detailed market intelligence report for that stock. |
12Stocks.com Performance of Stocks in Midcap Index
| Ticker | Stock Name | Watchlist | Category | Recent Price | Smart Investing & Trading Score | Change % | YTD Change% |
| PEN | Penumbra |   | Health Care | 196.47 | 15 | -2.76% | -21.89% |
| UA | Under Armour | | Services & Goods | 6.52 | 47 | -1.06% | -21.92% |
| ZS | Zscaler | | Technology | 172.94 | 35 | -3.41% | -21.94% |
| QS | QuantumScape | | Services & Goods | 5.42 | 40 | -1.45% | -22.01% |
| WHR | Whirlpool | | Consumer Staples | 94.86 | 25 | -2.11% | -22.10% |
| FOUR | Shift4 Payments | | Technology | 57.86 | 0 | -3.18% | -22.17% |
| DNB | Dun & Bradstreet | | Technology | 9.10 | 43 | -2.88% | -22.22% |
| MCW | Mister Car | | Services & Goods | 6.69 | 18 | -1.04% | -22.34% |
| IPGP | IPG Photonics | | Technology | 83.98 | 18 | -5.19% | -22.63% |
| LAD | Lithia Motors | | Services & Goods | 254.38 | 35 | -2.66% | -22.75% |
| MRCY | Mercury | | Technology | 28.20 | 67 | -3.06% | -22.89% |
| LW | Lamb Weston | | Consumer Staples | 83.34 | 50 | -1.57% | -22.90% |
| UI | Ubiquiti | | Technology | 107.58 | 45 | -1.27% | -22.91% |
| RBLX | Roblox | | Services & Goods | 35.56 | 35 | -2.74% | -22.94% |
| S | SentinelOne | | Technology | 21.13 | 30 | -2.63% | -23.00% |
| BEN | Franklin Resources | | Financials | 22.84 | 0 | -2.31% | -23.33% |
| UAA | Under Armour | | Consumer Staples | 6.73 | 50 | -1.46% | -23.44% |
| BILL | Bill.com | | Technology | 62.36 | 74 | -1.05% | -23.57% |
| CZR | Caesars Entertainment | | Services & Goods | 35.82 | 20 | -4.66% | -23.59% |
| PATH | UiPath | | Technology | 18.97 | 35 | -4.00% | -23.68% |
| REXR | Rexford Industrial | | Financials | 42.81 | 35 | -1.34% | -23.69% |
| ALNY | Alnylam | | Health Care | 143.95 | 42 | -2.31% | -24.79% |
| GLOB | Globant S.A | | Technology | 178.59 | 28 | -2.67% | -24.96% |
| X | United States | | Materials | 36.50 | 20 | -1.24% | -24.97% |
| IRDM | Iridium | | Technology | 30.79 | 67 | -3.18% | -25.19% |
| For chart view version of above stock list: Chart View ➞ 0 - 25 , 25 - 50 , 50 - 75 , 75 - 100 , 100 - 125 , 125 - 150 , 150 - 175 , 175 - 200 , 200 - 225 , 225 - 250 , 250 - 275 , 275 - 300 , 300 - 325 , 325 - 350 , 350 - 375 , 375 - 400 , 400 - 425 , 425 - 450 , 450 - 475 , 475 - 500 , 500 - 525 , 525 - 550 , 550 - 575 , 575 - 600 , 600 - 625 , 625 - 650 , 650 - 675 , 675 - 700 , 700 - 725 , 725 - 750 , 750 - 775 | ||
 | Click To Change The Sort Order: By Market Cap or Company Size Performance: Year-to-date, Week and Day |  |
|
Get the most comprehensive stock market coverage daily at 12Stocks.com ➞ Best Stocks Today ➞ Best Stocks Weekly ➞ Best Stocks Year-to-Date ➞ Best Stocks Trends ➞  Best Stocks Today 12Stocks.com Best Nasdaq Stocks ➞ Best S&P 500 Stocks ➞ Best Tech Stocks ➞ Best Biotech Stocks ➞ |
| Detailed Overview of Midcap Stocks |
| Midcap Technical Overview, Leaders & Laggards, Top Midcap ETF Funds & Detailed Midcap Stocks List, Charts, Trends & More |
| Midcap: Technical Analysis, Trends & YTD Performance | |
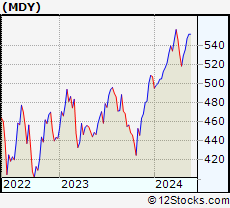
| MidCap segment as represented by
MDY, an exchange-traded fund [ETF], holds basket of about four hundred midcap stocks from across all major sectors of the US stock market. The midcap index (contains stocks like Green Mountain Coffee Roasters and Tractor Supply Company) is up by 3.03% and is currently underperforming the overall market by -1.77% year-to-date. Below is a quick view of technical charts and trends: | |
 MDY Weekly Chart |
|
| Long Term Trend: Good | |
| Medium Term Trend: Not Good | |
 MDY Daily Chart |
|
| Short Term Trend: Not Good | |
| Overall Trend Score: 46 | |
| YTD Performance: 3.03% | |
| **Trend Scores & Views Are Only For Educational Purposes And Not For Investing | |
| 12Stocks.com: Investing in Midcap Index using Exchange Traded Funds | |
|
The following table shows list of key exchange traded funds (ETF) that
help investors track Midcap index. The following list also includes leveraged ETF funds that track twice or thrice the daily returns of Midcap indices. Short or inverse ETF funds move in the opposite direction to the index they track and are useful during market pullbacks or during bear markets. Quick View: Move mouse or cursor over ETF symbol (ticker) to view short-term technical chart and over ETF name to view long term chart. Click on ticker or stock name for detailed view. Click on to add stock symbol to your watchlist and to view watchlist. |
12Stocks.com List of ETFs that track Midcap Index
| Ticker | ETF Name | Watchlist | Recent Price | Smart Investing & Trading Score | Change % | Week % | Year-to-date % |
| IJH | iShares Core S&P Mid-Cap | | 57.13 | 68 | -1.79 | -1.19 | 3.07% |
| MDY | SPDR S&P MidCap 400 ETF | | 522.76 | 46 | -1.79 | -1.25 | 3.03% |
| IWR | iShares Russell Mid-Cap | | 79.62 | 68 | -1.68 | -1.12 | 2.43% |
| IWP | iShares Russell Mid-Cap Growth | | 107.44 | 71 | -1.85 | -1.41 | 2.85% |
| IJK | iShares S&P Mid-Cap 400 Growth | | 85.84 | 63 | -1.91 | -1.33 | 8.36% |
| IWS | iShares Russell Mid-Cap Value | | 118.86 | 68 | -1.57 | -0.94 | 2.21% |
| IJJ | iShares S&P Mid-Cap 400 Value | | 111.06 | 81 | -1.59 | -1.04 | -2.61% |
| XMLV | PowerShares S&P MidCap Low Volatil ETF | | 54.44 | 76 | -0.91 | -0.38 | 2.37% |
| UMDD | ProShares UltraPro MidCap400 | | 23.26 | 31 | -4.36 | -2.92 | 4.21% |
| SMDD | ProShares UltraPro Short MidCap400 | | 12.21 | 57 | 5.08 | 3.21 | -9.31% |
| MVV | ProShares Ultra MidCap400 | | 59.89 | 68 | -3.10 | -2.51 | 3.45% |
| MYY | ProShares Short MidCap400 | | 20.91 | 40 | 1.06 | 0.58 | -2.54% |
| MZZ | ProShares UltraShort MidCap400 | | 11.82 | 27 | 1.98 | 1.2 | -5.97% |
| 12Stocks.com: Charts, Trends, Fundamental Data and Performances of MidCap Stocks | |
|
We now take in-depth look at all MidCap stocks including charts, multi-period performances and overall trends (as measured by Smart Investing & Trading Score). One can sort MidCap stocks (click link to choose) by Daily, Weekly and by Year-to-Date performances. Also, one can sort by size of the company or by market capitalization. |
| Select Your Default Chart Type: | |||||
| |||||
| Click on stock symbol or name for detailed view. Click on to add stock symbol to your watchlist and to view watchlist. Quick View: Move mouse or cursor over "Daily" to quickly view daily technical stock chart and over "Weekly" to view weekly technical stock chart. | |||||

 | PEN Penumbra, Inc. |
| Sector: Health Care | |
| SubSector: Medical Instruments & Supplies | |
| MarketCap: 4854.1 Millions | |
| Recent Price: 196.47 Smart Investing & Trading Score: 15 | |
| Day Percent Change: -2.76% Day Change: -5.57 | |
| Week Change: -3.88% Year-to-date Change: -21.9% | |
| PEN Links: Profile News Message Board | |
| Charts:- Daily , Weekly | |
| Add PEN to Watchlist: View: Get Complete PEN Trend Analysis ➞ | |
 | UA Under Armour, Inc. |
| Sector: Services & Goods | |
| SubSector: Textile - Apparel Clothing | |
| MarketCap: 3926.93 Millions | |
| Recent Price: 6.52 Smart Investing & Trading Score: 47 | |
| Day Percent Change: -1.06% Day Change: -0.07 | |
| Week Change: -0.46% Year-to-date Change: -21.9% | |
| UA Links: Profile News Message Board | |
| Charts:- Daily , Weekly | |
| Add UA to Watchlist: View: Get Complete UA Trend Analysis ➞ | |
 | ZS Zscaler, Inc. |
| Sector: Technology | |
| SubSector: Security Software & Services | |
| MarketCap: 7532.17 Millions | |
| Recent Price: 172.94 Smart Investing & Trading Score: 35 | |
| Day Percent Change: -3.41% Day Change: -6.10 | |
| Week Change: -2.32% Year-to-date Change: -21.9% | |
| ZS Links: Profile News Message Board | |
| Charts:- Daily , Weekly | |
| Add ZS to Watchlist: View: Get Complete ZS Trend Analysis ➞ | |
 | QS QuantumScape Corporation |
| Sector: Services & Goods | |
| SubSector: Auto Parts | |
| MarketCap: 13137 Millions | |
| Recent Price: 5.42 Smart Investing & Trading Score: 40 | |
| Day Percent Change: -1.45% Day Change: -0.08 | |
| Week Change: 0.56% Year-to-date Change: -22.0% | |
| QS Links: Profile News Message Board | |
| Charts:- Daily , Weekly | |
| Add QS to Watchlist: View: Get Complete QS Trend Analysis ➞ | |
 | WHR Whirlpool Corporation |
| Sector: Consumer Staples | |
| SubSector: Appliances | |
| MarketCap: 5015.08 Millions | |
| Recent Price: 94.86 Smart Investing & Trading Score: 25 | |
| Day Percent Change: -2.11% Day Change: -2.04 | |
| Week Change: 0.27% Year-to-date Change: -22.1% | |
| WHR Links: Profile News Message Board | |
| Charts:- Daily , Weekly | |
| Add WHR to Watchlist: View: Get Complete WHR Trend Analysis ➞ | |
 | FOUR Shift4 Payments, Inc. |
| Sector: Technology | |
| SubSector: Software Infrastructure | |
| MarketCap: 49287 Millions | |
| Recent Price: 57.86 Smart Investing & Trading Score: 0 | |
| Day Percent Change: -3.18% Day Change: -1.90 | |
| Week Change: -2.05% Year-to-date Change: -22.2% | |
| FOUR Links: Profile News Message Board | |
| Charts:- Daily , Weekly | |
| Add FOUR to Watchlist: View: Get Complete FOUR Trend Analysis ➞ | |
 | DNB Dun & Bradstreet Holdings, Inc. |
| Sector: Technology | |
| SubSector: Information Technology Services | |
| MarketCap: 10887 Millions | |
| Recent Price: 9.10 Smart Investing & Trading Score: 43 | |
| Day Percent Change: -2.88% Day Change: -0.27 | |
| Week Change: -2.67% Year-to-date Change: -22.2% | |
| DNB Links: Profile News Message Board | |
| Charts:- Daily , Weekly | |
| Add DNB to Watchlist: View: Get Complete DNB Trend Analysis ➞ | |
 | MCW Mister Car Wash, Inc. |
| Sector: Services & Goods | |
| SubSector: Personal Services | |
| MarketCap: 2790 Millions | |
| Recent Price: 6.69 Smart Investing & Trading Score: 18 | |
| Day Percent Change: -1.04% Day Change: -0.07 | |
| Week Change: -2.9% Year-to-date Change: -22.3% | |
| MCW Links: Profile News Message Board | |
| Charts:- Daily , Weekly | |
| Add MCW to Watchlist: View: Get Complete MCW Trend Analysis ➞ | |
 | IPGP IPG Photonics Corporation |
| Sector: Technology | |
| SubSector: Semiconductor Equipment & Materials | |
| MarketCap: 6059.38 Millions | |
| Recent Price: 83.98 Smart Investing & Trading Score: 18 | |
| Day Percent Change: -5.19% Day Change: -4.60 | |
| Week Change: -5% Year-to-date Change: -22.6% | |
| IPGP Links: Profile News Message Board | |
| Charts:- Daily , Weekly | |
| Add IPGP to Watchlist: View: Get Complete IPGP Trend Analysis ➞ | |
 | LAD Lithia Motors, Inc. |
| Sector: Services & Goods | |
| SubSector: Auto Dealerships | |
| MarketCap: 1727.21 Millions | |
| Recent Price: 254.38 Smart Investing & Trading Score: 35 | |
| Day Percent Change: -2.66% Day Change: -6.95 | |
| Week Change: -3.17% Year-to-date Change: -22.8% | |
| LAD Links: Profile News Message Board | |
| Charts:- Daily , Weekly | |
| Add LAD to Watchlist: View: Get Complete LAD Trend Analysis ➞ | |
 | MRCY Mercury Systems, Inc. |
| Sector: Technology | |
| SubSector: Computer Peripherals | |
| MarketCap: 3797.09 Millions | |
| Recent Price: 28.20 Smart Investing & Trading Score: 67 | |
| Day Percent Change: -3.06% Day Change: -0.89 | |
| Week Change: -3.03% Year-to-date Change: -22.9% | |
| MRCY Links: Profile News Message Board | |
| Charts:- Daily , Weekly | |
| Add MRCY to Watchlist: View: Get Complete MRCY Trend Analysis ➞ | |
 | LW Lamb Weston Holdings, Inc. |
| Sector: Consumer Staples | |
| SubSector: Food - Major Diversified | |
| MarketCap: 7844.63 Millions | |
| Recent Price: 83.34 Smart Investing & Trading Score: 50 | |
| Day Percent Change: -1.57% Day Change: -1.33 | |
| Week Change: -0.61% Year-to-date Change: -22.9% | |
| LW Links: Profile News Message Board | |
| Charts:- Daily , Weekly | |
| Add LW to Watchlist: View: Get Complete LW Trend Analysis ➞ | |
 | UI Ubiquiti Inc. |
| Sector: Technology | |
| SubSector: Communication Equipment | |
| MarketCap: 9526.89 Millions | |
| Recent Price: 107.58 Smart Investing & Trading Score: 45 | |
| Day Percent Change: -1.27% Day Change: -1.38 | |
| Week Change: -0.66% Year-to-date Change: -22.9% | |
| UI Links: Profile News Message Board | |
| Charts:- Daily , Weekly | |
| Add UI to Watchlist: View: Get Complete UI Trend Analysis ➞ | |
 | RBLX Roblox Corporation |
| Sector: Services & Goods | |
| SubSector: Electronic Gaming & Multimedia | |
| MarketCap: 25420 Millions | |
| Recent Price: 35.56 Smart Investing & Trading Score: 35 | |
| Day Percent Change: -2.74% Day Change: -1.00 | |
| Week Change: -1.25% Year-to-date Change: -22.9% | |
| RBLX Links: Profile News Message Board | |
| Charts:- Daily , Weekly | |
| Add RBLX to Watchlist: View: Get Complete RBLX Trend Analysis ➞ | |
 | S SentinelOne, Inc. |
| Sector: Technology | |
| SubSector: Software - Infrastructure | |
| MarketCap: 4420 Millions | |
| Recent Price: 21.13 Smart Investing & Trading Score: 30 | |
| Day Percent Change: -2.63% Day Change: -0.57 | |
| Week Change: -1.99% Year-to-date Change: -23.0% | |
| S Links: Profile News Message Board | |
| Charts:- Daily , Weekly | |
| Add S to Watchlist: View: Get Complete S Trend Analysis ➞ | |
 | BEN Franklin Resources, Inc. |
| Sector: Financials | |
| SubSector: Asset Management | |
| MarketCap: 9419.73 Millions | |
| Recent Price: 22.84 Smart Investing & Trading Score: 0 | |
| Day Percent Change: -2.31% Day Change: -0.54 | |
| Week Change: -8.6% Year-to-date Change: -23.3% | |
| BEN Links: Profile News Message Board | |
| Charts:- Daily , Weekly | |
| Add BEN to Watchlist: View: Get Complete BEN Trend Analysis ➞ | |
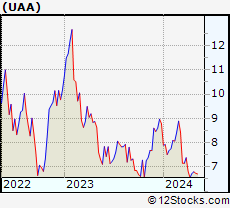 | UAA Under Armour, Inc. |
| Sector: Consumer Staples | |
| SubSector: Textile - Apparel Clothing | |
| MarketCap: 4066.75 Millions | |
| Recent Price: 6.73 Smart Investing & Trading Score: 50 | |
| Day Percent Change: -1.46% Day Change: -0.10 | |
| Week Change: -1.03% Year-to-date Change: -23.4% | |
| UAA Links: Profile News Message Board | |
| Charts:- Daily , Weekly | |
| Add UAA to Watchlist: View: Get Complete UAA Trend Analysis ➞ | |
 | BILL Bill.com Holdings, Inc. |
| Sector: Technology | |
| SubSector: Application Software | |
| MarketCap: 3068.42 Millions | |
| Recent Price: 62.36 Smart Investing & Trading Score: 74 | |
| Day Percent Change: -1.05% Day Change: -0.66 | |
| Week Change: -0.13% Year-to-date Change: -23.6% | |
| BILL Links: Profile News Message Board | |
| Charts:- Daily , Weekly | |
| Add BILL to Watchlist: View: Get Complete BILL Trend Analysis ➞ | |
 | CZR Caesars Entertainment Corporation |
| Sector: Services & Goods | |
| SubSector: Resorts & Casinos | |
| MarketCap: 4618.44 Millions | |
| Recent Price: 35.82 Smart Investing & Trading Score: 20 | |
| Day Percent Change: -4.66% Day Change: -1.75 | |
| Week Change: -2.16% Year-to-date Change: -23.6% | |
| CZR Links: Profile News Message Board | |
| Charts:- Daily , Weekly | |
| Add CZR to Watchlist: View: Get Complete CZR Trend Analysis ➞ | |
 | PATH UiPath Inc. |
| Sector: Technology | |
| SubSector: Software - Infrastructure | |
| MarketCap: 9580 Millions | |
| Recent Price: 18.97 Smart Investing & Trading Score: 35 | |
| Day Percent Change: -4.00% Day Change: -0.79 | |
| Week Change: -2.52% Year-to-date Change: -23.7% | |
| PATH Links: Profile News Message Board | |
| Charts:- Daily , Weekly | |
| Add PATH to Watchlist: View: Get Complete PATH Trend Analysis ➞ | |
 | REXR Rexford Industrial Realty, Inc. |
| Sector: Financials | |
| SubSector: REIT - Industrial | |
| MarketCap: 4185.99 Millions | |
| Recent Price: 42.81 Smart Investing & Trading Score: 35 | |
| Day Percent Change: -1.34% Day Change: -0.58 | |
| Week Change: -0.9% Year-to-date Change: -23.7% | |
| REXR Links: Profile News Message Board | |
| Charts:- Daily , Weekly | |
| Add REXR to Watchlist: View: Get Complete REXR Trend Analysis ➞ | |
 | ALNY Alnylam Pharmaceuticals, Inc. |
| Sector: Health Care | |
| SubSector: Biotechnology | |
| MarketCap: 12793.2 Millions | |
| Recent Price: 143.95 Smart Investing & Trading Score: 42 | |
| Day Percent Change: -2.31% Day Change: -3.41 | |
| Week Change: 0.45% Year-to-date Change: -24.8% | |
| ALNY Links: Profile News Message Board | |
| Charts:- Daily , Weekly | |
| Add ALNY to Watchlist: View: Get Complete ALNY Trend Analysis ➞ | |
 | GLOB Globant S.A. |
| Sector: Technology | |
| SubSector: Information Technology Services | |
| MarketCap: 2976.88 Millions | |
| Recent Price: 178.59 Smart Investing & Trading Score: 28 | |
| Day Percent Change: -2.67% Day Change: -4.90 | |
| Week Change: -1.24% Year-to-date Change: -25.0% | |
| GLOB Links: Profile News Message Board | |
| Charts:- Daily , Weekly | |
| Add GLOB to Watchlist: View: Get Complete GLOB Trend Analysis ➞ | |
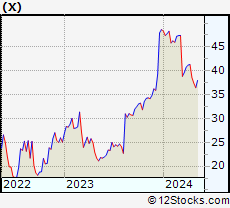 | X United States Steel Corporation |
| Sector: Materials | |
| SubSector: Steel & Iron | |
| MarketCap: 1062.88 Millions | |
| Recent Price: 36.50 Smart Investing & Trading Score: 20 | |
| Day Percent Change: -1.24% Day Change: -0.46 | |
| Week Change: -2.46% Year-to-date Change: -25.0% | |
| X Links: Profile News Message Board | |
| Charts:- Daily , Weekly | |
| Add X to Watchlist: View: Get Complete X Trend Analysis ➞ | |
 | IRDM Iridium Communications Inc. |
| Sector: Technology | |
| SubSector: Diversified Communication Services | |
| MarketCap: 2711.24 Millions | |
| Recent Price: 30.79 Smart Investing & Trading Score: 67 | |
| Day Percent Change: -3.18% Day Change: -1.01 | |
| Week Change: -1.85% Year-to-date Change: -25.2% | |
| IRDM Links: Profile News Message Board | |
| Charts:- Daily , Weekly | |
| Add IRDM to Watchlist: View: Get Complete IRDM Trend Analysis ➞ | |
| For tabular summary view of above stock list: Summary View ➞ 0 - 25 , 25 - 50 , 50 - 75 , 75 - 100 , 100 - 125 , 125 - 150 , 150 - 175 , 175 - 200 , 200 - 225 , 225 - 250 , 250 - 275 , 275 - 300 , 300 - 325 , 325 - 350 , 350 - 375 , 375 - 400 , 400 - 425 , 425 - 450 , 450 - 475 , 475 - 500 , 500 - 525 , 525 - 550 , 550 - 575 , 575 - 600 , 600 - 625 , 625 - 650 , 650 - 675 , 675 - 700 , 700 - 725 , 725 - 750 , 750 - 775 | ||
| Click To Change The Sort Order: By Market Cap or Company Size Performance: Year-to-date, Week and Day | |
| Select Chart Type: | ||
|
Best Stocks Today 12Stocks.com |
© 2024 12Stocks.com Terms & Conditions Privacy Contact Us
All Information Provided Only For Education And Not To Be Used For Investing or Trading. See Terms & Conditions


One More Thing ... Get Best Stocks Delivered Daily!
Never Ever Miss A Move With Our Top Ten Stocks Lists
Find Best Stocks In Any Market - Bull or Bear Market
Take A Peek At Our Top Ten Stocks Lists: Daily, Weekly, Year-to-Date & Top Trends
Find Best Stocks In Any Market - Bull or Bear Market
Take A Peek At Our Top Ten Stocks Lists: Daily, Weekly, Year-to-Date & Top Trends
Midcap Stocks With Best Up Trends [0-bearish to 100-bullish]: Tenet [100], Sensata Technologies[100], Leidos [100], Corning [100], Zebra Technologies[100], Timken [100], CAVA [100], Campbell Soup[100], Mosaic [100], Federal Realty[100], Public Service[100]
Best Midcap Stocks Year-to-Date:
Vistra Energy[96.88%], AppLovin [77.26%], ShockWave Medical[73.27%], EMCOR [65.79%], CAVA [65.46%], Constellation Energy[58.77%], Wingstop [49.97%], Antero Resources[49.96%], Spotify [49.24%], Tenet [48.59%], Natera [48.28%] Best Midcap Stocks This Week:
Tenet [16.81%], agilon health[10%], Sensata Technologies[9.52%], Woodward [7.82%], Leidos [7.56%], Corning [6.54%], Maravai LifeSciences[6.49%], 10x Genomics[6.13%], Domino s[6.05%], Zebra Technologies[5.84%], Timken [4.99%] Best Midcap Stocks Daily:
Tenet [13.25%], Woodward [7.47%], agilon health[7.21%], Sensata Technologies[7.13%], Leidos [6.53%], Corning [5.03%], Zebra Technologies[4.85%], Maravai LifeSciences[4.46%], 10x Genomics[3.10%], Quidel [3.02%], Timken [2.91%]