
 Login Sign Up


| |||||
 |  | ||||

| 12Stocks.com Market Intelligence |
Best MidCap Stocks
|
| In a hurry? Mid Cap Stocks Lists: Performance Trends Table, Stock Charts
Sort midcap stocks: Daily, Weekly, Year-to-Date, Market Cap & Trends. Filter midcap stocks list by sector: Show all, Tech, Finance, Energy, Staples, Retail, Industrial, Materials, Utilities and HealthCare Filter midcap stocks list by size:All MidCap Large Mid-Range Small |
| 12Stocks.com Mid Cap Stocks Performances & Trends Daily | |||||||||
|
|  The overall Smart Investing & Trading Score is 56 (0-bearish to 100-bullish) which puts Mid Cap index in short term neutral trend. The Smart Investing & Trading Score from previous trading session is 49 and hence an improvement of trend.
| ||||||||
Here are the Smart Investing & Trading Scores of the most requested mid cap stocks at 12Stocks.com (click stock name for detailed review):
|


| 12Stocks.com: Top Performing Mid Cap Index Stocks | ||||||||||||||||||||||||||||||||||||||||||||||||
 The top performing Mid Cap Index stocks year to date are
Now, more recently, over last week, the top performing Mid Cap Index stocks on the move are


|
||||||||||||||||||||||||||||||||||||||||||||||||
| 12Stocks.com: Investing in Midcap Index with Stocks | |
|
The following table helps investors and traders sort through current performance and trends (as measured by Smart Investing & Trading Score) of various
stocks in the Midcap Index. Quick View: Move mouse or cursor over stock symbol (ticker) to view short-term technical chart and over stock name to view long term chart. Click on  to add stock symbol to your watchlist and to add stock symbol to your watchlist and  to view watchlist. Click on any ticker or stock name for detailed market intelligence report for that stock. to view watchlist. Click on any ticker or stock name for detailed market intelligence report for that stock. |
12Stocks.com Performance of Stocks in Midcap Index
| Ticker | Stock Name | Watchlist | Category | Recent Price | Smart Investing & Trading Score | Change % | Weekly Change% |
| DT | Dynatrace |   | Technology | 47.10 | 64 | 1.07% | 3.74% |
| TRMB | Trimble | | Technology | 60.13 | 68 | 1.55% | 3.73% |
| PRGO | Perrigo | | Health Care | 31.94 | 87 | 2.14% | 3.70% |
| TDC | Teradata | | Technology | 37.67 | 49 | 0.16% | 3.69% |
| GNRC | Generac | | Industrials | 140.12 | 100 | 0.91% | 3.68% |
| VMC | Vulcan Materials | | Industrials | 261.24 | 58 | 1.04% | 3.64% |
| SNX | SYNNEX | | Technology | 117.44 | 93 | 0.05% | 3.64% |
| CERT | Certara | | Health Care | 16.51 | 53 | 2.20% | 3.64% |
| ANSS | ANSYS | | Technology | 333.80 | 68 | 2.07% | 3.63% |
| DASH | DoorDash | | Technology | 132.09 | 63 | 4.59% | 3.62% |
| SAIC | Science Applications | | Technology | 129.44 | 83 | 0.24% | 3.60% |
| INSP | Inspire Medical | | Technology | 237.45 | 73 | 2.79% | 3.59% |
| NLY | Annaly Capital | | Financials | 18.88 | 59 | 1.02% | 3.57% |
| XYL | Xylem | | Industrials | 132.40 | 95 | 1.37% | 3.57% |
| PH | Parker-Hannifin | | Industrials | 553.64 | 63 | 0.78% | 3.55% |
| RH | RH | | Services & Goods | 248.91 | 55 | 2.28% | 3.54% |
| AVY | Avery Dennison | | Consumer Staples | 219.03 | 93 | 0.86% | 3.53% |
| OMC | Omnicom | | Services & Goods | 95.89 | 95 | -0.85% | 3.53% |
| TREX | Trex | | Industrials | 90.53 | 58 | 1.25% | 3.52% |
| LW | Lamb Weston | | Consumer Staples | 83.85 | 57 | 0.42% | 3.52% |
| TRGP | Targa Resources | | Energy | 116.86 | 90 | -0.70% | 3.49% |
| NTAP | NetApp | | Technology | 101.36 | 68 | 0.42% | 3.48% |
| FANG | Diamondback Energy | | Energy | 207.72 | 76 | 0.30% | 3.48% |
| CPT | Camden Property | | Financials | 99.62 | 100 | 1.44% | 3.46% |
| WU | Western Union | | Financials | 13.47 | 68 | 1.35% | 3.46% |
| For chart view version of above stock list: Chart View ➞ 0 - 25 , 25 - 50 , 50 - 75 , 75 - 100 , 100 - 125 , 125 - 150 , 150 - 175 , 175 - 200 , 200 - 225 , 225 - 250 , 250 - 275 , 275 - 300 , 300 - 325 , 325 - 350 , 350 - 375 , 375 - 400 , 400 - 425 , 425 - 450 , 450 - 475 , 475 - 500 , 500 - 525 , 525 - 550 , 550 - 575 , 575 - 600 , 600 - 625 , 625 - 650 , 650 - 675 , 675 - 700 , 700 - 725 , 725 - 750 , 750 - 775 | ||
 | Click To Change The Sort Order: By Market Cap or Company Size Performance: Year-to-date, Week and Day |  |
|
Get the most comprehensive stock market coverage daily at 12Stocks.com ➞ Best Stocks Today ➞ Best Stocks Weekly ➞ Best Stocks Year-to-Date ➞ Best Stocks Trends ➞  Best Stocks Today 12Stocks.com Best Nasdaq Stocks ➞ Best S&P 500 Stocks ➞ Best Tech Stocks ➞ Best Biotech Stocks ➞ |
| Detailed Overview of Midcap Stocks |
| Midcap Technical Overview, Leaders & Laggards, Top Midcap ETF Funds & Detailed Midcap Stocks List, Charts, Trends & More |
| Midcap: Technical Analysis, Trends & YTD Performance | |
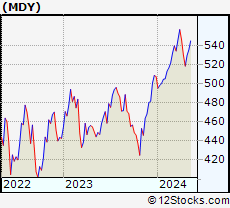
| MidCap segment as represented by
MDY, an exchange-traded fund [ETF], holds basket of about four hundred midcap stocks from across all major sectors of the US stock market. The midcap index (contains stocks like Green Mountain Coffee Roasters and Tractor Supply Company) is up by 4.34% and is currently underperforming the overall market by -1.8% year-to-date. Below is a quick view of technical charts and trends: | |
 MDY Weekly Chart |
|
| Long Term Trend: Very Good | |
| Medium Term Trend: Not Good | |
 MDY Daily Chart |
|
| Short Term Trend: Very Good | |
| Overall Trend Score: 56 | |
| YTD Performance: 4.34% | |
| **Trend Scores & Views Are Only For Educational Purposes And Not For Investing | |
| 12Stocks.com: Investing in Midcap Index using Exchange Traded Funds | |
|
The following table shows list of key exchange traded funds (ETF) that
help investors track Midcap index. The following list also includes leveraged ETF funds that track twice or thrice the daily returns of Midcap indices. Short or inverse ETF funds move in the opposite direction to the index they track and are useful during market pullbacks or during bear markets. Quick View: Move mouse or cursor over ETF symbol (ticker) to view short-term technical chart and over ETF name to view long term chart. Click on ticker or stock name for detailed view. Click on to add stock symbol to your watchlist and to view watchlist. |
12Stocks.com List of ETFs that track Midcap Index
| Ticker | ETF Name | Watchlist | Recent Price | Smart Investing & Trading Score | Change % | Week % | Year-to-date % |
| IJH | iShares Core S&P Mid-Cap | | 57.82 | 68 | 0.24 | 2.19 | 4.31% |
| IWR | iShares Russell Mid-Cap | | 80.52 | 63 | 0.31 | 2.36 | 3.59% |
| MDY | SPDR S&P MidCap 400 ETF | | 529.38 | 56 | 0.29 | 2.14 | 4.34% |
| IWP | iShares Russell Mid-Cap Growth | | 108.98 | 58 | 0.48 | 3.1 | 4.33% |
| IWS | iShares Russell Mid-Cap Value | | 119.99 | 68 | 0.17 | 1.99 | 3.18% |
| IJK | iShares S&P Mid-Cap 400 Growth | | 87.00 | 63 | 0.30 | 2.53 | 9.82% |
| IJJ | iShares S&P Mid-Cap 400 Value | | 112.23 | 58 | 0.25 | 1.52 | -1.59% |
| XMLV | PowerShares S&P MidCap Low Volatil ETF | | 54.73 | 75 | -0.02 | 1.05 | 2.91% |
| SMDD | ProShares UltraPro Short MidCap400 | | 11.77 | 40 | -1.01 | -6.31 | -12.58% |
| UMDD | ProShares UltraPro MidCap400 | | 23.96 | 63 | 1.01 | 6.19 | 7.35% |
| MYY | ProShares Short MidCap400 | | 20.79 | 40 | -0.86 | -1.88 | -3.1% |
| MZZ | ProShares UltraShort MidCap400 | | 11.68 | 27 | -0.60 | -4.03 | -7.09% |
| MVV | ProShares Ultra MidCap400 | | 61.72 | 48 | 1.13 | 4.61 | 6.62% |
| 12Stocks.com: Charts, Trends, Fundamental Data and Performances of MidCap Stocks | |
|
We now take in-depth look at all MidCap stocks including charts, multi-period performances and overall trends (as measured by Smart Investing & Trading Score). One can sort MidCap stocks (click link to choose) by Daily, Weekly and by Year-to-Date performances. Also, one can sort by size of the company or by market capitalization. |
| Select Your Default Chart Type: | |||||
| |||||
| Click on stock symbol or name for detailed view. Click on to add stock symbol to your watchlist and to view watchlist. Quick View: Move mouse or cursor over "Daily" to quickly view daily technical stock chart and over "Weekly" to view weekly technical stock chart. | |||||

 | DT Dynatrace, Inc. |
| Sector: Technology | |
| SubSector: Application Software | |
| MarketCap: 7007.12 Millions | |
| Recent Price: 47.10 Smart Investing & Trading Score: 64 | |
| Day Percent Change: 1.07% Day Change: 0.50 | |
| Week Change: 3.74% Year-to-date Change: -13.9% | |
| DT Links: Profile News Message Board | |
| Charts:- Daily , Weekly | |
| Add DT to Watchlist: View: Get Complete DT Trend Analysis ➞ | |
 | TRMB Trimble Inc. |
| Sector: Technology | |
| SubSector: Scientific & Technical Instruments | |
| MarketCap: 7990.33 Millions | |
| Recent Price: 60.13 Smart Investing & Trading Score: 68 | |
| Day Percent Change: 1.55% Day Change: 0.92 | |
| Week Change: 3.73% Year-to-date Change: 13.0% | |
| TRMB Links: Profile News Message Board | |
| Charts:- Daily , Weekly | |
| Add TRMB to Watchlist: View: Get Complete TRMB Trend Analysis ➞ | |
 | PRGO Perrigo Company plc |
| Sector: Health Care | |
| SubSector: Drug Related Products | |
| MarketCap: 6493.93 Millions | |
| Recent Price: 31.94 Smart Investing & Trading Score: 87 | |
| Day Percent Change: 2.14% Day Change: 0.67 | |
| Week Change: 3.7% Year-to-date Change: -0.8% | |
| PRGO Links: Profile News Message Board | |
| Charts:- Daily , Weekly | |
| Add PRGO to Watchlist: View: Get Complete PRGO Trend Analysis ➞ | |
 | TDC Teradata Corporation |
| Sector: Technology | |
| SubSector: Information Technology Services | |
| MarketCap: 2229.48 Millions | |
| Recent Price: 37.67 Smart Investing & Trading Score: 49 | |
| Day Percent Change: 0.16% Day Change: 0.06 | |
| Week Change: 3.69% Year-to-date Change: -13.4% | |
| TDC Links: Profile News Message Board | |
| Charts:- Daily , Weekly | |
| Add TDC to Watchlist: View: Get Complete TDC Trend Analysis ➞ | |
 | GNRC Generac Holdings Inc. |
| Sector: Industrials | |
| SubSector: Diversified Machinery | |
| MarketCap: 5736.26 Millions | |
| Recent Price: 140.12 Smart Investing & Trading Score: 100 | |
| Day Percent Change: 0.91% Day Change: 1.27 | |
| Week Change: 3.68% Year-to-date Change: 8.4% | |
| GNRC Links: Profile News Message Board | |
| Charts:- Daily , Weekly | |
| Add GNRC to Watchlist: View: Get Complete GNRC Trend Analysis ➞ | |
 | VMC Vulcan Materials Company |
| Sector: Industrials | |
| SubSector: General Building Materials | |
| MarketCap: 12304.7 Millions | |
| Recent Price: 261.24 Smart Investing & Trading Score: 58 | |
| Day Percent Change: 1.04% Day Change: 2.70 | |
| Week Change: 3.64% Year-to-date Change: 15.1% | |
| VMC Links: Profile News Message Board | |
| Charts:- Daily , Weekly | |
| Add VMC to Watchlist: View: Get Complete VMC Trend Analysis ➞ | |
 | SNX SYNNEX Corporation |
| Sector: Technology | |
| SubSector: Information Technology Services | |
| MarketCap: 4519.48 Millions | |
| Recent Price: 117.44 Smart Investing & Trading Score: 93 | |
| Day Percent Change: 0.05% Day Change: 0.06 | |
| Week Change: 3.64% Year-to-date Change: 9.1% | |
| SNX Links: Profile News Message Board | |
| Charts:- Daily , Weekly | |
| Add SNX to Watchlist: View: Get Complete SNX Trend Analysis ➞ | |
 | CERT Certara, Inc. |
| Sector: Health Care | |
| SubSector: Biotechnology | |
| MarketCap: 21487 Millions | |
| Recent Price: 16.51 Smart Investing & Trading Score: 53 | |
| Day Percent Change: 2.20% Day Change: 0.36 | |
| Week Change: 3.64% Year-to-date Change: -6.2% | |
| CERT Links: Profile News Message Board | |
| Charts:- Daily , Weekly | |
| Add CERT to Watchlist: View: Get Complete CERT Trend Analysis ➞ | |
 | ANSS ANSYS, Inc. |
| Sector: Technology | |
| SubSector: Application Software | |
| MarketCap: 19497.4 Millions | |
| Recent Price: 333.80 Smart Investing & Trading Score: 68 | |
| Day Percent Change: 2.07% Day Change: 6.76 | |
| Week Change: 3.63% Year-to-date Change: -8.0% | |
| ANSS Links: Profile News Message Board | |
| Charts:- Daily , Weekly | |
| Add ANSS to Watchlist: View: Get Complete ANSS Trend Analysis ➞ | |
 | DASH DoorDash, Inc. |
| Sector: Technology | |
| SubSector: Internet Content & Information | |
| MarketCap: 59087 Millions | |
| Recent Price: 132.09 Smart Investing & Trading Score: 63 | |
| Day Percent Change: 4.59% Day Change: 5.80 | |
| Week Change: 3.62% Year-to-date Change: 33.7% | |
| DASH Links: Profile News Message Board | |
| Charts:- Daily , Weekly | |
| Add DASH to Watchlist: View: Get Complete DASH Trend Analysis ➞ | |
 | SAIC Science Applications International Corporation |
| Sector: Technology | |
| SubSector: Information Technology Services | |
| MarketCap: 3388.78 Millions | |
| Recent Price: 129.44 Smart Investing & Trading Score: 83 | |
| Day Percent Change: 0.24% Day Change: 0.31 | |
| Week Change: 3.6% Year-to-date Change: 4.1% | |
| SAIC Links: Profile News Message Board | |
| Charts:- Daily , Weekly | |
| Add SAIC to Watchlist: View: Get Complete SAIC Trend Analysis ➞ | |
 | INSP Inspire Medical Systems, Inc. |
| Sector: Technology | |
| SubSector: Internet Information Providers | |
| MarketCap: 1239.8 Millions | |
| Recent Price: 237.45 Smart Investing & Trading Score: 73 | |
| Day Percent Change: 2.79% Day Change: 6.44 | |
| Week Change: 3.59% Year-to-date Change: 16.7% | |
| INSP Links: Profile News Message Board | |
| Charts:- Daily , Weekly | |
| Add INSP to Watchlist: View: Get Complete INSP Trend Analysis ➞ | |
 | NLY Annaly Capital Management, Inc. |
| Sector: Financials | |
| SubSector: Mortgage Investment | |
| MarketCap: 9127.79 Millions | |
| Recent Price: 18.88 Smart Investing & Trading Score: 59 | |
| Day Percent Change: 1.02% Day Change: 0.19 | |
| Week Change: 3.57% Year-to-date Change: -2.5% | |
| NLY Links: Profile News Message Board | |
| Charts:- Daily , Weekly | |
| Add NLY to Watchlist: View: Get Complete NLY Trend Analysis ➞ | |
 | XYL Xylem Inc. |
| Sector: Industrials | |
| SubSector: Diversified Machinery | |
| MarketCap: 12195.1 Millions | |
| Recent Price: 132.40 Smart Investing & Trading Score: 95 | |
| Day Percent Change: 1.37% Day Change: 1.79 | |
| Week Change: 3.57% Year-to-date Change: 15.8% | |
| XYL Links: Profile News Message Board | |
| Charts:- Daily , Weekly | |
| Add XYL to Watchlist: View: Get Complete XYL Trend Analysis ➞ | |
 | PH Parker-Hannifin Corporation |
| Sector: Industrials | |
| SubSector: Industrial Equipment & Components | |
| MarketCap: 14888.9 Millions | |
| Recent Price: 553.64 Smart Investing & Trading Score: 63 | |
| Day Percent Change: 0.78% Day Change: 4.26 | |
| Week Change: 3.55% Year-to-date Change: 20.2% | |
| PH Links: Profile News Message Board | |
| Charts:- Daily , Weekly | |
| Add PH to Watchlist: View: Get Complete PH Trend Analysis ➞ | |
 | RH RH |
| Sector: Services & Goods | |
| SubSector: Home Furnishing Stores | |
| MarketCap: 1828.25 Millions | |
| Recent Price: 248.91 Smart Investing & Trading Score: 55 | |
| Day Percent Change: 2.28% Day Change: 5.54 | |
| Week Change: 3.54% Year-to-date Change: -14.6% | |
| RH Links: Profile News Message Board | |
| Charts:- Daily , Weekly | |
| Add RH to Watchlist: View: Get Complete RH Trend Analysis ➞ | |
 | AVY Avery Dennison Corporation |
| Sector: Consumer Staples | |
| SubSector: Business Equipment | |
| MarketCap: 8051.27 Millions | |
| Recent Price: 219.03 Smart Investing & Trading Score: 93 | |
| Day Percent Change: 0.86% Day Change: 1.87 | |
| Week Change: 3.53% Year-to-date Change: 8.3% | |
| AVY Links: Profile News Message Board | |
| Charts:- Daily , Weekly | |
| Add AVY to Watchlist: View: Get Complete AVY Trend Analysis ➞ | |
 | OMC Omnicom Group Inc. |
| Sector: Services & Goods | |
| SubSector: Advertising Agencies | |
| MarketCap: 11813.5 Millions | |
| Recent Price: 95.89 Smart Investing & Trading Score: 95 | |
| Day Percent Change: -0.85% Day Change: -0.82 | |
| Week Change: 3.53% Year-to-date Change: 10.8% | |
| OMC Links: Profile News Message Board | |
| Charts:- Daily , Weekly | |
| Add OMC to Watchlist: View: Get Complete OMC Trend Analysis ➞ | |
 | TREX Trex Company, Inc. |
| Sector: Industrials | |
| SubSector: General Building Materials | |
| MarketCap: 4369.23 Millions | |
| Recent Price: 90.53 Smart Investing & Trading Score: 58 | |
| Day Percent Change: 1.25% Day Change: 1.12 | |
| Week Change: 3.52% Year-to-date Change: 9.4% | |
| TREX Links: Profile News Message Board | |
| Charts:- Daily , Weekly | |
| Add TREX to Watchlist: View: Get Complete TREX Trend Analysis ➞ | |
 | LW Lamb Weston Holdings, Inc. |
| Sector: Consumer Staples | |
| SubSector: Food - Major Diversified | |
| MarketCap: 7844.63 Millions | |
| Recent Price: 83.85 Smart Investing & Trading Score: 57 | |
| Day Percent Change: 0.42% Day Change: 0.35 | |
| Week Change: 3.52% Year-to-date Change: -22.4% | |
| LW Links: Profile News Message Board | |
| Charts:- Daily , Weekly | |
| Add LW to Watchlist: View: Get Complete LW Trend Analysis ➞ | |
 | TRGP Targa Resources Corp. |
| Sector: Energy | |
| SubSector: Oil & Gas Pipelines | |
| MarketCap: 2210.65 Millions | |
| Recent Price: 116.86 Smart Investing & Trading Score: 90 | |
| Day Percent Change: -0.70% Day Change: -0.82 | |
| Week Change: 3.49% Year-to-date Change: 34.5% | |
| TRGP Links: Profile News Message Board | |
| Charts:- Daily , Weekly | |
| Add TRGP to Watchlist: View: Get Complete TRGP Trend Analysis ➞ | |
 | NTAP NetApp, Inc. |
| Sector: Technology | |
| SubSector: Data Storage Devices | |
| MarketCap: 9028.89 Millions | |
| Recent Price: 101.36 Smart Investing & Trading Score: 68 | |
| Day Percent Change: 0.42% Day Change: 0.42 | |
| Week Change: 3.48% Year-to-date Change: 15.0% | |
| NTAP Links: Profile News Message Board | |
| Charts:- Daily , Weekly | |
| Add NTAP to Watchlist: View: Get Complete NTAP Trend Analysis ➞ | |
 | FANG Diamondback Energy, Inc. |
| Sector: Energy | |
| SubSector: Independent Oil & Gas | |
| MarketCap: 3009.13 Millions | |
| Recent Price: 207.72 Smart Investing & Trading Score: 76 | |
| Day Percent Change: 0.30% Day Change: 0.62 | |
| Week Change: 3.48% Year-to-date Change: 33.9% | |
| FANG Links: Profile News Message Board | |
| Charts:- Daily , Weekly | |
| Add FANG to Watchlist: View: Get Complete FANG Trend Analysis ➞ | |
 | CPT Camden Property Trust |
| Sector: Financials | |
| SubSector: REIT - Residential | |
| MarketCap: 7535.21 Millions | |
| Recent Price: 99.62 Smart Investing & Trading Score: 100 | |
| Day Percent Change: 1.44% Day Change: 1.41 | |
| Week Change: 3.46% Year-to-date Change: 0.3% | |
| CPT Links: Profile News Message Board | |
| Charts:- Daily , Weekly | |
| Add CPT to Watchlist: View: Get Complete CPT Trend Analysis ➞ | |
 | WU The Western Union Company |
| Sector: Financials | |
| SubSector: Credit Services | |
| MarketCap: 7974.48 Millions | |
| Recent Price: 13.47 Smart Investing & Trading Score: 68 | |
| Day Percent Change: 1.35% Day Change: 0.18 | |
| Week Change: 3.46% Year-to-date Change: 13.0% | |
| WU Links: Profile News Message Board | |
| Charts:- Daily , Weekly | |
| Add WU to Watchlist: View: Get Complete WU Trend Analysis ➞ | |
| For tabular summary view of above stock list: Summary View ➞ 0 - 25 , 25 - 50 , 50 - 75 , 75 - 100 , 100 - 125 , 125 - 150 , 150 - 175 , 175 - 200 , 200 - 225 , 225 - 250 , 250 - 275 , 275 - 300 , 300 - 325 , 325 - 350 , 350 - 375 , 375 - 400 , 400 - 425 , 425 - 450 , 450 - 475 , 475 - 500 , 500 - 525 , 525 - 550 , 550 - 575 , 575 - 600 , 600 - 625 , 625 - 650 , 650 - 675 , 675 - 700 , 700 - 725 , 725 - 750 , 750 - 775 | ||
| Click To Change The Sort Order: By Market Cap or Company Size Performance: Year-to-date, Week and Day | |
| Select Chart Type: | ||
|
Best Stocks Today 12Stocks.com |
© 2024 12Stocks.com Terms & Conditions Privacy Contact Us
All Information Provided Only For Education And Not To Be Used For Investing or Trading. See Terms & Conditions


One More Thing ... Get Best Stocks Delivered Daily!
Never Ever Miss A Move With Our Top Ten Stocks Lists
Find Best Stocks In Any Market - Bull or Bear Market
Take A Peek At Our Top Ten Stocks Lists: Daily, Weekly, Year-to-Date & Top Trends
Find Best Stocks In Any Market - Bull or Bear Market
Take A Peek At Our Top Ten Stocks Lists: Daily, Weekly, Year-to-Date & Top Trends
Midcap Stocks With Best Up Trends [0-bearish to 100-bullish]: ResMed [100], CAVA [100], AutoNation [100], ZoomInfo Technologies[100], Teradyne [100], Allegro Micro[100], Tractor Supply[100], Carrier Global[100], American Homes[100], Mid-America Apartment[100], Zebra Technologies[100]
Best Midcap Stocks Year-to-Date:
Vistra Energy[88.73%], AppLovin [85.5%], ShockWave Medical[73.22%], EMCOR [64.33%], Constellation Energy[60.86%], CAVA [59.06%], Spotify [54.11%], Wingstop [49.13%], Antero Resources[49.03%], Pure Storage[48.49%], Natera [46.34%] Best Midcap Stocks This Week:
HashiCorp [36.05%], ResMed [21.92%], Teradyne [19.07%], MongoDB [17.25%], Kirby [16.9%], Hasbro [16.66%], Ardagh Metal[16.05%], Skechers U.S.A[15.95%], CAVA [15.9%], Tandem Diabetes[15.74%], Antero Resources[15.4%] Best Midcap Stocks Daily:
ResMed [18.89%], Newell [12.39%], Skechers U.S.A[11.20%], Ginkgo Bioworks[10.60%], CAVA [10.50%], QuantumScape [7.65%], AppLovin [6.66%], GameStop [6.16%], Rivian Automotive[6.04%], AutoNation [5.92%], ZoomInfo Technologies[5.90%]